6 Traits, 5 tissues, eQTL + sQTL + stQTL – compute ukbb LD, eqtl, sqtl from predictdb; stQTL from Munro et al; post-processing, comparing 2 LD mismatch approaches, problematic genes filtered by PIP + zscore >3
XSun
2024-12-17
Last updated: 2024-12-19
Checks: 6 1
Knit directory: multigroup_ctwas_analysis/
This reproducible R Markdown analysis was created with workflowr (version 1.7.0). The Checks tab describes the reproducibility checks that were applied when the results were created. The Past versions tab lists the development history.
The R Markdown file has unstaged changes. To know which version of
the R Markdown file created these results, you’ll want to first commit
it to the Git repo. If you’re still working on the analysis, you can
ignore this warning. When you’re finished, you can run
wflow_publish to commit the R Markdown file and build the
HTML.
Great job! The global environment was empty. Objects defined in the global environment can affect the analysis in your R Markdown file in unknown ways. For reproduciblity it’s best to always run the code in an empty environment.
The command set.seed(20231112) was run prior to running
the code in the R Markdown file. Setting a seed ensures that any results
that rely on randomness, e.g. subsampling or permutations, are
reproducible.
Great job! Recording the operating system, R version, and package versions is critical for reproducibility.
Nice! There were no cached chunks for this analysis, so you can be confident that you successfully produced the results during this run.
Great job! Using relative paths to the files within your workflowr project makes it easier to run your code on other machines.
Great! You are using Git for version control. Tracking code development and connecting the code version to the results is critical for reproducibility.
The results in this page were generated with repository version 65c1ad1. See the Past versions tab to see a history of the changes made to the R Markdown and HTML files.
Note that you need to be careful to ensure that all relevant files for
the analysis have been committed to Git prior to generating the results
(you can use wflow_publish or
wflow_git_commit). workflowr only checks the R Markdown
file, but you know if there are other scripts or data files that it
depends on. Below is the status of the Git repository when the results
were generated:
Ignored files:
    Ignored:    .Rhistory

Unstaged changes:
    Modified:   analysis/multi_group_6traits_15weights_ess_postprocessing_compare_nozfilter.Rmd
    Modified:   analysis/multi_group_6traits_15weights_ess_postprocessing_compare_pipz.Rmd
Note that any generated files, e.g. HTML, png, CSS, etc., are not included in this status report because it is ok for generated content to have uncommitted changes.
These are the previous versions of the repository in which changes were
made to the R Markdown
(analysis/multi_group_6traits_15weights_ess_postprocessing_compare_pipz.Rmd)
and HTML
(docs/multi_group_6traits_15weights_ess_postprocessing_compare_pipz.html)
files. If you’ve configured a remote Git repository (see
?wflow_git_remote), click on the hyperlinks in the table
below to view the files as they were in that past version.
| File | Version | Author | Date | Message |
|---|---|---|---|---|
| Rmd | 65c1ad1 | XSun | 2024-12-19 | update |
| html | 65c1ad1 | XSun | 2024-12-19 | update |
Introduction
We compare post-processed results with the original results: https://sq-96.github.io/multigroup_ctwas_analysis/multi_group_6traits_15weights_ess.html
The post-processing steps include the following:
Region Merging
For the regions with
susie_pip > 0.5LD Mismatch Fixing
- Regions were selected where nonSNP_PIP > 0.5.
- For genes with
susie_pip > thresholds(0.5 and 0.2), we performed LD mismatch diagnosis. - To address LD mismatches, two strategies were employed:
- Fine-mapping the region without LD.
- Removing mismatched SNPs for all genes in the problematic regions, updating gene Z-scores, re-estimated L, and re-fine-mapping with LD.
The problematic regions here are the regions 1) reported by
diagnose_LD_mismatch_susie function & 2) containing at
least 1 problematic genes reported by get_problematic_genes
function.
library(ctwas)
library(EnsDb.Hsapiens.v86)
library(ggplot2)
library(gridExtra)
library(dplyr)

ens_db <- EnsDb.Hsapiens.v86

mapping_predictdb <- readRDS("/project2/xinhe/shared_data/multigroup_ctwas/weights/mapping_files/PredictDB_mapping.RDS")
mapping_munro <- readRDS("/project2/xinhe/shared_data/multigroup_ctwas/weights/mapping_files/Munro_mapping.RDS")
mapping_two <- rbind(mapping_predictdb,mapping_munro)
aFib-ebi-a-GCST006414
trait <- "aFib-ebi-a-GCST006414"

results_dir_origin <- paste0("/project/xinhe/xsun/multi_group_ctwas/11.multi_group_1008/results/",trait,"/")
ctwas_res_origin <- readRDS(paste0(results_dir_origin,trait,".ctwas.res.RDS"))

finemap_res_origin <- ctwas_res_origin$finemap_res
Region merge
load(paste0("/project/xinhe/xsun/multi_group_ctwas/11.multi_group_1008/post_process_rm_ld/rm_",trait,".rdata"))

finemap_res_rm <- res_regionmerge$finemap_res
finemap_res_rm_boundary_genes <- finemap_res_rm[finemap_res_rm$id %in%selected_boundary_genes$id,]
finemap_res_rm_boundary_genes_pip <- finemap_res_rm_boundary_genes[,c("id","susie_pip","cs")]


finemap_res_origin_boundary_genes <- finemap_res_origin[finemap_res_origin$id %in%selected_boundary_genes$id,]
finemap_res_origin_boundary_genes_pip <- finemap_res_origin_boundary_genes[,c("id","susie_pip","cs")]

finemap_res_compare_regionmerge <- merge(finemap_res_origin_boundary_genes_pip,finemap_res_rm_boundary_genes_pip, by = "id")
colnames(finemap_res_compare_regionmerge) <- c("id","susie_pip_origin","cs_origin","susie_pip_reginmerge","cs_reginmerge")

DT::datatable(finemap_res_compare_regionmerge,caption = htmltools::tags$caption( style = 'caption-side: left; text-align: left; color:black;  font-size:150% ;','Selected boundary genes (susie_pip > 0.5)'),options = list(pageLength = 10) )
LD-mismatch
Diagnosis
file_pipthreshold02 <- paste0("/project/xinhe/xsun/multi_group_ctwas/11.multi_group_1008/post_process_rm_ld/ldmismatch_diagnosis_pipthres02_", trait, ".rdata")

load(file_pipthreshold02)
pip_02 <- data.frame(
  "PIP Threshold" = "0.2",
  "Number of Selected Regions" = length(selected_region_ids),
  "Number of Problematic Genes" = length(problematic_genes),
  "Number of Problematic Regions" = length(problematic_region_ids),
  "Number of Problematic SNPs" = length(res_ldmismatch$problematic_snps),
  "Number of Flipped SNPs" = length(res_ldmismatch$flipped_snps)
)


file_pipthreshold05 <- paste0("/project/xinhe/xsun/multi_group_ctwas/11.multi_group_1008/post_process_rm_ld/ldmismatch_diagnosis_pipthres05_", trait, ".rdata")

load(file_pipthreshold05)
pip_05 <- data.frame(
  "PIP Threshold" = "0.5",
  "Number of Selected Regions" = length(selected_region_ids),
  "Number of Problematic Genes" = length(problematic_genes),
  "Number of Problematic Regions" = length(problematic_region_ids),
  "Number of Problematic SNPs" = length(res_ldmismatch$problematic_snps),
  "Number of Flipped SNPs" = length(res_ldmismatch$flipped_snps)
)

results_table <- rbind(pip_02, pip_05)

DT::datatable(results_table,caption = htmltools::tags$caption( style = 'caption-side: left; text-align: left; color:black;  font-size:150% ;','LD mismatch diagnosis table for different gene cutoff'),options = list(pageLength = 10) )
Comparing 2 LD mismatch fixing methods
load(paste0("/project/xinhe/xsun/multi_group_ctwas/11.multi_group_1008/post_process_rm_ld/ldmismatch_pipthres05_nold_",trait,".rdata"))
finemap_res_ldmm_nold <- res_ldmm_nold$finemap_res
load(paste0("/project/xinhe/xsun/multi_group_ctwas/11.multi_group_1008/post_process_rm_ld/ldmismatch_pipthres02_removesnp_",trait,".rdata"))
finemap_res_ldmm_removesnp <- res_ldmm_removesnp$finemap_res

finemap_res_ldmm_nold_problematic_gene <- finemap_res_ldmm_nold[finemap_res_ldmm_nold$region_id %in% problematic_region_ids & finemap_res_ldmm_nold$type != "SNP",]
finemap_res_ldmm_removesnp_problematic_gene <- finemap_res_ldmm_removesnp[finemap_res_ldmm_removesnp$region_id %in% problematic_region_ids & finemap_res_ldmm_removesnp$type != "SNP",]

merge_2method <- merge(finemap_res_ldmm_nold_problematic_gene,finemap_res_ldmm_removesnp_problematic_gene, by ="id",all.x=T)
merge_2method$highlight <- ifelse(merge_2method$id %in% problematic_genes, "problematic genes", "good genes")
merge_2method$susie_pip.y[is.na(merge_2method$susie_pip.y)] <- 1.5
p1 <- ggplot(data = merge_2method, aes(x = susie_pip.x, y = susie_pip.y, color = highlight, alpha = highlight)) +
  geom_point() +
  scale_color_manual(values = c("problematic genes" = "red", "good genes" = "black")) +
  scale_alpha_manual(values = c("problematic genes" = 1, "good genes" = 0.1)) +
  labs(x = "PIP_noLD", y = "PIP_removesnp") +
  geom_abline(slope = 1, intercept = 0, col = "red") +
  ggtitle("Problematic regions only, genes only") +
  theme_minimal()

finemap_res_rm_problematic_gene <- finemap_res_rm[finemap_res_rm$region_id %in% problematic_region_ids & finemap_res_rm$type != "SNP",]

merge_rm_ldmm_nold <-  merge(finemap_res_rm_problematic_gene,finemap_res_ldmm_nold_problematic_gene, by ="id",all.x=T)
merge_rm_ldmm_nold$highlight <- ifelse(merge_rm_ldmm_nold$id %in% problematic_genes, "problematic genes", "good genes")
merge_rm_ldmm_nold$susie_pip.y[is.na(merge_rm_ldmm_nold$susie_pip.y)] <- 1.5
p2 <- ggplot(data = merge_rm_ldmm_nold, aes(x= susie_pip.x, y= susie_pip.y, color = highlight, alpha = highlight)) +
  geom_point() +
  labs(x="PIP_after_regionmerge", y="PIP_noLD") +
  scale_color_manual(values = c("problematic genes" = "red", "good genes" = "black")) +
  scale_alpha_manual(values = c("problematic genes" = 1, "good genes" = 0.1)) +
  geom_abline(slope = 1, intercept = 0, col ="red") +
  ggtitle("problematic regions only, genes only") +
  theme_minimal()

merge_rm_ldmm_removesnp <-  merge(finemap_res_rm_problematic_gene,finemap_res_ldmm_removesnp_problematic_gene, by ="id",all.x =T)
merge_rm_ldmm_removesnp$highlight <- ifelse(merge_rm_ldmm_removesnp$id %in% problematic_genes, "problematic genes", "good genes")
merge_rm_ldmm_removesnp$susie_pip.y[is.na(merge_rm_ldmm_removesnp$susie_pip.y)] <- 1.5
p3 <- ggplot(data = merge_rm_ldmm_removesnp, aes(x= susie_pip.x, y= susie_pip.y, color = highlight, alpha = highlight)) +
  geom_point() +
  labs(x="PIP_after_regionmerge", y="PIP_removesnp") +
  scale_alpha_manual(values = c("problematic genes" = 1, "good genes" = 0.1)) +
  scale_color_manual(values = c("problematic genes" = "red", "good genes" = "black")) +
  geom_abline(slope = 1, intercept = 0, col ="red") +
  ggtitle("problematic regions only, genes only") +
  theme_minimal()
print(sprintf("Total number of molecular traits in problematic regions = %s",nrow(merge_rm_ldmm_removesnp)))
[1] "Total number of molecular traits in problematic regions = 1919"print(sprintf("Number of molecular traits disappeared after removing prblematic SNPs = %s", sum(merge_rm_ldmm_removesnp$susie_pip.y == 1.5)))[1] "Number of molecular traits disappeared after removing prblematic SNPs = 4"finemap_res_rm_problematic_gene$highlight <- ifelse(finemap_res_rm_problematic_gene$id %in% problematic_genes, "problematic genes", "good genes")
print(sprintf("The number of problematic genes with PIP < 0.01 = %s",sum(finemap_res_rm_problematic_gene$highlight == "problematic genes" & finemap_res_rm_problematic_gene$susie_pip < 0.01)))[1] "The number of problematic genes with PIP < 0.01 = 1"print("The dots showing PIP =1.5 means: these genes were removed since the only QTLs of them are problematic")[1] "The dots showing PIP =1.5 means: these genes were removed since the only QTLs of them are problematic"grid.arrange(p1,p2,p3, ncol = 3)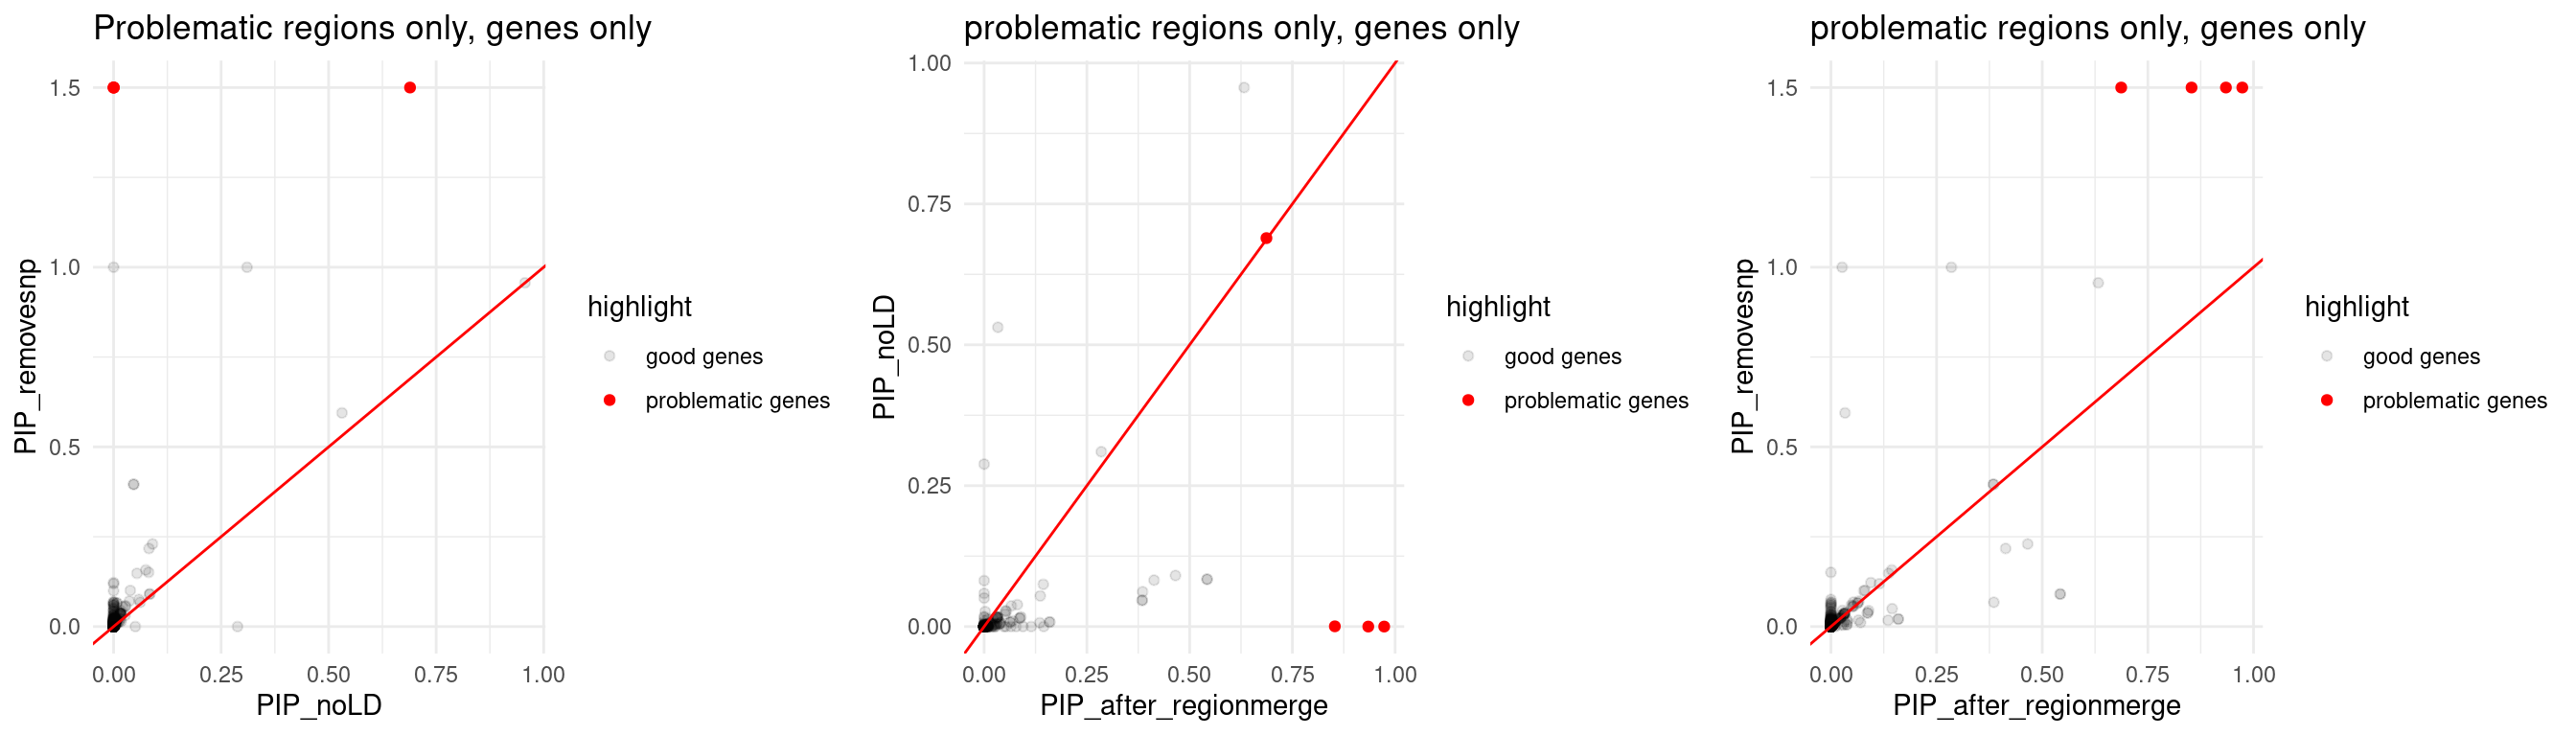
| Version | Author | Date |
|---|---|---|
| 65c1ad1 | XSun | 2024-12-19 |
Comparing z-scores and susie_pip
finemap_res_origin <- ctwas_res_origin$finemap_res
finemap_res_origin_gene <- finemap_res_origin[finemap_res_origin$type != "SNP",]
finemap_res_origin_gene$highlight <- ifelse(finemap_res_origin_gene$id %in% problematic_genes, "problematic genes", "good genes")

p1 <- ggplot(data = finemap_res_origin_gene, aes(x= abs(z), y= susie_pip, color = highlight)) +
  geom_point() +
  scale_color_manual(values = c("problematic genes" = "red", "good genes" = "black")) +
  ggtitle("Original ctwas results") +
  theme_minimal()


finemap_res_rm_gene <- finemap_res_rm[finemap_res_rm$type != "SNP",]
finemap_res_rm_gene$highlight <- ifelse(finemap_res_rm_gene$id %in% problematic_genes, "problematic genes", "good genes")

p2 <- ggplot(data = finemap_res_rm_gene, aes(x= abs(z), y= susie_pip, color = highlight)) +
  geom_point() +
  scale_color_manual(values = c("problematic genes" = "red", "good genes" = "black")) +
  ggtitle("After region merge") +
  theme_minimal()


finemap_res_ldmm_nold_gene <- finemap_res_ldmm_nold[finemap_res_ldmm_nold$type !="SNP",]
finemap_res_ldmm_nold_gene$highlight <- ifelse(finemap_res_ldmm_nold_gene$id %in% problematic_genes, "problematic genes", "good genes")

p3 <- ggplot(data = finemap_res_ldmm_nold_gene, aes(x= abs(z), y= susie_pip, color = highlight)) +
  geom_point() +
  scale_color_manual(values = c("problematic genes" = "red", "good genes" = "black")) +
  ggtitle("After LD mismatch fixed -- noLD") +
  theme_minimal()

finemap_res_ldmm_removesnp_gene <- finemap_res_ldmm_removesnp[finemap_res_ldmm_removesnp$type !="SNP",]
finemap_res_ldmm_removesnp_gene$highlight <- ifelse(finemap_res_ldmm_removesnp_gene$id %in% problematic_genes, "problematic genes", "good genes")

p4 <- ggplot(data = finemap_res_ldmm_removesnp_gene, aes(x= abs(z), y= susie_pip, color = highlight)) +
  geom_point() +
  scale_color_manual(values = c("problematic genes" = "red", "good genes" = "black")) +
  ggtitle("After LD mismatch fixed -- SNP removed") +
  theme_minimal()


grid.arrange(p1,p2,p3,p4, ncol = 4)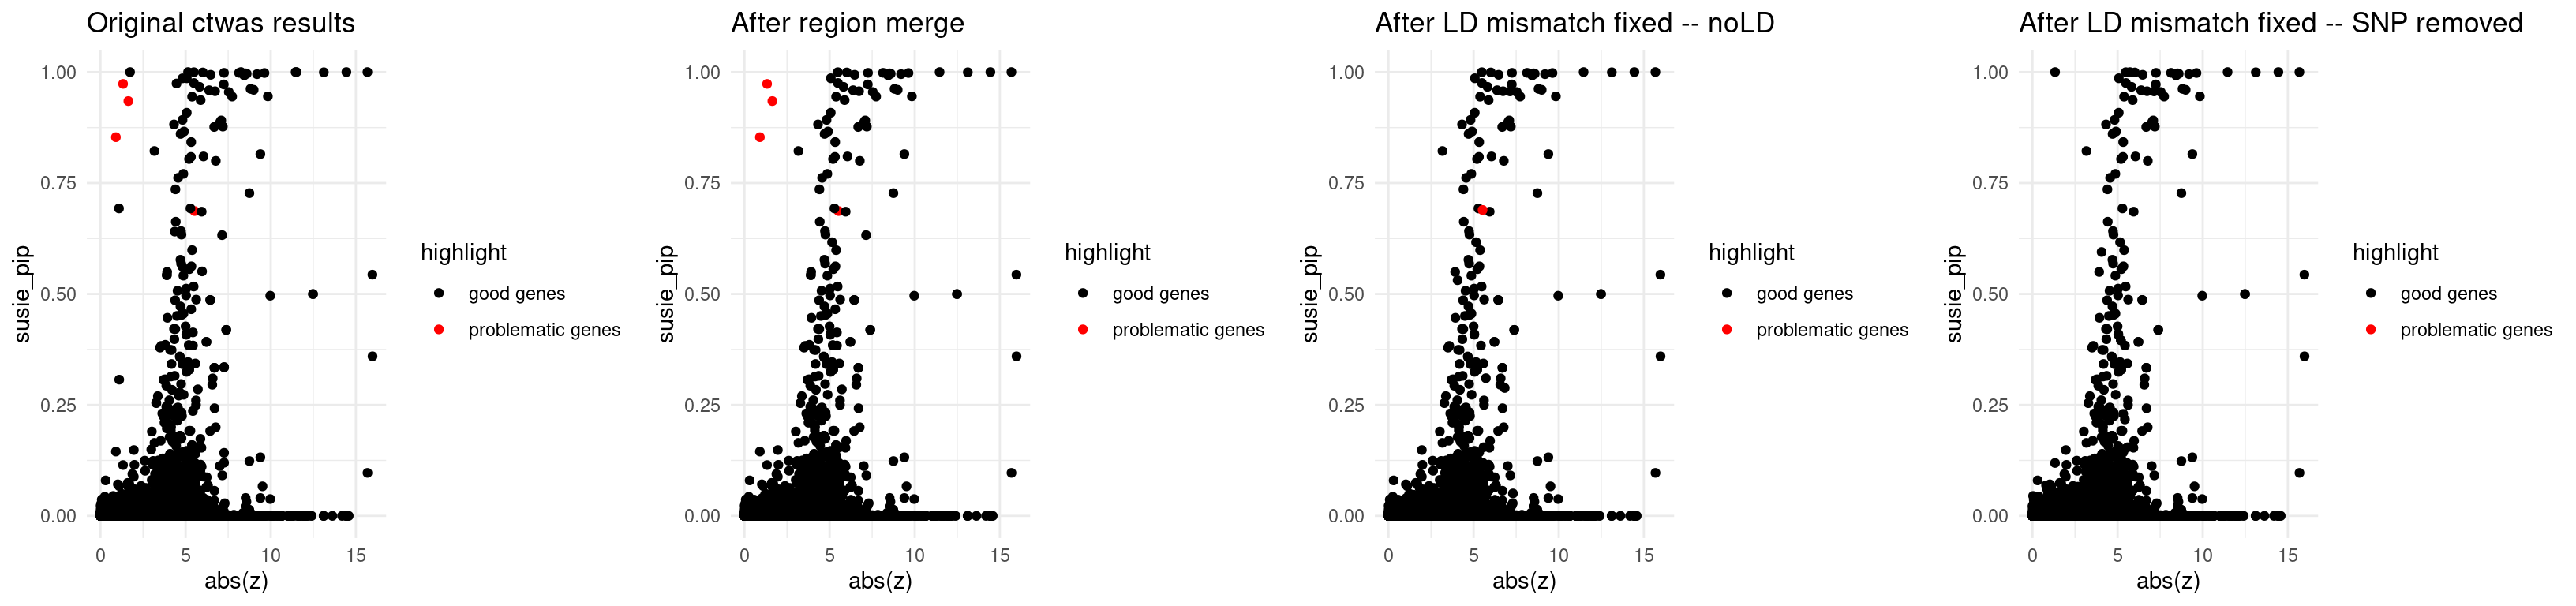
| Version | Author | Date |
|---|---|---|
| 65c1ad1 | XSun | 2024-12-19 |
print("L - estimated in region merge step")[1] "L - estimated in region merge step"print(updated_data_res_regionmerge$updated_region_L[problematic_region_ids]) 1_51248054_53760589 3_110794923_113096852 10_110801735_113568673
1 3 3
11_116512631_117876395 12_121569746_124493434
3 5 load(paste0("/project/xinhe/xsun/multi_group_ctwas/11.multi_group_1008/post_process_rm_ld/ldmismatch_pipthres05_removesnp_rescreenregion_",trait,".rdata"))
print("L - re-estimated after updating z_scores, region data")[1] "L - re-estimated after updating z_scores, region data"print(screen_res$screened_region_L) 1_51248054_53760589 3_110794923_113096852 10_110801735_113568673
1 2 1
11_116512631_117876395 12_121569746_124493434
1 3 print("Zoom in the z<15 part")[1] "Zoom in the z<15 part"finemap_res_origin_gene_prob <- finemap_res_origin_gene[finemap_res_origin_gene$highlight == "problematic genes",]
p1 <- ggplot(data = finemap_res_origin_gene_prob,
aes(x = abs(z), y = susie_pip, color = highlight, alpha = highlight)) +
geom_point() +
scale_color_manual(values = c("problematic genes" = "red", "good genes" = "black")) +
scale_alpha_manual(values = c("problematic genes" = 1, "good genes" = 0.01)) +
ggtitle("Original ctwas results") +
theme_minimal() +
xlim(0, 15)
finemap_res_rm_gene_prob <- finemap_res_rm_gene[finemap_res_rm_gene$highlight == "problematic genes",]
p2 <- ggplot(data = finemap_res_rm_gene_prob,
aes(x = abs(z), y = susie_pip, color = highlight, alpha = highlight)) +
geom_point() +
scale_color_manual(values = c("problematic genes" = "red", "good genes" = "black")) +
scale_alpha_manual(values = c("problematic genes" = 1, "good genes" = 0.01)) +
ggtitle("After region merge") +
theme_minimal() +
xlim(0, 15)
finemap_res_ldmm_nold_gene_prob <- finemap_res_ldmm_nold_gene[finemap_res_ldmm_nold_gene$highlight == "problematic genes",]
p3 <- ggplot(data = finemap_res_ldmm_nold_gene_prob,
aes(x = abs(z), y = susie_pip, color = highlight, alpha = highlight)) +
geom_point() +
scale_color_manual(values = c("problematic genes" = "red", "good genes" = "black")) +
scale_alpha_manual(values = c("problematic genes" = 1, "good genes" = 0.01)) +
ggtitle("After LD mismatch fixed -- noLD") +
theme_minimal() +
xlim(0, 15)
finemap_res_ldmm_removesnp_gene_prob <- finemap_res_ldmm_removesnp_gene[finemap_res_ldmm_removesnp_gene$highlight == "problematic genes",]
p4 <- ggplot(data = finemap_res_ldmm_removesnp_gene_prob,
aes(x = abs(z), y = susie_pip, color = highlight, alpha = highlight)) +
geom_point() +
scale_color_manual(values = c("problematic genes" = "red", "good genes" = "black")) +
scale_alpha_manual(values = c("problematic genes" = 1, "good genes" = 0.01)) +
ggtitle("After LD mismatch fixed -- SNP removed") +
theme_minimal() +
xlim(0, 15)
grid.arrange(p1,p2,p3,p4, ncol = 4)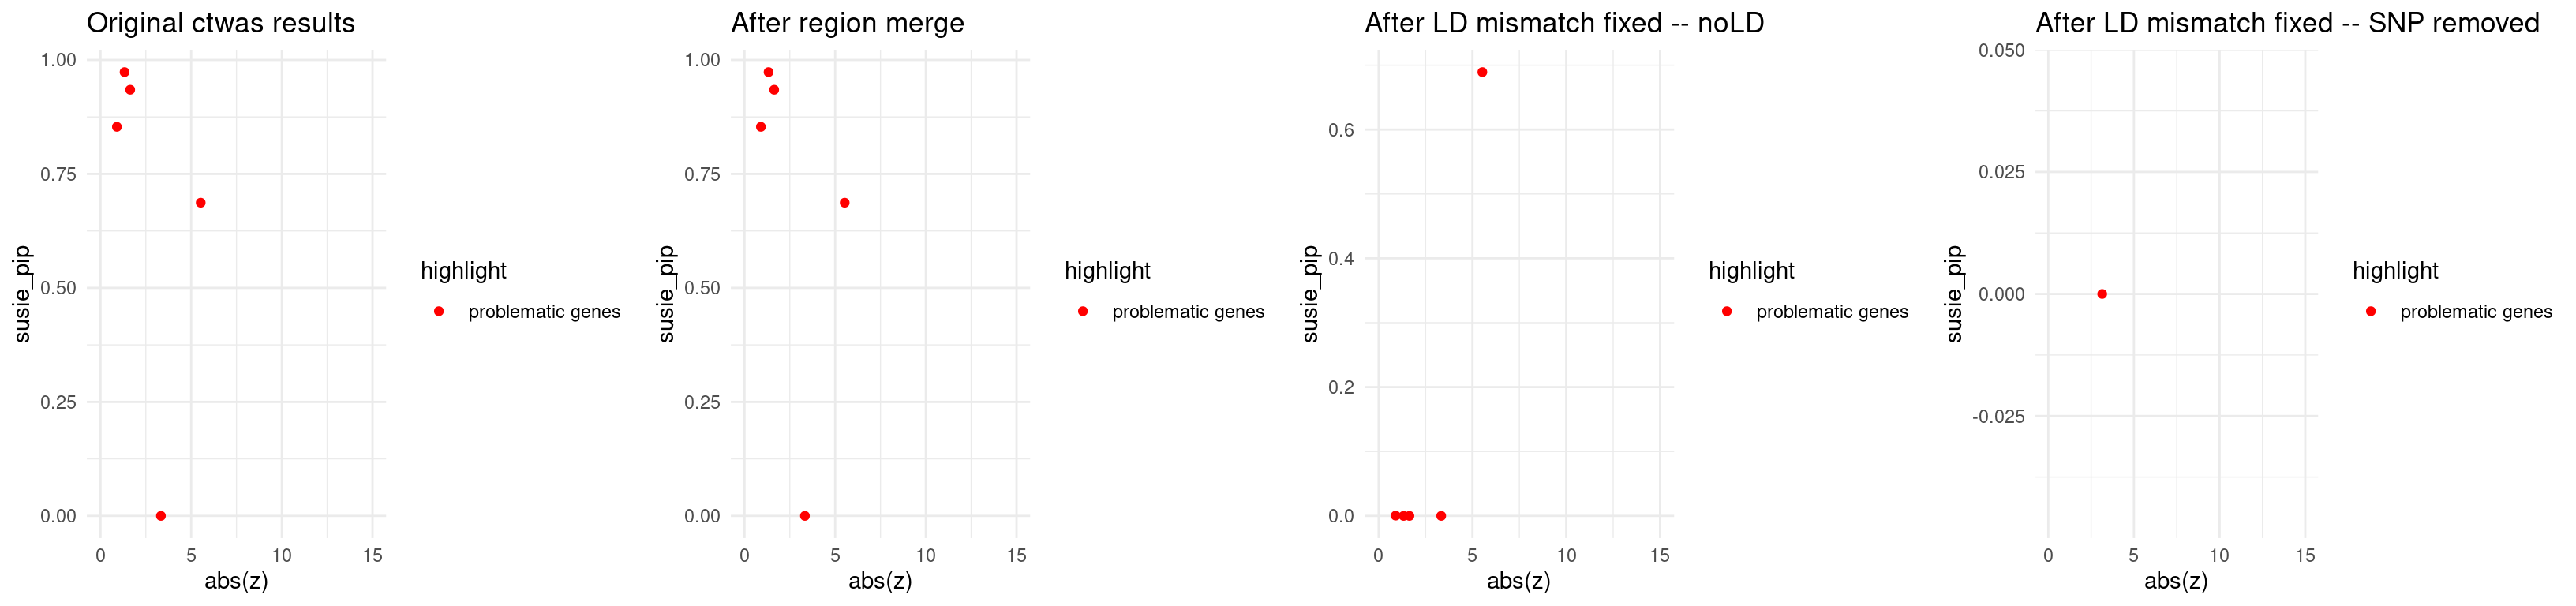
| Version | Author | Date |
|---|---|---|
| 65c1ad1 | XSun | 2024-12-19 |
Examples for LD-mismatch fixing
weights_origin <- readRDS(paste0("/project/xinhe/xsun/multi_group_ctwas/11.multi_group_1008/results/",trait,"/",trait,".preprocessed.weights.RDS"))

load(paste0("/project/xinhe/xsun/multi_group_ctwas/11.multi_group_1008/post_process_rm_ld/ldmismatch_pipthres05_removesnp_weights_updated_",trait,".rdata"))

region_id <- "3_110794923_113096852"

finemap_res_rm <- anno_finemap_res(finemap_res_rm,
                                          snp_map = updated_data_res_regionmerge[["updated_snp_map"]],
                                          mapping_table = mapping_two,
                                          add_gene_annot = TRUE,
                                          map_by = "molecular_id",
                                          drop_unmapped = TRUE,
                                          add_position = TRUE,
                                          use_gene_pos = "mid")
2024-12-19 14:34:24 INFO::Annotating fine-mapping result ...
2024-12-19 14:34:24 INFO::Map molecular traits to genes
2024-12-19 14:34:25 INFO::Split PIPs for molecular traits mapped to multiple genes
2024-12-19 14:34:31 INFO::Add gene positions
2024-12-19 14:34:31 INFO::Add SNP positionsfinemap_res_ldmm_nold <- anno_finemap_res(finemap_res_ldmm_nold,
snp_map = updated_data_res_regionmerge[["updated_snp_map"]],
mapping_table = mapping_two,
add_gene_annot = TRUE,
map_by = "molecular_id",
drop_unmapped = TRUE,
add_position = TRUE,
use_gene_pos = "mid")2024-12-19 14:34:40 INFO::Annotating fine-mapping result ...
2024-12-19 14:34:43 INFO::Map molecular traits to genes
2024-12-19 14:34:43 INFO::Split PIPs for molecular traits mapped to multiple genes
2024-12-19 14:34:46 INFO::Add gene positions
2024-12-19 14:34:46 INFO::Add SNP positionsfinemap_res_ldmm_removesnp <- anno_finemap_res(finemap_res_ldmm_removesnp,
snp_map = updated_data_res_regionmerge[["updated_snp_map"]],
mapping_table = mapping_two,
add_gene_annot = TRUE,
map_by = "molecular_id",
drop_unmapped = TRUE,
add_position = TRUE,
use_gene_pos = "mid")2024-12-19 14:34:51 INFO::Annotating fine-mapping result ...
2024-12-19 14:34:51 INFO::Map molecular traits to genes
2024-12-19 14:34:54 INFO::Split PIPs for molecular traits mapped to multiple genes
2024-12-19 14:34:56 INFO::Add gene positions
2024-12-19 14:34:56 INFO::Add SNP positionsfinemap_res_rm_gene <- finemap_res_rm[finemap_res_rm$type != "SNP",]
finemap_res_ldmm_removesnp_gene <- finemap_res_ldmm_removesnp[finemap_res_ldmm_removesnp$type !="SNP",]
print("locus plot -- after region merge")[1] "locus plot -- after region merge"make_locusplot(finemap_res_rm,
region_id = region_id,
ens_db = ens_db,
weights = weights_origin,
highlight_pip = 0.8,
filter_protein_coding_genes = TRUE,
filter_cs = TRUE,
color_pval_by = "cs",
color_pip_by = "cs",panel.heights = c(4,4,1,1))2024-12-19 14:35:05 INFO::Limit to protein coding genes
2024-12-19 14:35:05 INFO::focal id: intron_3_111859878_111884064|Heart_Atrial_Appendage_sQTL
2024-12-19 14:35:05 INFO::focal molecular trait: PHLDB2 Heart_Atrial_Appendage sQTL
2024-12-19 14:35:05 INFO::Range of locus: chr3:110795153-113096727
2024-12-19 14:35:06 INFO::focal molecular trait QTL positions: 111859891
2024-12-19 14:35:06 INFO::Limit PIPs to credible sets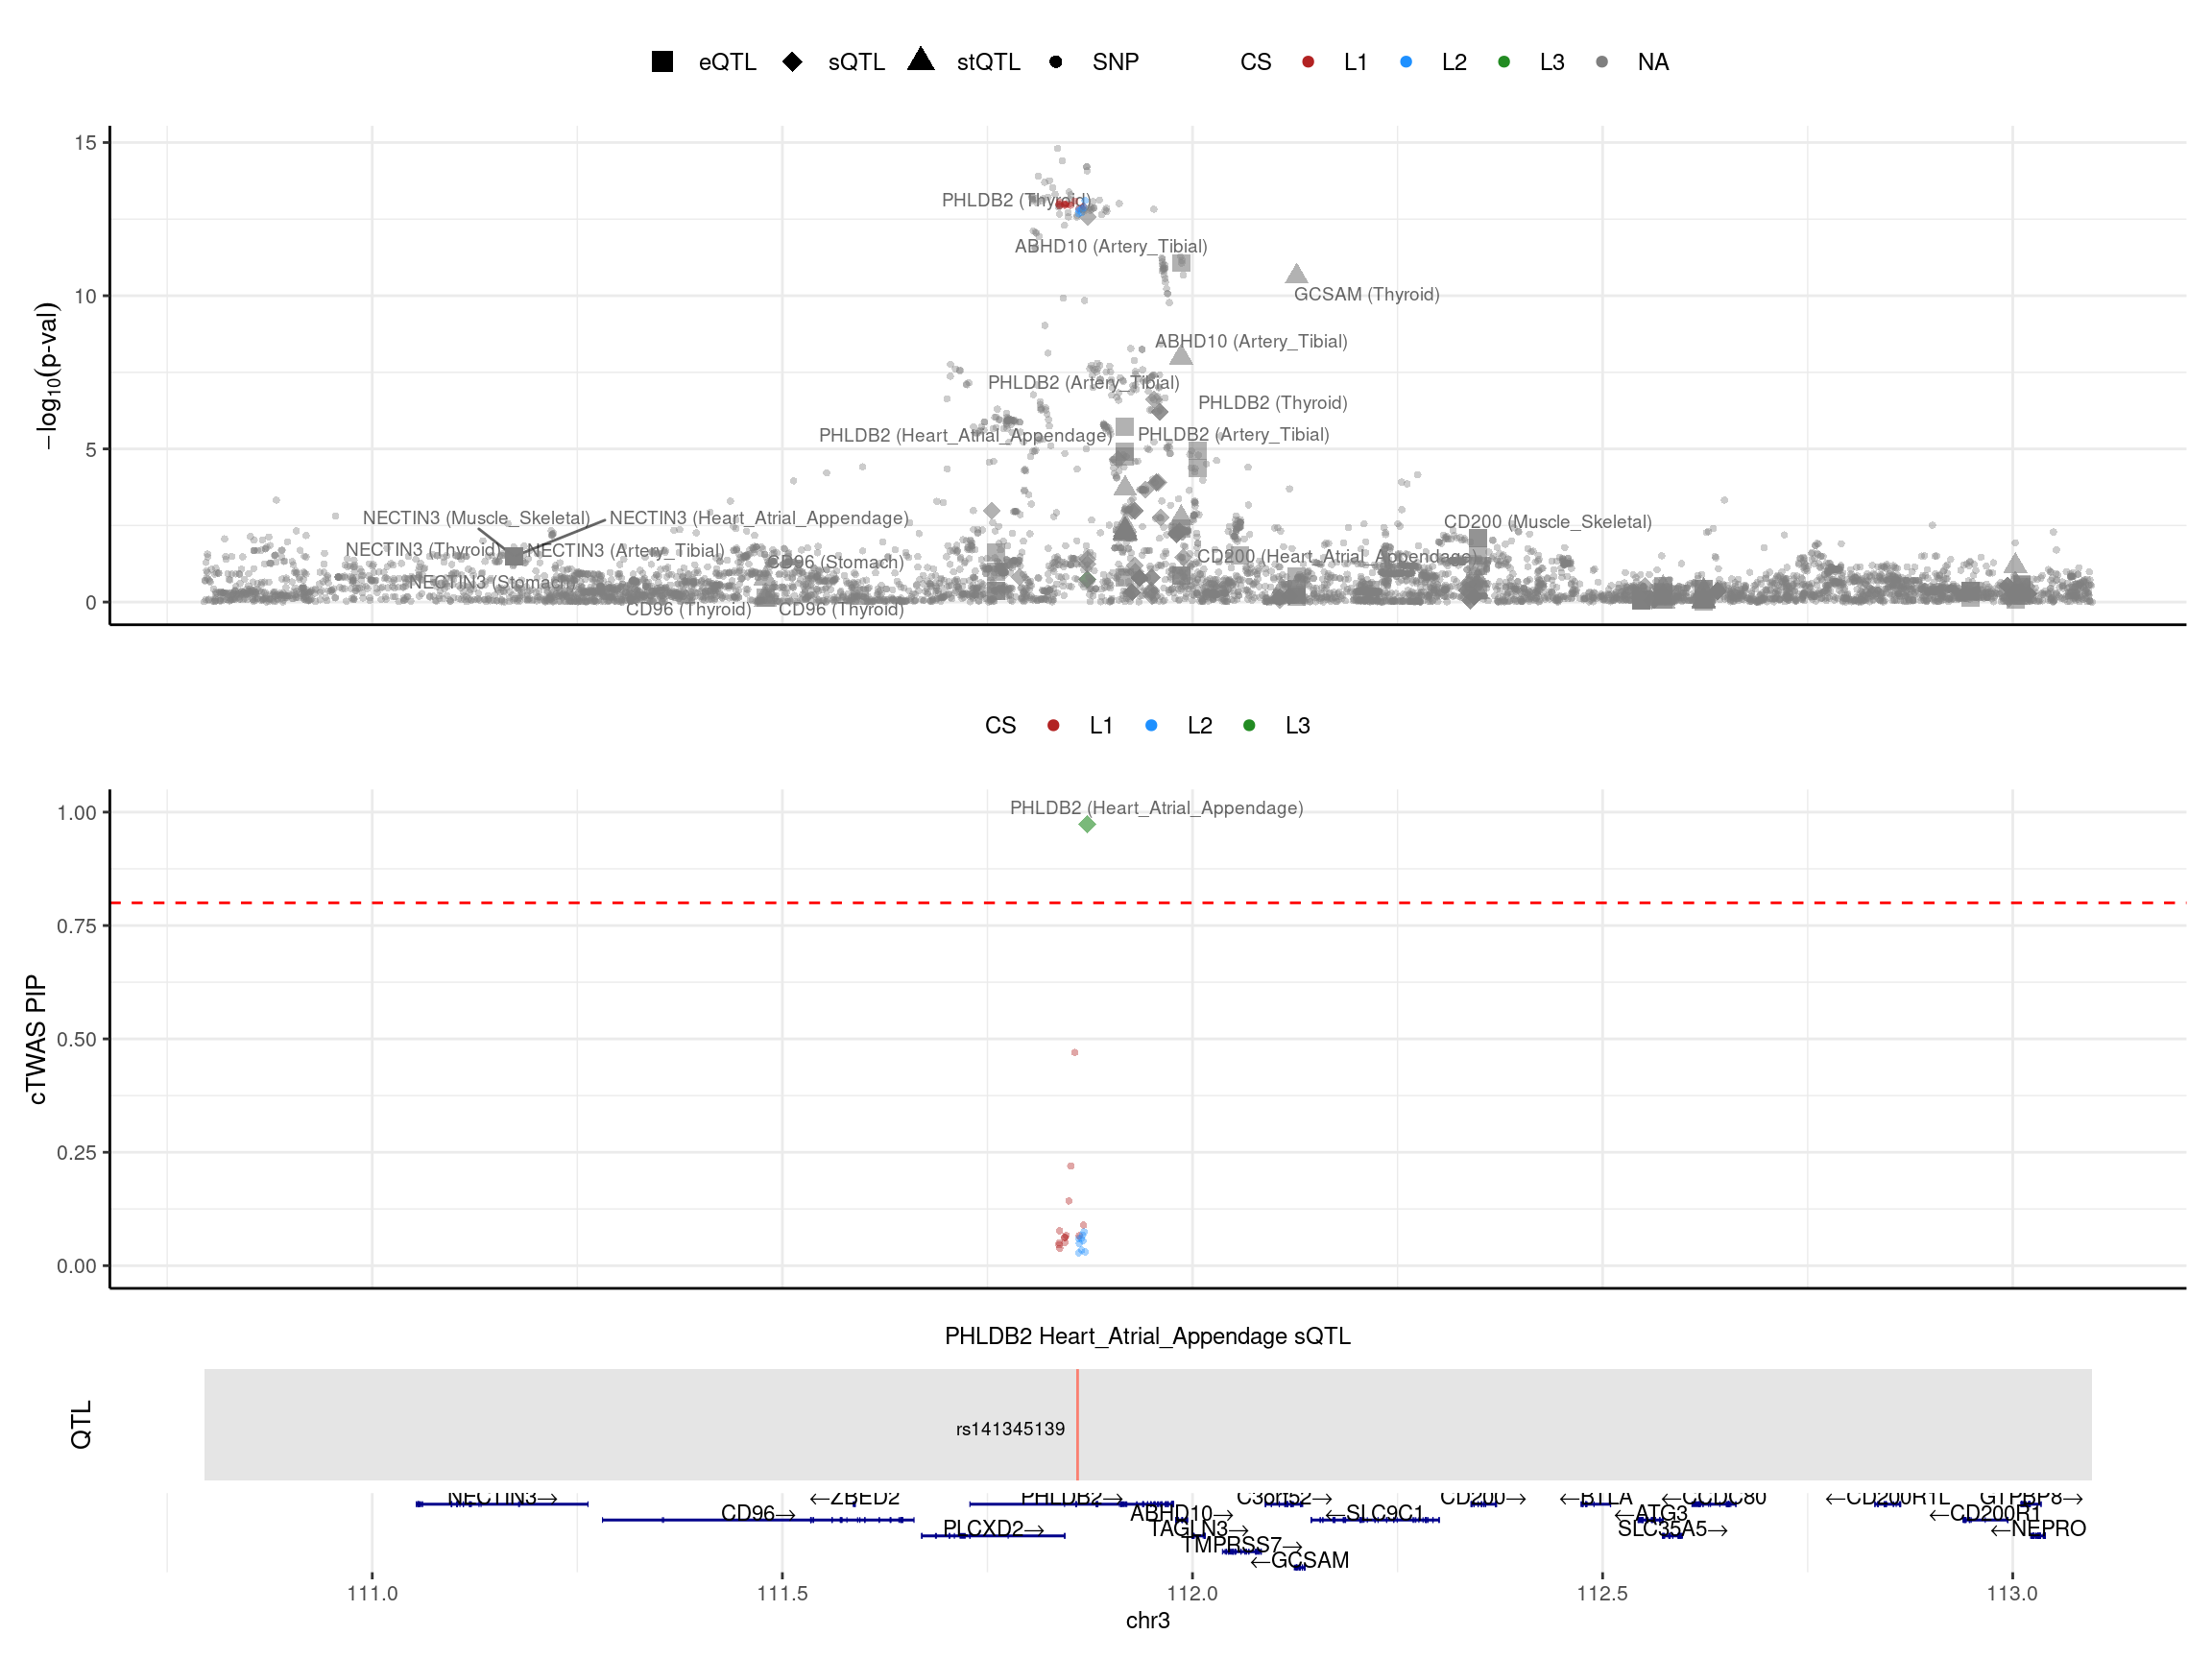
| Version | Author | Date |
|---|---|---|
| 65c1ad1 | XSun | 2024-12-19 |
print("locus plot -- LD mismatch: no LD")[1] "locus plot -- LD mismatch: no LD"make_locusplot(finemap_res_ldmm_nold,
region_id = region_id,
ens_db = ens_db,
weights = weights_origin,
highlight_pip = 0.8,
filter_protein_coding_genes = TRUE,
filter_cs = TRUE,
color_pval_by = "cs",
color_pip_by = "cs",panel.heights = c(4,4,1,1))2024-12-19 14:35:11 INFO::Limit to protein coding genes
2024-12-19 14:35:11 INFO::focal id: ENSG00000144827.8|Artery_Tibial_eQTL
2024-12-19 14:35:11 INFO::focal molecular trait: ABHD10 Artery_Tibial eQTL
2024-12-19 14:35:11 INFO::Range of locus: chr3:110796774-113093472
2024-12-19 14:35:11 INFO::focal molecular trait QTL positions:
2024-12-19 14:35:11 INFO::Limit PIPs to credible sets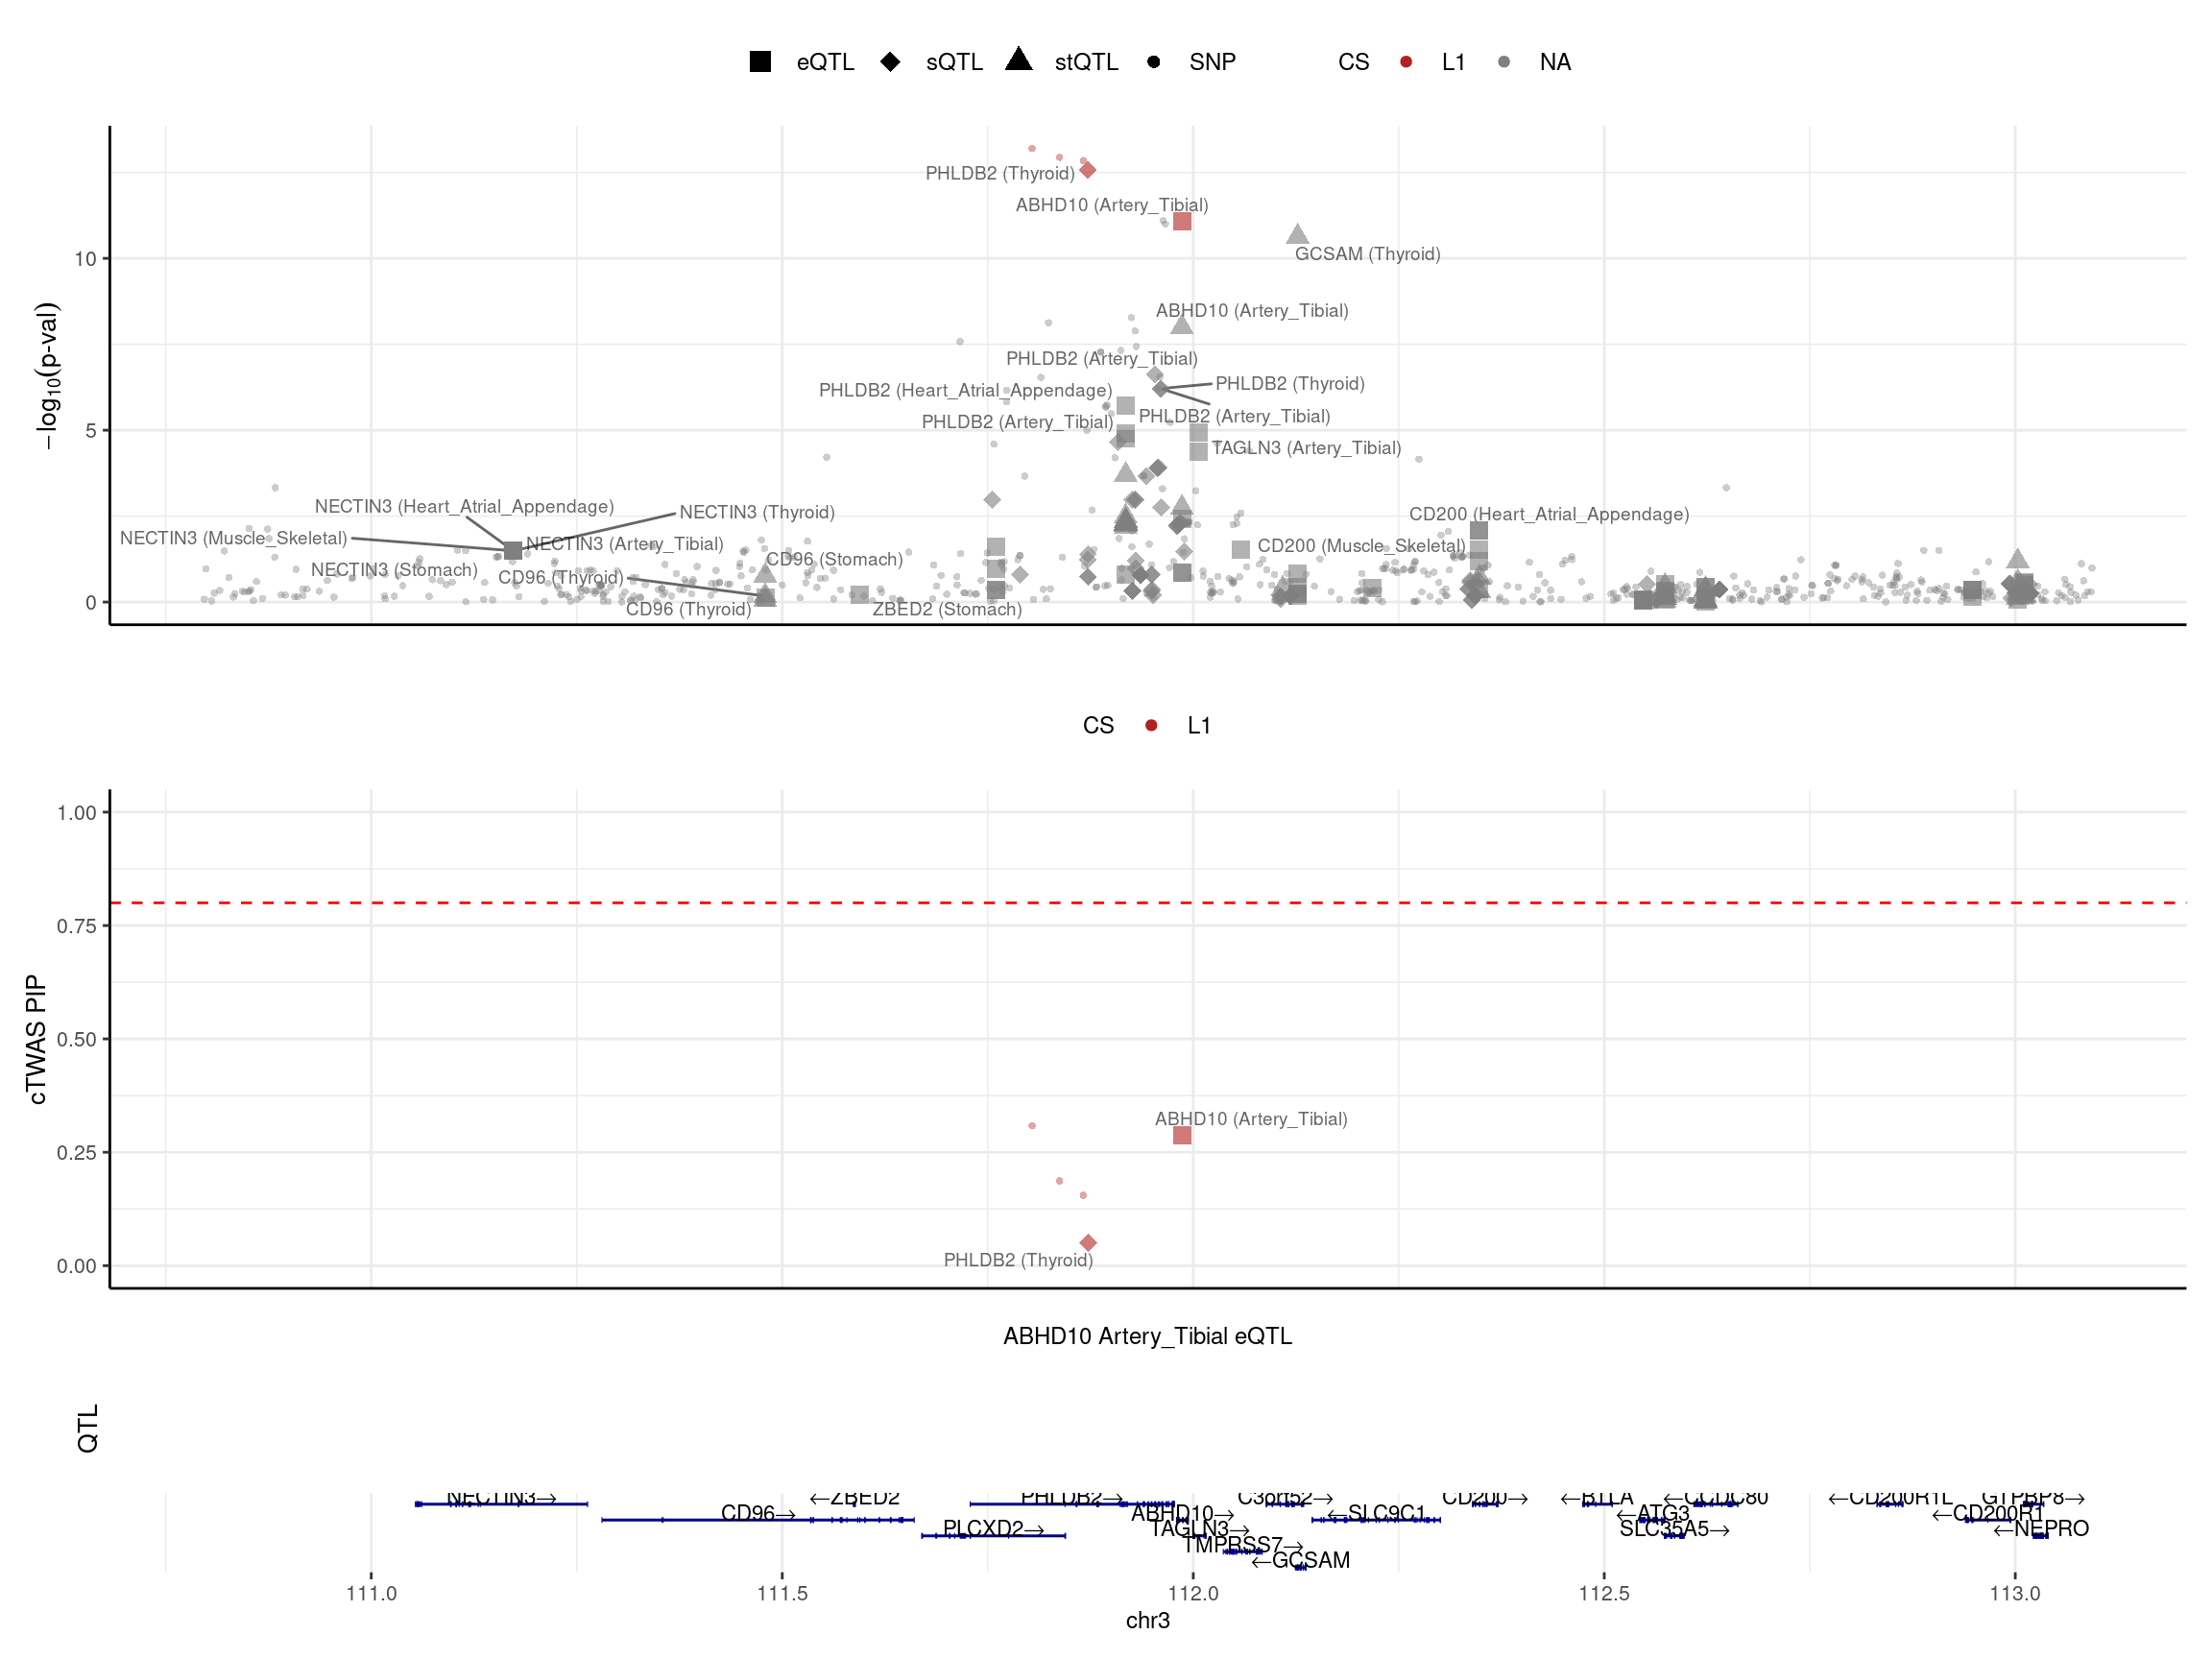
| Version | Author | Date |
|---|---|---|
| 65c1ad1 | XSun | 2024-12-19 |
print("locus plot -- LD mismatch: snp removed")[1] "locus plot -- LD mismatch: snp removed"make_locusplot(finemap_res_ldmm_removesnp,
region_id = region_id,
ens_db = ens_db,
weights = weights_updated,
highlight_pip = 0.8,
filter_protein_coding_genes = TRUE,
filter_cs = TRUE,
color_pval_by = "cs",
color_pip_by = "cs",panel.heights = c(4,4,1,1))2024-12-19 14:35:13 INFO::Limit to protein coding genes
2024-12-19 14:35:13 INFO::focal id: intron_3_111859878_111884064|Thyroid_sQTL
2024-12-19 14:35:13 INFO::focal molecular trait: PHLDB2 Thyroid sQTL
2024-12-19 14:35:13 INFO::Range of locus: chr3:110796774-113093472
2024-12-19 14:35:13 INFO::focal molecular trait QTL positions:
2024-12-19 14:35:13 INFO::Limit PIPs to credible sets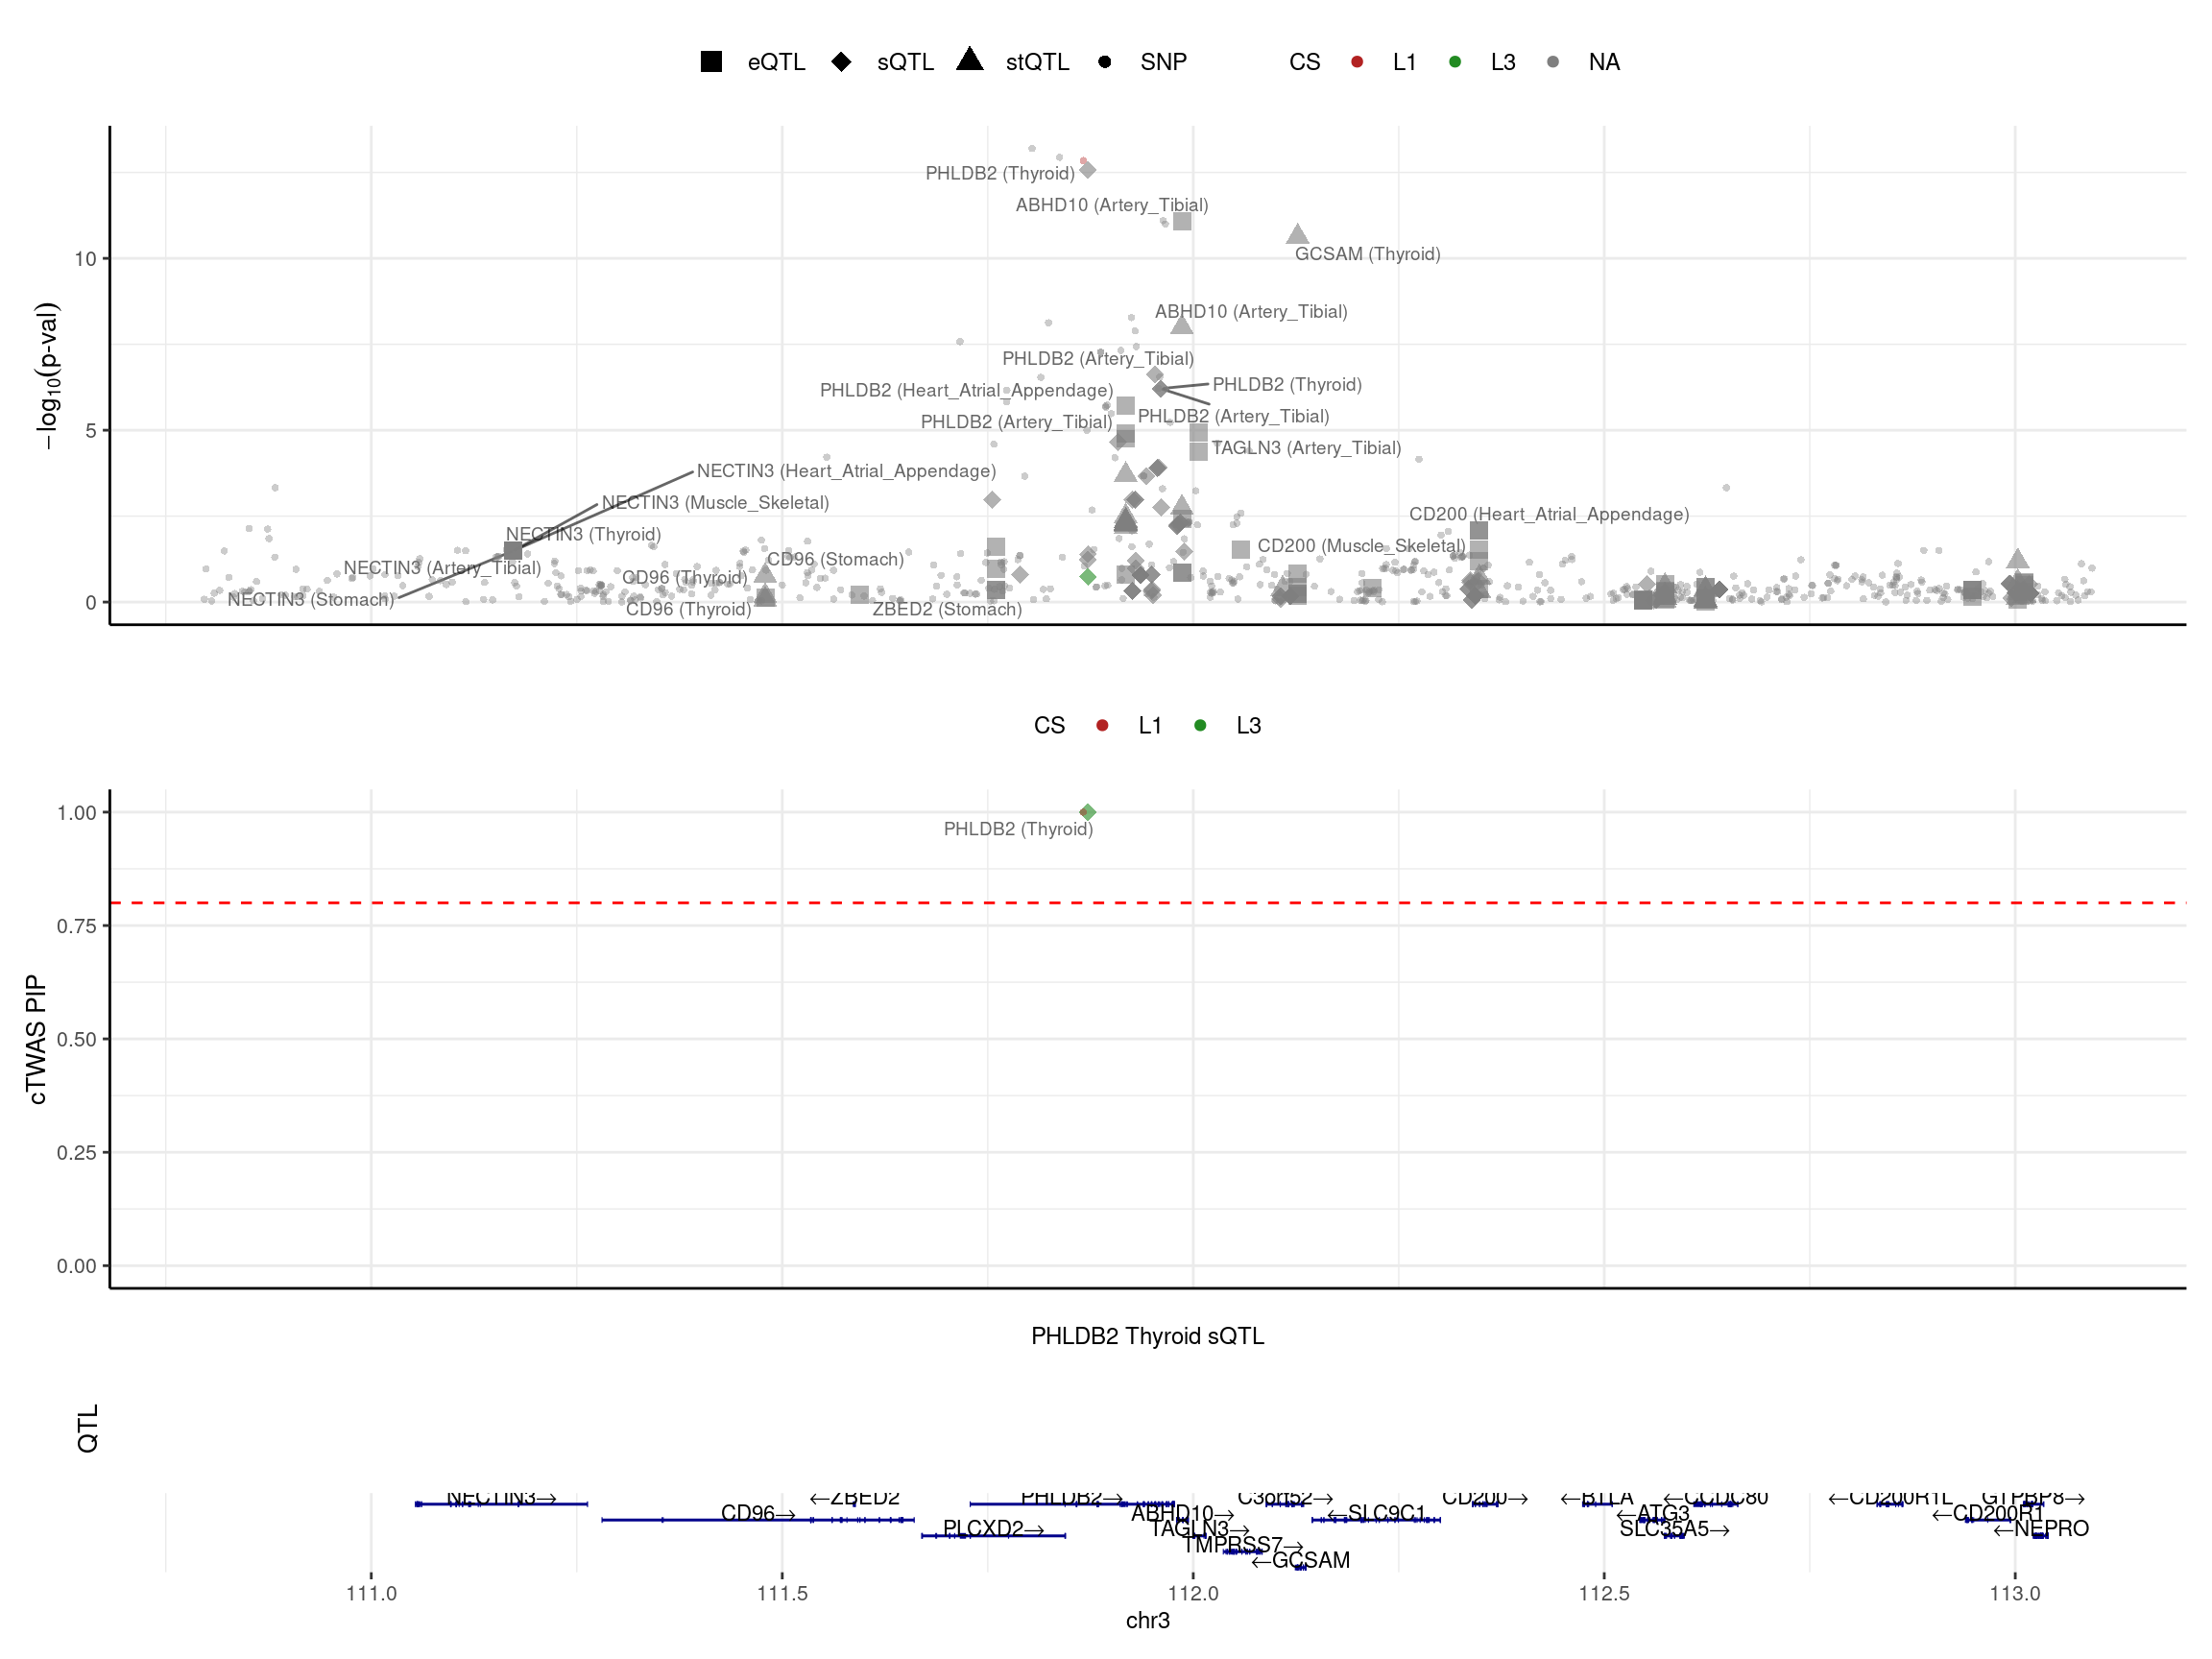
| Version | Author | Date |
|---|---|---|
| 65c1ad1 | XSun | 2024-12-19 |
finemap_res_rm_gene_region <- finemap_res_rm_gene[finemap_res_rm_gene$region_id == region_id,]
finemap_res_ldmm_removesnp_gene_region <- finemap_res_ldmm_removesnp_gene[finemap_res_ldmm_removesnp_gene$region_id == region_id,]
merged_region_gene <- merge(finemap_res_rm_gene_region,finemap_res_ldmm_removesnp_gene_region,by = "id",all.x=T)
merged_region_gene <- merged_region_gene[,c("id","gene_name.x","z.x","susie_pip.x","cs.x","z.y","susie_pip.y","cs.y")]
colnames(merged_region_gene) <- c("id","gene_name","z_regionmerge","susie_pip_regionmerge","cs_regionmerge","z_ldmismatch","susie_pip_ldmismatch","cs_ldmismatch")

merged_region_gene$highlight <- ifelse(merged_region_gene$id %in% problematic_genes, "problematic genes", "good genes")

merged_region_gene$z_ldmismatch[is.na(merged_region_gene$z_ldmismatch)] <- 10
print("The dots showing z_ldmismatch =10 means: these genes were removed since the only QTLs of them are problematic")
[1] "The dots showing z_ldmismatch =10 means: these genes were removed since the only QTLs of them are problematic"ggplot(data = merged_region_gene, aes(x= z_regionmerge, y= z_ldmismatch, color = highlight, alpha = highlight)) +
geom_point() +
scale_color_manual(values = c("problematic genes" = "red", "good genes" = "black")) +
scale_alpha_manual(values = c("problematic genes" = 1, "good genes" = 0.3)) +
ggtitle("Comparing z-scores before/after removing the problematic SNPs") +
theme_minimal()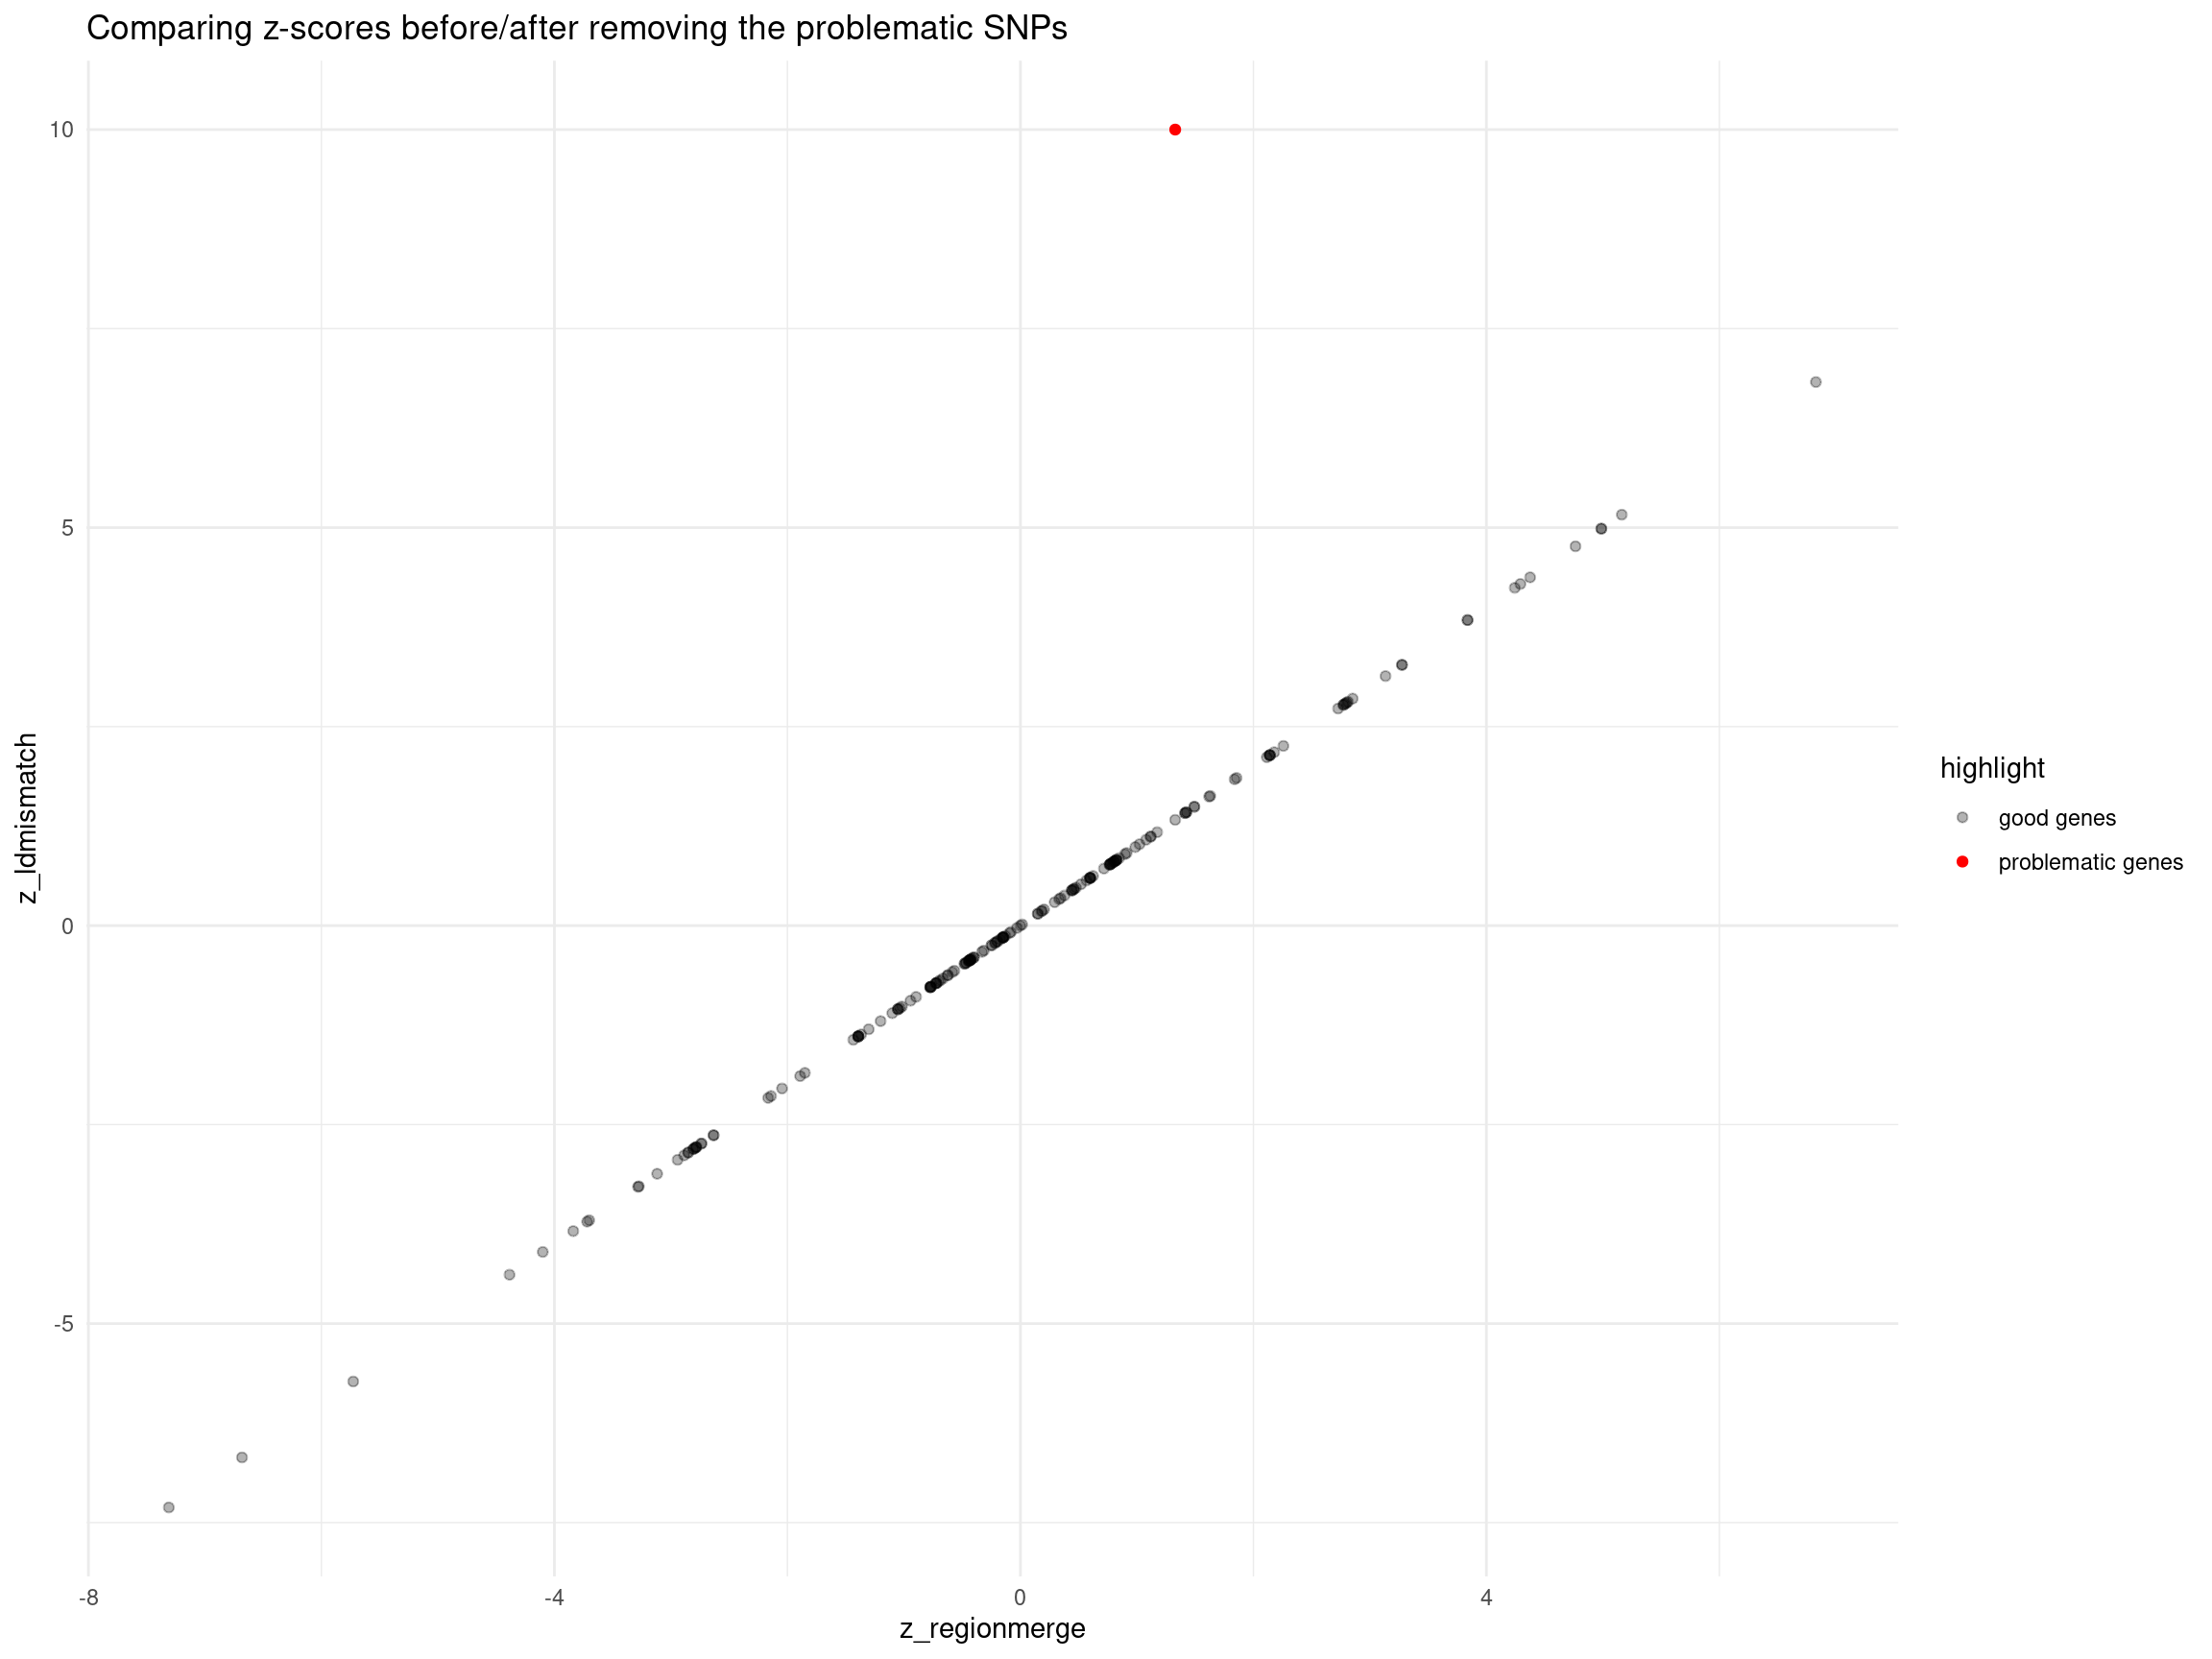
| Version | Author | Date |
|---|---|---|
| 65c1ad1 | XSun | 2024-12-19 |
DT::datatable(merged_region_gene[merged_region_gene$z_ldmismatch != merged_region_gene$z_regionmerge,],caption = htmltools::tags$caption( style = 'caption-side: left; text-align: left; color:black; font-size:150% ;','Genes with different z before / after removing the problematic SNPs'),options = list(pageLength = 10) )LDL-ukb-d-30780_irnt
trait <- "LDL-ukb-d-30780_irnt"

results_dir_origin <- paste0("/project/xinhe/xsun/multi_group_ctwas/11.multi_group_1008/results/",trait,"/")
ctwas_res_origin <- readRDS(paste0(results_dir_origin,trait,".ctwas.res.RDS"))

finemap_res_origin <- ctwas_res_origin$finemap_res
Region merge
load(paste0("/project/xinhe/xsun/multi_group_ctwas/11.multi_group_1008/post_process_rm_ld/rm_",trait,".rdata"))

finemap_res_rm <- res_regionmerge$finemap_res
finemap_res_rm_boundary_genes <- finemap_res_rm[finemap_res_rm$id %in%selected_boundary_genes$id,]
finemap_res_rm_boundary_genes_pip <- finemap_res_rm_boundary_genes[,c("id","susie_pip","cs")]


finemap_res_origin_boundary_genes <- finemap_res_origin[finemap_res_origin$id %in%selected_boundary_genes$id,]
finemap_res_origin_boundary_genes_pip <- finemap_res_origin_boundary_genes[,c("id","susie_pip","cs")]

finemap_res_compare_regionmerge <- merge(finemap_res_origin_boundary_genes_pip,finemap_res_rm_boundary_genes_pip, by = "id")
colnames(finemap_res_compare_regionmerge) <- c("id","susie_pip_origin","cs_origin","susie_pip_reginmerge","cs_reginmerge")

DT::datatable(finemap_res_compare_regionmerge,caption = htmltools::tags$caption( style = 'caption-side: left; text-align: left; color:black;  font-size:150% ;','Selected boundary genes (susie_pip > 0.5)'),options = list(pageLength = 10) )
LD-mismatch
Diagnosis
file_pipthreshold02 <- paste0("/project/xinhe/xsun/multi_group_ctwas/11.multi_group_1008/post_process_rm_ld/ldmismatch_diagnosis_pipthres02_", trait, ".rdata")

load(file_pipthreshold02)
pip_02 <- data.frame(
  "PIP Threshold" = "0.2",
  "Number of Selected Regions" = length(selected_region_ids),
  "Number of Problematic Genes" = length(problematic_genes),
  "Number of Problematic Regions" = length(problematic_region_ids),
  "Number of Problematic SNPs" = length(res_ldmismatch$problematic_snps),
  "Number of Flipped SNPs" = length(res_ldmismatch$flipped_snps)
)


file_pipthreshold05 <- paste0("/project/xinhe/xsun/multi_group_ctwas/11.multi_group_1008/post_process_rm_ld/ldmismatch_diagnosis_pipthres05_", trait, ".rdata")

load(file_pipthreshold05)
pip_05 <- data.frame(
  "PIP Threshold" = "0.5",
  "Number of Selected Regions" = length(selected_region_ids),
  "Number of Problematic Genes" = length(problematic_genes),
  "Number of Problematic Regions" = length(problematic_region_ids),
  "Number of Problematic SNPs" = length(res_ldmismatch$problematic_snps),
  "Number of Flipped SNPs" = length(res_ldmismatch$flipped_snps)
)

results_table <- rbind(pip_02, pip_05)

DT::datatable(results_table,caption = htmltools::tags$caption( style = 'caption-side: left; text-align: left; color:black;  font-size:150% ;','LD mismatch diagnosis table for different gene cutoff'),options = list(pageLength = 10) )
Comparing 2 LD mismatch fixing methods
load(paste0("/project/xinhe/xsun/multi_group_ctwas/11.multi_group_1008/post_process_rm_ld/ldmismatch_pipthres05_nold_",trait,".rdata"))
finemap_res_ldmm_nold <- res_ldmm_nold$finemap_res
load(paste0("/project/xinhe/xsun/multi_group_ctwas/11.multi_group_1008/post_process_rm_ld/ldmismatch_pipthres02_removesnp_",trait,".rdata"))
finemap_res_ldmm_removesnp <- res_ldmm_removesnp$finemap_res

finemap_res_ldmm_nold_problematic_gene <- finemap_res_ldmm_nold[finemap_res_ldmm_nold$region_id %in% problematic_region_ids & finemap_res_ldmm_nold$type != "SNP",]
finemap_res_ldmm_removesnp_problematic_gene <- finemap_res_ldmm_removesnp[finemap_res_ldmm_removesnp$region_id %in% problematic_region_ids & finemap_res_ldmm_removesnp$type != "SNP",]

merge_2method <- merge(finemap_res_ldmm_nold_problematic_gene,finemap_res_ldmm_removesnp_problematic_gene, by ="id",all.x=T)
merge_2method$highlight <- ifelse(merge_2method$id %in% problematic_genes, "problematic genes", "good genes")
merge_2method$susie_pip.y[is.na(merge_2method$susie_pip.y)] <- 1.5
p1 <- ggplot(data = merge_2method, aes(x = susie_pip.x, y = susie_pip.y, color = highlight, alpha = highlight)) +
  geom_point() +
  scale_color_manual(values = c("problematic genes" = "red", "good genes" = "black")) +
  scale_alpha_manual(values = c("problematic genes" = 1, "good genes" = 0.1)) +
  labs(x = "PIP_noLD", y = "PIP_removesnp") +
  geom_abline(slope = 1, intercept = 0, col = "red") +
  ggtitle("Problematic regions only, genes only") +
  theme_minimal()

finemap_res_rm_problematic_gene <- finemap_res_rm[finemap_res_rm$region_id %in% problematic_region_ids & finemap_res_rm$type != "SNP",]

merge_rm_ldmm_nold <-  merge(finemap_res_rm_problematic_gene,finemap_res_ldmm_nold_problematic_gene, by ="id",all.x=T)
merge_rm_ldmm_nold$highlight <- ifelse(merge_rm_ldmm_nold$id %in% problematic_genes, "problematic genes", "good genes")
merge_rm_ldmm_nold$susie_pip.y[is.na(merge_rm_ldmm_nold$susie_pip.y)] <- 1.5
p2 <- ggplot(data = merge_rm_ldmm_nold, aes(x= susie_pip.x, y= susie_pip.y, color = highlight, alpha = highlight)) +
  geom_point() +
  labs(x="PIP_after_regionmerge", y="PIP_noLD") +
  scale_color_manual(values = c("problematic genes" = "red", "good genes" = "black")) +
  scale_alpha_manual(values = c("problematic genes" = 1, "good genes" = 0.1)) +
  geom_abline(slope = 1, intercept = 0, col ="red") +
  ggtitle("problematic regions only, genes only") +
  theme_minimal()

merge_rm_ldmm_removesnp <-  merge(finemap_res_rm_problematic_gene,finemap_res_ldmm_removesnp_problematic_gene, by ="id",all.x =T)
merge_rm_ldmm_removesnp$highlight <- ifelse(merge_rm_ldmm_removesnp$id %in% problematic_genes, "problematic genes", "good genes")
merge_rm_ldmm_removesnp$susie_pip.y[is.na(merge_rm_ldmm_removesnp$susie_pip.y)] <- 1.5
p3 <- ggplot(data = merge_rm_ldmm_removesnp, aes(x= susie_pip.x, y= susie_pip.y, color = highlight, alpha = highlight)) +
  geom_point() +
  labs(x="PIP_after_regionmerge", y="PIP_removesnp") +
  scale_alpha_manual(values = c("problematic genes" = 1, "good genes" = 0.1)) +
  scale_color_manual(values = c("problematic genes" = "red", "good genes" = "black")) +
  geom_abline(slope = 1, intercept = 0, col ="red") +
  ggtitle("problematic regions only, genes only") +
  theme_minimal()
print(sprintf("Total number of molecular traits in problematic regions = %s",nrow(merge_rm_ldmm_removesnp)))
[1] "Total number of molecular traits in problematic regions = 2360"print(sprintf("Number of molecular traits disappeared after removing prblematic SNPs = %s", sum(merge_rm_ldmm_removesnp$susie_pip.y == 1.5)))[1] "Number of molecular traits disappeared after removing prblematic SNPs = 4"finemap_res_rm_problematic_gene$highlight <- ifelse(finemap_res_rm_problematic_gene$id %in% problematic_genes, "problematic genes", "good genes")
print(sprintf("The number of problematic genes with PIP < 0.01 = %s",sum(finemap_res_rm_problematic_gene$highlight == "problematic genes" & finemap_res_rm_problematic_gene$susie_pip < 0.01)))[1] "The number of problematic genes with PIP < 0.01 = 6"print("The dots showing PIP =1.5 means: these genes were removed since the only QTLs of them are problematic")[1] "The dots showing PIP =1.5 means: these genes were removed since the only QTLs of them are problematic"grid.arrange(p1,p2,p3, ncol = 3)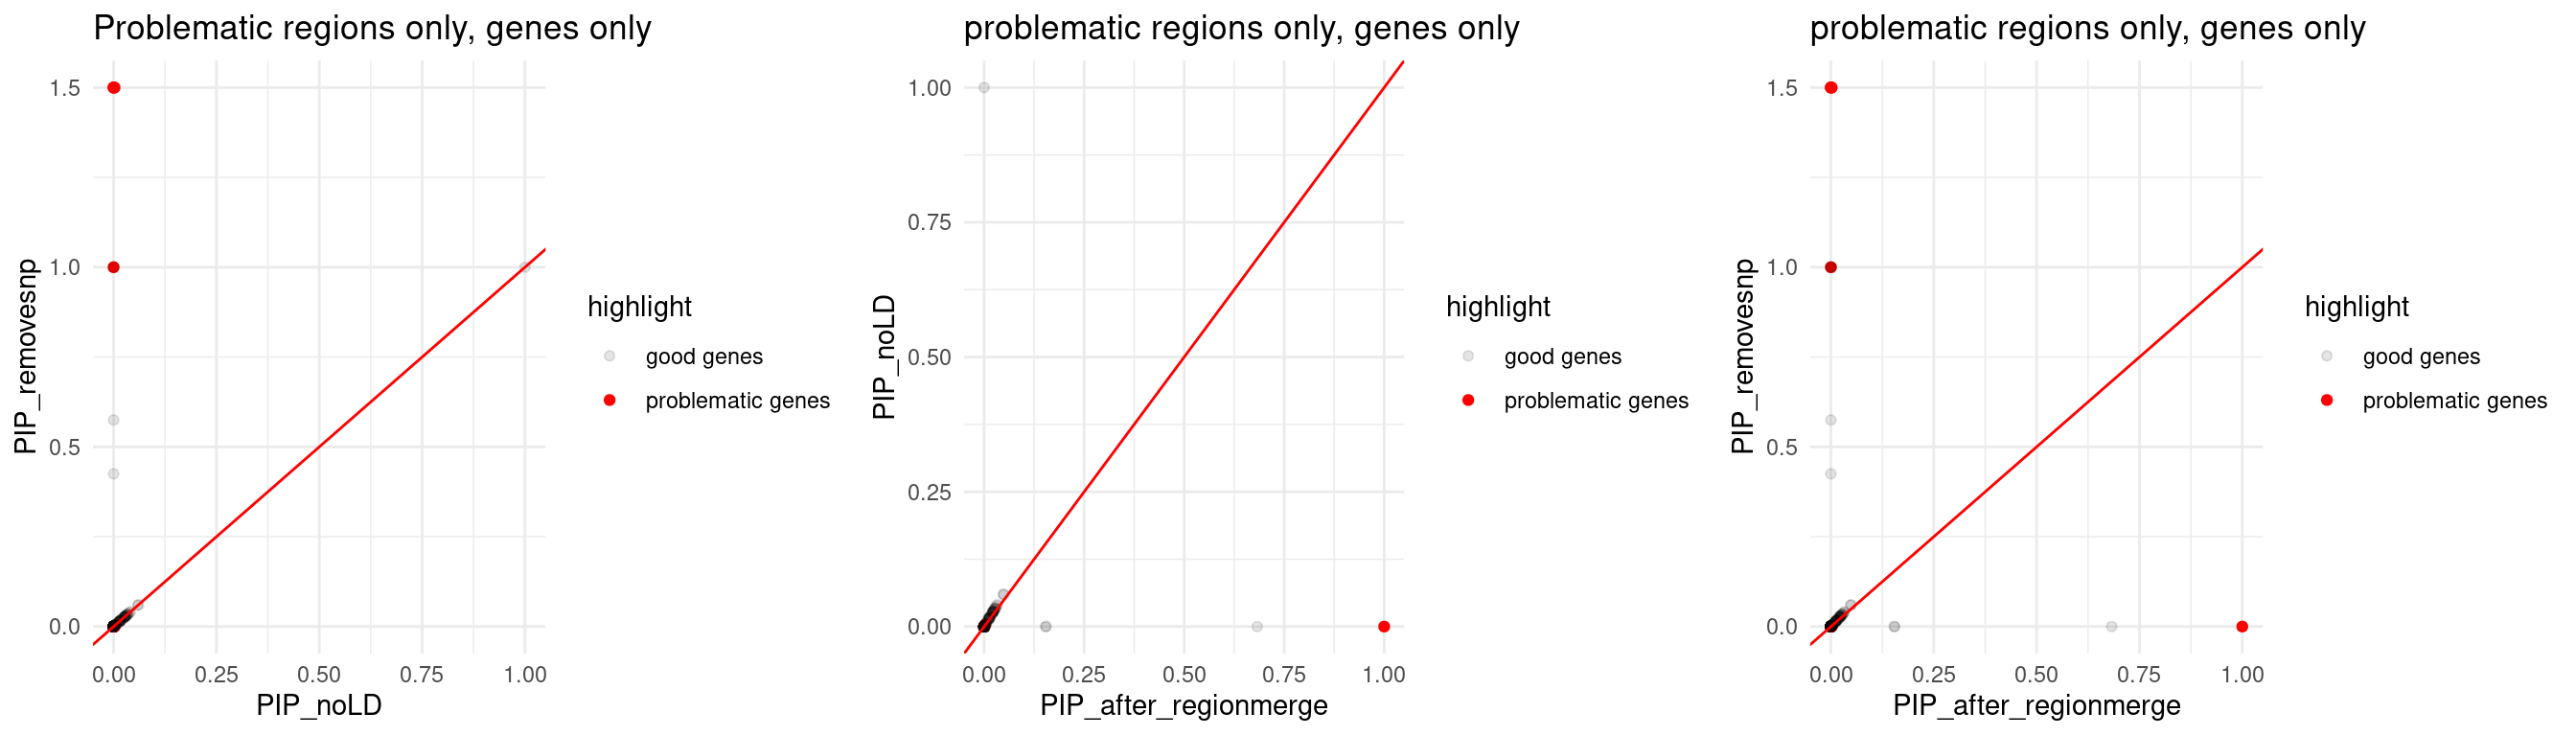
| Version | Author | Date |
|---|---|---|
| 65c1ad1 | XSun | 2024-12-19 |
Comparing z-scores and susie_pip
finemap_res_origin <- ctwas_res_origin$finemap_res
finemap_res_origin_gene <- finemap_res_origin[finemap_res_origin$type != "SNP",]
finemap_res_origin_gene$highlight <- ifelse(finemap_res_origin_gene$id %in% problematic_genes, "problematic genes", "good genes")

p1 <- ggplot(data = finemap_res_origin_gene, aes(x= abs(z), y= susie_pip, color = highlight)) +
  geom_point() +
  scale_color_manual(values = c("problematic genes" = "red", "good genes" = "black")) +
  ggtitle("Original ctwas results") +
  theme_minimal()


finemap_res_rm_gene <- finemap_res_rm[finemap_res_rm$type != "SNP",]
finemap_res_rm_gene$highlight <- ifelse(finemap_res_rm_gene$id %in% problematic_genes, "problematic genes", "good genes")

p2 <- ggplot(data = finemap_res_rm_gene, aes(x= abs(z), y= susie_pip, color = highlight)) +
  geom_point() +
  scale_color_manual(values = c("problematic genes" = "red", "good genes" = "black")) +
  ggtitle("After region merge") +
  theme_minimal()


finemap_res_ldmm_nold_gene <- finemap_res_ldmm_nold[finemap_res_ldmm_nold$type !="SNP",]
finemap_res_ldmm_nold_gene$highlight <- ifelse(finemap_res_ldmm_nold_gene$id %in% problematic_genes, "problematic genes", "good genes")

p3 <- ggplot(data = finemap_res_ldmm_nold_gene, aes(x= abs(z), y= susie_pip, color = highlight)) +
  geom_point() +
  scale_color_manual(values = c("problematic genes" = "red", "good genes" = "black")) +
  ggtitle("After LD mismatch fixed -- noLD") +
  theme_minimal()

finemap_res_ldmm_removesnp_gene <- finemap_res_ldmm_removesnp[finemap_res_ldmm_removesnp$type !="SNP",]
finemap_res_ldmm_removesnp_gene$highlight <- ifelse(finemap_res_ldmm_removesnp_gene$id %in% problematic_genes, "problematic genes", "good genes")

p4 <- ggplot(data = finemap_res_ldmm_removesnp_gene, aes(x= abs(z), y= susie_pip, color = highlight)) +
  geom_point() +
  scale_color_manual(values = c("problematic genes" = "red", "good genes" = "black")) +
  ggtitle("After LD mismatch fixed -- SNP removed") +
  theme_minimal()


grid.arrange(p1,p2,p3,p4, ncol = 4)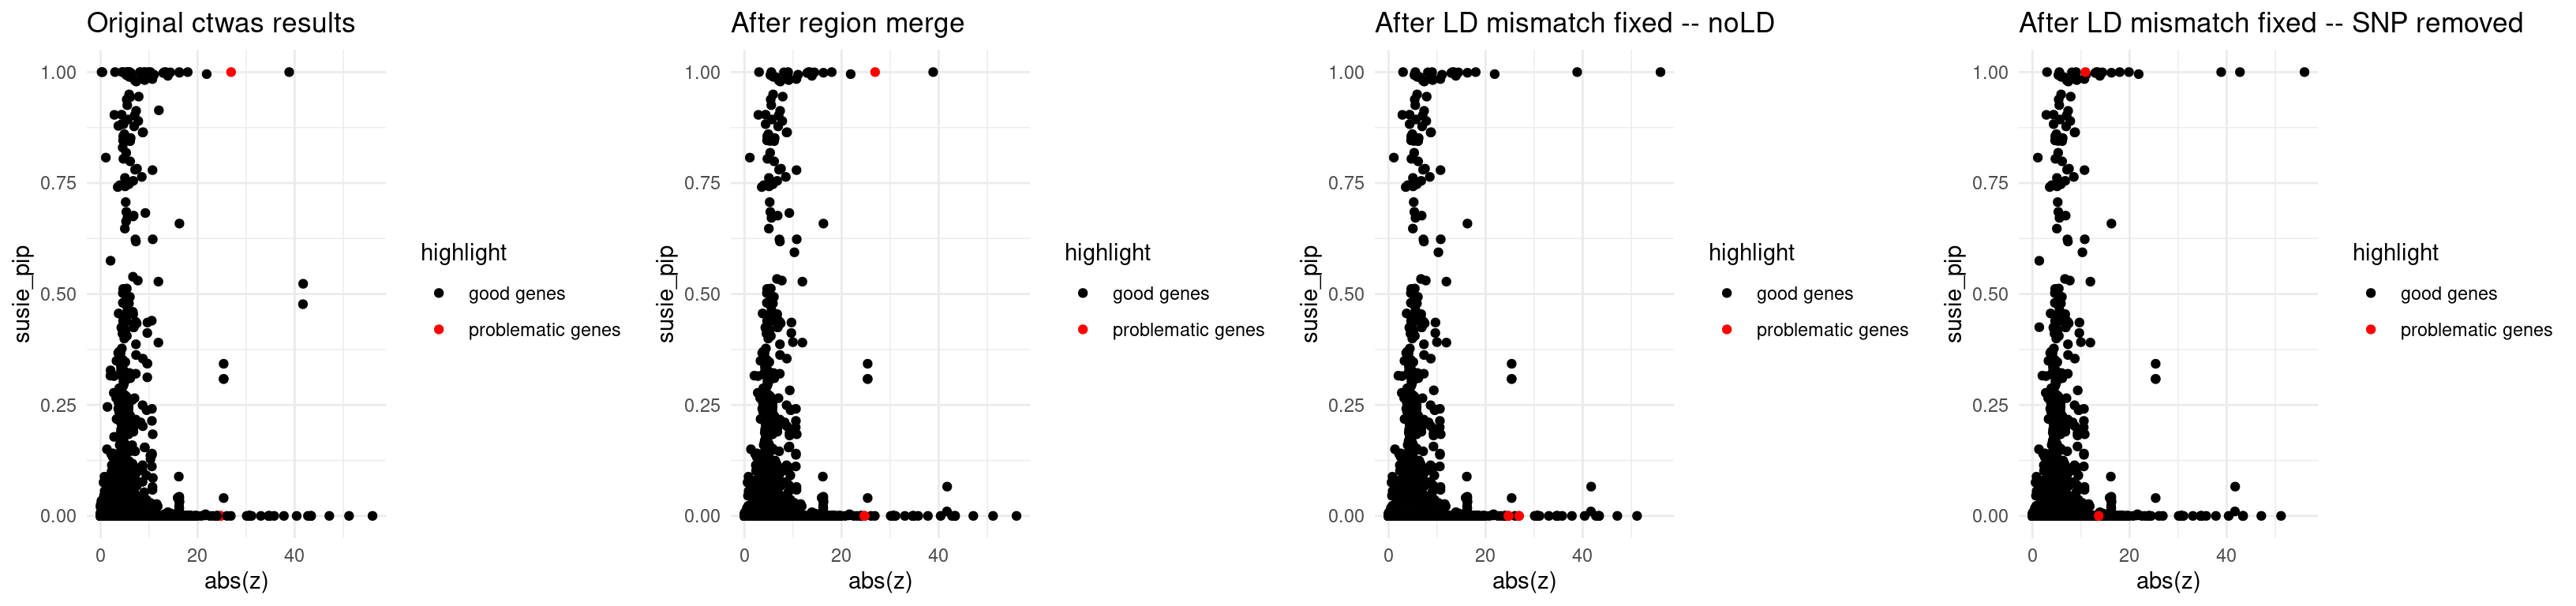
| Version | Author | Date |
|---|---|---|
| 65c1ad1 | XSun | 2024-12-19 |
print("L - estimated in region merge step")[1] "L - estimated in region merge step"print(updated_data_res_regionmerge$updated_region_L[problematic_region_ids]) 5_11940_982137 19_44239955_45599439 19_9127717_13360313
1 5 5 load(paste0("/project/xinhe/xsun/multi_group_ctwas/11.multi_group_1008/post_process_rm_ld/ldmismatch_pipthres05_removesnp_rescreenregion_",trait,".rdata"))
print("L - re-estimated after updating z_scores, region data")[1] "L - re-estimated after updating z_scores, region data"print(screen_res$screened_region_L) 5_11940_982137 19_44239955_45599439 19_9127717_13360313
1 5 5 print("Zoom in the z<15 part")[1] "Zoom in the z<15 part"finemap_res_origin_gene_prob <- finemap_res_origin_gene[finemap_res_origin_gene$highlight == "problematic genes",]
p1 <- ggplot(data = finemap_res_origin_gene_prob,
aes(x = abs(z), y = susie_pip, color = highlight, alpha = highlight)) +
geom_point() +
scale_color_manual(values = c("problematic genes" = "red", "good genes" = "black")) +
scale_alpha_manual(values = c("problematic genes" = 1, "good genes" = 0.01)) +
ggtitle("Original ctwas results") +
theme_minimal() +
xlim(0, 15)
finemap_res_rm_gene_prob <- finemap_res_rm_gene[finemap_res_rm_gene$highlight == "problematic genes",]
p2 <- ggplot(data = finemap_res_rm_gene_prob,
aes(x = abs(z), y = susie_pip, color = highlight, alpha = highlight)) +
geom_point() +
scale_color_manual(values = c("problematic genes" = "red", "good genes" = "black")) +
scale_alpha_manual(values = c("problematic genes" = 1, "good genes" = 0.01)) +
ggtitle("After region merge") +
theme_minimal() +
xlim(0, 15)
finemap_res_ldmm_nold_gene_prob <- finemap_res_ldmm_nold_gene[finemap_res_ldmm_nold_gene$highlight == "problematic genes",]
p3 <- ggplot(data = finemap_res_ldmm_nold_gene_prob,
aes(x = abs(z), y = susie_pip, color = highlight, alpha = highlight)) +
geom_point() +
scale_color_manual(values = c("problematic genes" = "red", "good genes" = "black")) +
scale_alpha_manual(values = c("problematic genes" = 1, "good genes" = 0.01)) +
ggtitle("After LD mismatch fixed -- noLD") +
theme_minimal() +
xlim(0, 15)
finemap_res_ldmm_removesnp_gene_prob <- finemap_res_ldmm_removesnp_gene[finemap_res_ldmm_removesnp_gene$highlight == "problematic genes",]
p4 <- ggplot(data = finemap_res_ldmm_removesnp_gene_prob,
aes(x = abs(z), y = susie_pip, color = highlight, alpha = highlight)) +
geom_point() +
scale_color_manual(values = c("problematic genes" = "red", "good genes" = "black")) +
scale_alpha_manual(values = c("problematic genes" = 1, "good genes" = 0.01)) +
ggtitle("After LD mismatch fixed -- SNP removed") +
theme_minimal() +
xlim(0, 15)
grid.arrange(p1,p2,p3,p4, ncol = 4)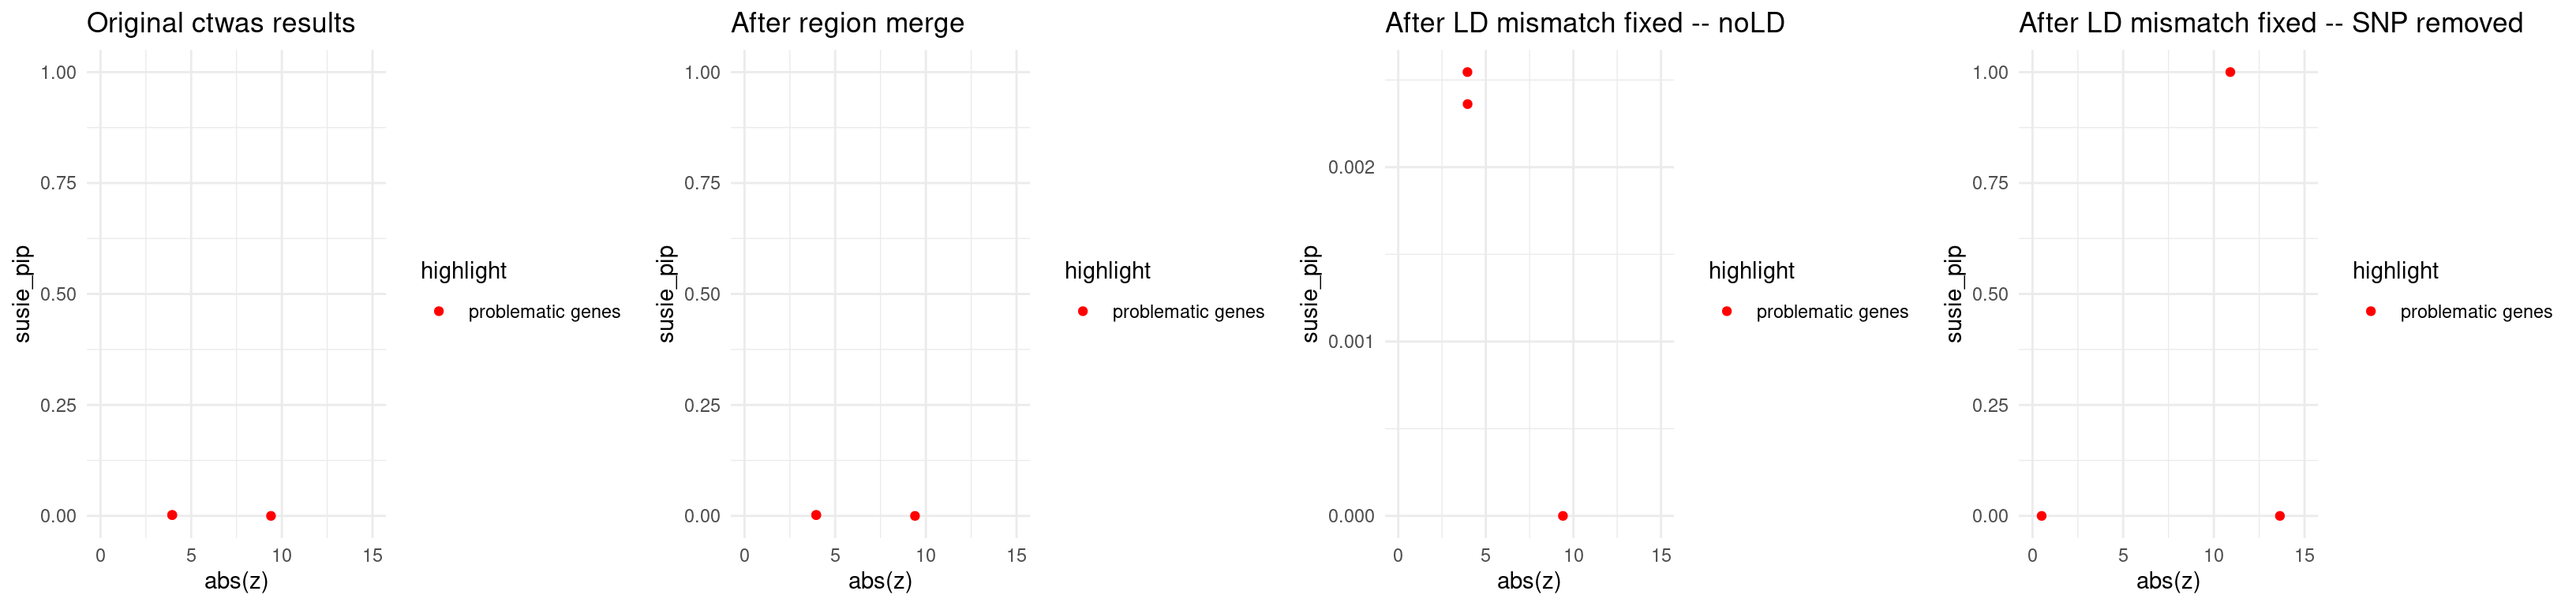
| Version | Author | Date |
|---|---|---|
| 65c1ad1 | XSun | 2024-12-19 |
IBD-ebi-a-GCST004131
trait <- "IBD-ebi-a-GCST004131"

results_dir_origin <- paste0("/project/xinhe/xsun/multi_group_ctwas/11.multi_group_1008/results/",trait,"/")
ctwas_res_origin <- readRDS(paste0(results_dir_origin,trait,".ctwas.res.RDS"))

finemap_res_origin <- ctwas_res_origin$finemap_res
Region merge
load(paste0("/project/xinhe/xsun/multi_group_ctwas/11.multi_group_1008/post_process_rm_ld/rm_",trait,".rdata"))

finemap_res_rm <- res_regionmerge$finemap_res
finemap_res_rm_boundary_genes <- finemap_res_rm[finemap_res_rm$id %in%selected_boundary_genes$id,]
finemap_res_rm_boundary_genes_pip <- finemap_res_rm_boundary_genes[,c("id","susie_pip","cs")]


finemap_res_origin_boundary_genes <- finemap_res_origin[finemap_res_origin$id %in%selected_boundary_genes$id,]
finemap_res_origin_boundary_genes_pip <- finemap_res_origin_boundary_genes[,c("id","susie_pip","cs")]

finemap_res_compare_regionmerge <- merge(finemap_res_origin_boundary_genes_pip,finemap_res_rm_boundary_genes_pip, by = "id")
colnames(finemap_res_compare_regionmerge) <- c("id","susie_pip_origin","cs_origin","susie_pip_reginmerge","cs_reginmerge")

DT::datatable(finemap_res_compare_regionmerge,caption = htmltools::tags$caption( style = 'caption-side: left; text-align: left; color:black;  font-size:150% ;','Selected boundary genes (susie_pip > 0.5)'),options = list(pageLength = 10) )
LD-mismatch
Diagnosis
file_pipthreshold02 <- paste0("/project/xinhe/xsun/multi_group_ctwas/11.multi_group_1008/post_process_rm_ld/ldmismatch_diagnosis_pipthres02_", trait, ".rdata")

load(file_pipthreshold02)
pip_02 <- data.frame(
  "PIP Threshold" = "0.2",
  "Number of Selected Regions" = length(selected_region_ids),
  "Number of Problematic Genes" = length(problematic_genes),
  "Number of Problematic Regions" = length(problematic_region_ids),
  "Number of Problematic SNPs" = length(res_ldmismatch$problematic_snps),
  "Number of Flipped SNPs" = length(res_ldmismatch$flipped_snps)
)


file_pipthreshold05 <- paste0("/project/xinhe/xsun/multi_group_ctwas/11.multi_group_1008/post_process_rm_ld/ldmismatch_diagnosis_pipthres05_", trait, ".rdata")

load(file_pipthreshold05)
pip_05 <- data.frame(
  "PIP Threshold" = "0.5",
  "Number of Selected Regions" = length(selected_region_ids),
  "Number of Problematic Genes" = length(problematic_genes),
  "Number of Problematic Regions" = length(problematic_region_ids),
  "Number of Problematic SNPs" = length(res_ldmismatch$problematic_snps),
  "Number of Flipped SNPs" = length(res_ldmismatch$flipped_snps)
)

results_table <- rbind(pip_02, pip_05)

DT::datatable(results_table,caption = htmltools::tags$caption( style = 'caption-side: left; text-align: left; color:black;  font-size:150% ;','LD mismatch diagnosis table for different gene cutoff'),options = list(pageLength = 10) )
Comparing 2 LD mismatch fixing methods
load(paste0("/project/xinhe/xsun/multi_group_ctwas/11.multi_group_1008/post_process_rm_ld/ldmismatch_pipthres05_nold_",trait,".rdata"))
finemap_res_ldmm_nold <- res_ldmm_nold$finemap_res
load(paste0("/project/xinhe/xsun/multi_group_ctwas/11.multi_group_1008/post_process_rm_ld/ldmismatch_pipthres02_removesnp_",trait,".rdata"))
finemap_res_ldmm_removesnp <- res_ldmm_removesnp$finemap_res

finemap_res_ldmm_nold_problematic_gene <- finemap_res_ldmm_nold[finemap_res_ldmm_nold$region_id %in% problematic_region_ids & finemap_res_ldmm_nold$type != "SNP",]
finemap_res_ldmm_removesnp_problematic_gene <- finemap_res_ldmm_removesnp[finemap_res_ldmm_removesnp$region_id %in% problematic_region_ids & finemap_res_ldmm_removesnp$type != "SNP",]

merge_2method <- merge(finemap_res_ldmm_nold_problematic_gene,finemap_res_ldmm_removesnp_problematic_gene, by ="id",all.x=T)
merge_2method$highlight <- ifelse(merge_2method$id %in% problematic_genes, "problematic genes", "good genes")
merge_2method$susie_pip.y[is.na(merge_2method$susie_pip.y)] <- 1.5
p1 <- ggplot(data = merge_2method, aes(x = susie_pip.x, y = susie_pip.y, color = highlight, alpha = highlight)) +
  geom_point() +
  scale_color_manual(values = c("problematic genes" = "red", "good genes" = "black")) +
  scale_alpha_manual(values = c("problematic genes" = 1, "good genes" = 0.1)) +
  labs(x = "PIP_noLD", y = "PIP_removesnp") +
  geom_abline(slope = 1, intercept = 0, col = "red") +
  ggtitle("Problematic regions only, genes only") +
  theme_minimal()

finemap_res_rm_problematic_gene <- finemap_res_rm[finemap_res_rm$region_id %in% problematic_region_ids & finemap_res_rm$type != "SNP",]

merge_rm_ldmm_nold <-  merge(finemap_res_rm_problematic_gene,finemap_res_ldmm_nold_problematic_gene, by ="id",all.x=T)
merge_rm_ldmm_nold$highlight <- ifelse(merge_rm_ldmm_nold$id %in% problematic_genes, "problematic genes", "good genes")
merge_rm_ldmm_nold$susie_pip.y[is.na(merge_rm_ldmm_nold$susie_pip.y)] <- 1.5
p2 <- ggplot(data = merge_rm_ldmm_nold, aes(x= susie_pip.x, y= susie_pip.y, color = highlight, alpha = highlight)) +
  geom_point() +
  labs(x="PIP_after_regionmerge", y="PIP_noLD") +
  scale_color_manual(values = c("problematic genes" = "red", "good genes" = "black")) +
  scale_alpha_manual(values = c("problematic genes" = 1, "good genes" = 0.1)) +
  geom_abline(slope = 1, intercept = 0, col ="red") +
  ggtitle("problematic regions only, genes only") +
  theme_minimal()

merge_rm_ldmm_removesnp <-  merge(finemap_res_rm_problematic_gene,finemap_res_ldmm_removesnp_problematic_gene, by ="id",all.x =T)
merge_rm_ldmm_removesnp$highlight <- ifelse(merge_rm_ldmm_removesnp$id %in% problematic_genes, "problematic genes", "good genes")
merge_rm_ldmm_removesnp$susie_pip.y[is.na(merge_rm_ldmm_removesnp$susie_pip.y)] <- 1.5
p3 <- ggplot(data = merge_rm_ldmm_removesnp, aes(x= susie_pip.x, y= susie_pip.y, color = highlight, alpha = highlight)) +
  geom_point() +
  labs(x="PIP_after_regionmerge", y="PIP_removesnp") +
  scale_alpha_manual(values = c("problematic genes" = 1, "good genes" = 0.1)) +
  scale_color_manual(values = c("problematic genes" = "red", "good genes" = "black")) +
  geom_abline(slope = 1, intercept = 0, col ="red") +
  ggtitle("problematic regions only, genes only") +
  theme_minimal()
print(sprintf("Total number of molecular traits in problematic regions = %s",nrow(merge_rm_ldmm_removesnp)))
[1] "Total number of molecular traits in problematic regions = 863"print(sprintf("Number of molecular traits disappeared after removing prblematic SNPs = %s", sum(merge_rm_ldmm_removesnp$susie_pip.y == 1.5)))[1] "Number of molecular traits disappeared after removing prblematic SNPs = 2"finemap_res_rm_problematic_gene$highlight <- ifelse(finemap_res_rm_problematic_gene$id %in% problematic_genes, "problematic genes", "good genes")
print(sprintf("The number of problematic genes with PIP < 0.01 = %s",sum(finemap_res_rm_problematic_gene$highlight == "problematic genes" & finemap_res_rm_problematic_gene$susie_pip < 0.01)))[1] "The number of problematic genes with PIP < 0.01 = 2"print("The dots showing PIP =1.5 means: these genes were removed since the only QTLs of them are problematic")[1] "The dots showing PIP =1.5 means: these genes were removed since the only QTLs of them are problematic"grid.arrange(p1,p2,p3, ncol = 3)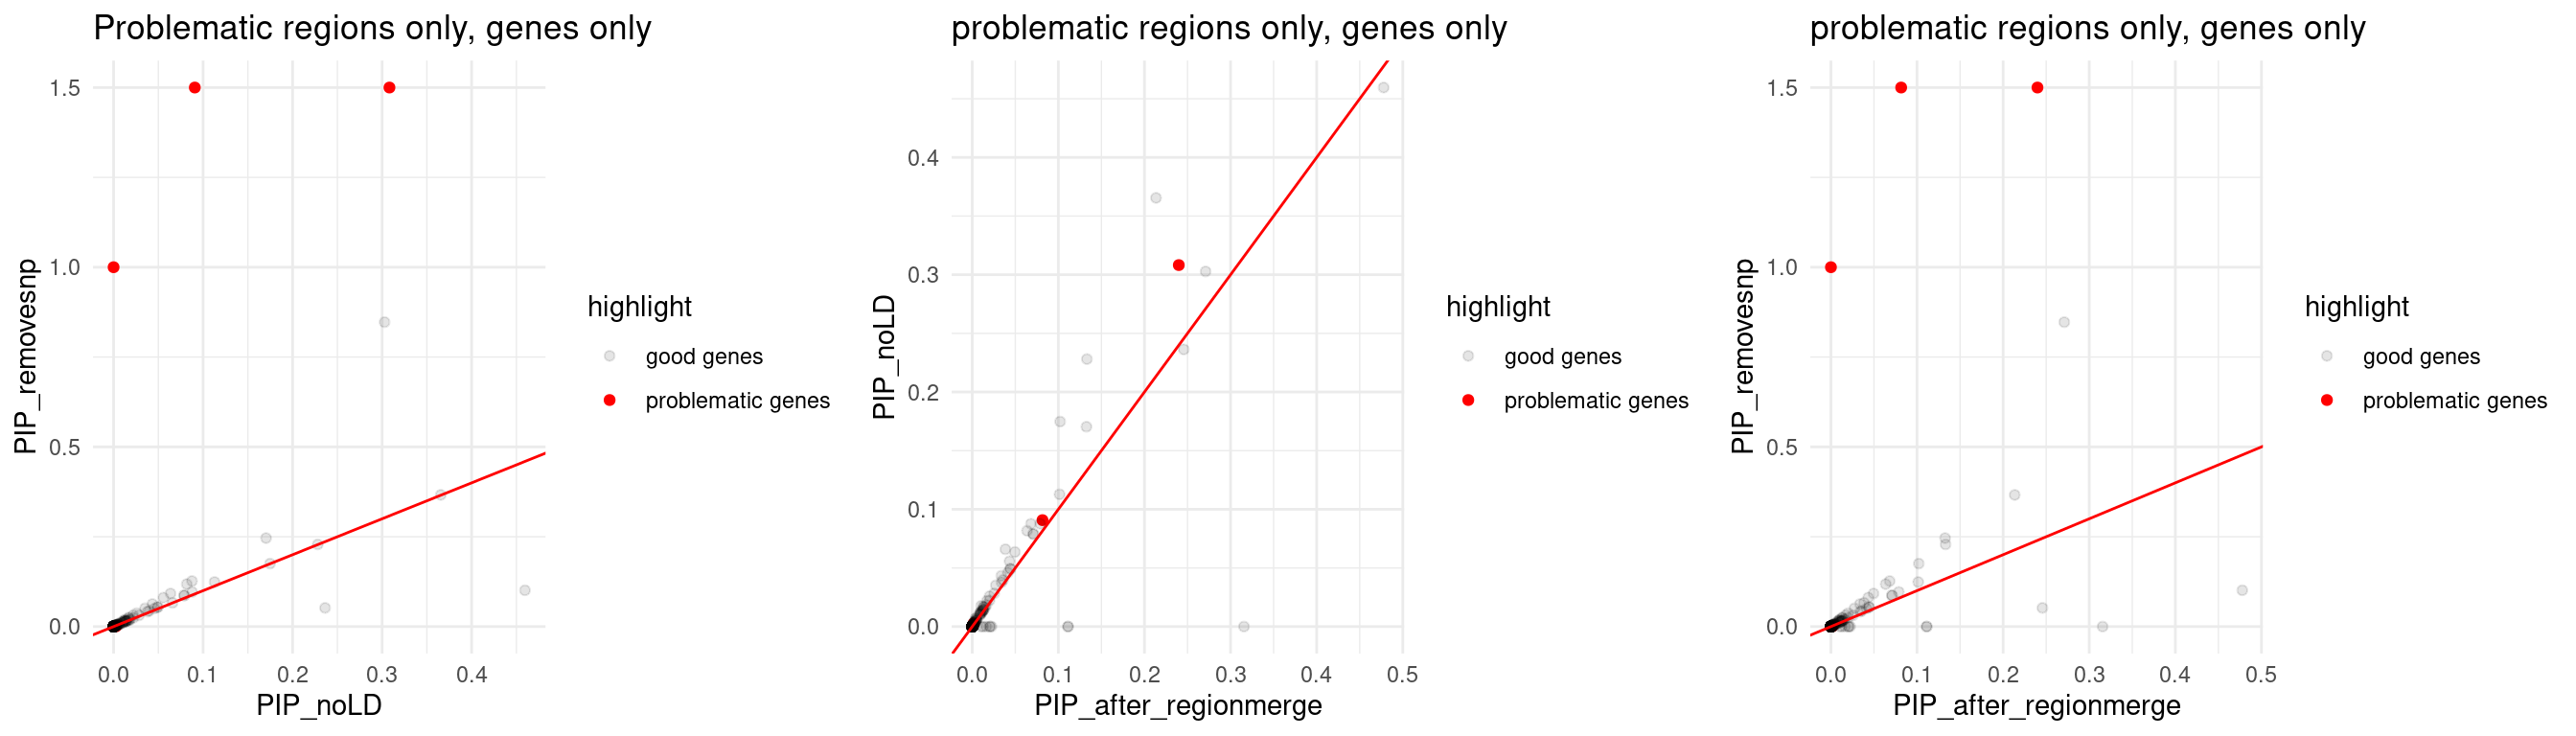
| Version | Author | Date |
|---|---|---|
| 65c1ad1 | XSun | 2024-12-19 |
Comparing z-scores and susie_pip
finemap_res_origin <- ctwas_res_origin$finemap_res
finemap_res_origin_gene <- finemap_res_origin[finemap_res_origin$type != "SNP",]
finemap_res_origin_gene$highlight <- ifelse(finemap_res_origin_gene$id %in% problematic_genes, "problematic genes", "good genes")

p1 <- ggplot(data = finemap_res_origin_gene, aes(x= abs(z), y= susie_pip, color = highlight)) +
  geom_point() +
  scale_color_manual(values = c("problematic genes" = "red", "good genes" = "black")) +
  ggtitle("Original ctwas results") +
  theme_minimal()


finemap_res_rm_gene <- finemap_res_rm[finemap_res_rm$type != "SNP",]
finemap_res_rm_gene$highlight <- ifelse(finemap_res_rm_gene$id %in% problematic_genes, "problematic genes", "good genes")

p2 <- ggplot(data = finemap_res_rm_gene, aes(x= abs(z), y= susie_pip, color = highlight)) +
  geom_point() +
  scale_color_manual(values = c("problematic genes" = "red", "good genes" = "black")) +
  ggtitle("After region merge") +
  theme_minimal()


finemap_res_ldmm_nold_gene <- finemap_res_ldmm_nold[finemap_res_ldmm_nold$type !="SNP",]
finemap_res_ldmm_nold_gene$highlight <- ifelse(finemap_res_ldmm_nold_gene$id %in% problematic_genes, "problematic genes", "good genes")

p3 <- ggplot(data = finemap_res_ldmm_nold_gene, aes(x= abs(z), y= susie_pip, color = highlight)) +
  geom_point() +
  scale_color_manual(values = c("problematic genes" = "red", "good genes" = "black")) +
  ggtitle("After LD mismatch fixed -- noLD") +
  theme_minimal()

finemap_res_ldmm_removesnp_gene <- finemap_res_ldmm_removesnp[finemap_res_ldmm_removesnp$type !="SNP",]
finemap_res_ldmm_removesnp_gene$highlight <- ifelse(finemap_res_ldmm_removesnp_gene$id %in% problematic_genes, "problematic genes", "good genes")

p4 <- ggplot(data = finemap_res_ldmm_removesnp_gene, aes(x= abs(z), y= susie_pip, color = highlight)) +
  geom_point() +
  scale_color_manual(values = c("problematic genes" = "red", "good genes" = "black")) +
  ggtitle("After LD mismatch fixed -- SNP removed") +
  theme_minimal()


grid.arrange(p1,p2,p3,p4, ncol = 4)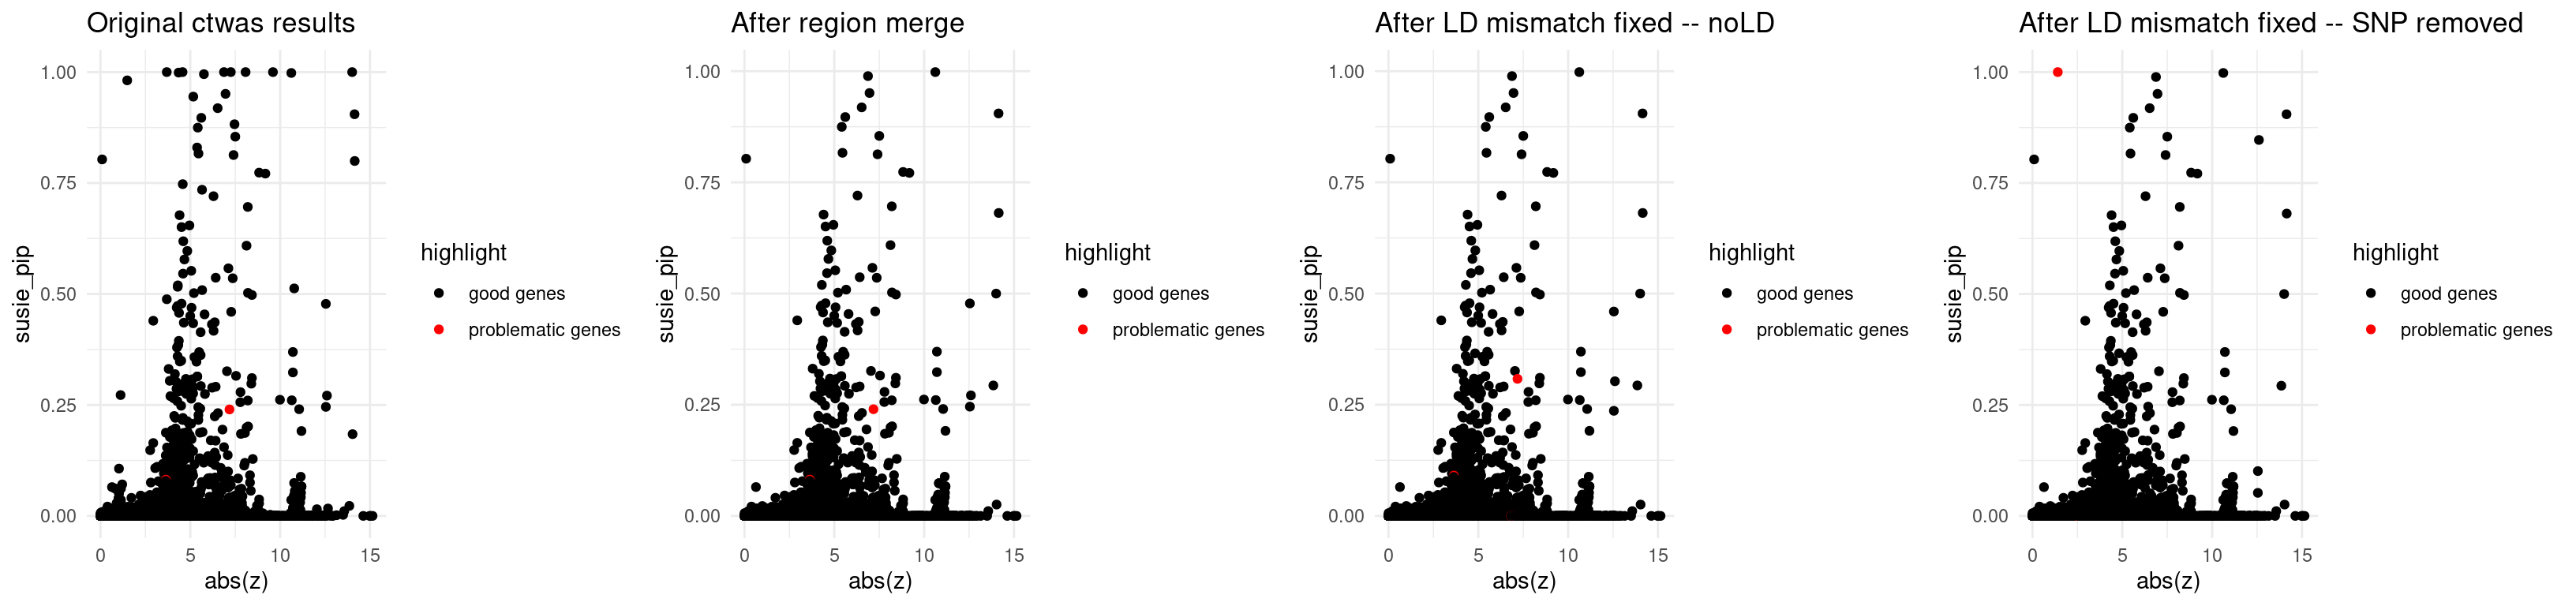
| Version | Author | Date |
|---|---|---|
| 65c1ad1 | XSun | 2024-12-19 |
print("L - estimated in region merge step")[1] "L - estimated in region merge step"print(updated_data_res_regionmerge$updated_region_L[problematic_region_ids]) 5_96627815_97979897 9_136047132_136605890 11_15721006_17556855
1 2 1
17_3799018_4792966
1 load(paste0("/project/xinhe/xsun/multi_group_ctwas/11.multi_group_1008/post_process_rm_ld/ldmismatch_pipthres05_removesnp_rescreenregion_",trait,".rdata"))
print("L - re-estimated after updating z_scores, region data")[1] "L - re-estimated after updating z_scores, region data"print(screen_res$screened_region_L) 5_96627815_97979897 9_136047132_136605890 11_15721006_17556855
1 2 1
17_3799018_4792966
1 print("Zoom in the z<15 part")[1] "Zoom in the z<15 part"finemap_res_origin_gene_prob <- finemap_res_origin_gene[finemap_res_origin_gene$highlight == "problematic genes",]
p1 <- ggplot(data = finemap_res_origin_gene_prob,
aes(x = abs(z), y = susie_pip, color = highlight, alpha = highlight)) +
geom_point() +
scale_color_manual(values = c("problematic genes" = "red", "good genes" = "black")) +
scale_alpha_manual(values = c("problematic genes" = 1, "good genes" = 0.01)) +
ggtitle("Original ctwas results") +
theme_minimal() +
xlim(0, 15)
finemap_res_rm_gene_prob <- finemap_res_rm_gene[finemap_res_rm_gene$highlight == "problematic genes",]
p2 <- ggplot(data = finemap_res_rm_gene_prob,
aes(x = abs(z), y = susie_pip, color = highlight, alpha = highlight)) +
geom_point() +
scale_color_manual(values = c("problematic genes" = "red", "good genes" = "black")) +
scale_alpha_manual(values = c("problematic genes" = 1, "good genes" = 0.01)) +
ggtitle("After region merge") +
theme_minimal() +
xlim(0, 15)
finemap_res_ldmm_nold_gene_prob <- finemap_res_ldmm_nold_gene[finemap_res_ldmm_nold_gene$highlight == "problematic genes",]
p3 <- ggplot(data = finemap_res_ldmm_nold_gene_prob,
aes(x = abs(z), y = susie_pip, color = highlight, alpha = highlight)) +
geom_point() +
scale_color_manual(values = c("problematic genes" = "red", "good genes" = "black")) +
scale_alpha_manual(values = c("problematic genes" = 1, "good genes" = 0.01)) +
ggtitle("After LD mismatch fixed -- noLD") +
theme_minimal() +
xlim(0, 15)
finemap_res_ldmm_removesnp_gene_prob <- finemap_res_ldmm_removesnp_gene[finemap_res_ldmm_removesnp_gene$highlight == "problematic genes",]
p4 <- ggplot(data = finemap_res_ldmm_removesnp_gene_prob,
aes(x = abs(z), y = susie_pip, color = highlight, alpha = highlight)) +
geom_point() +
scale_color_manual(values = c("problematic genes" = "red", "good genes" = "black")) +
scale_alpha_manual(values = c("problematic genes" = 1, "good genes" = 0.01)) +
ggtitle("After LD mismatch fixed -- SNP removed") +
theme_minimal() +
xlim(0, 15)
grid.arrange(p1,p2,p3,p4, ncol = 4)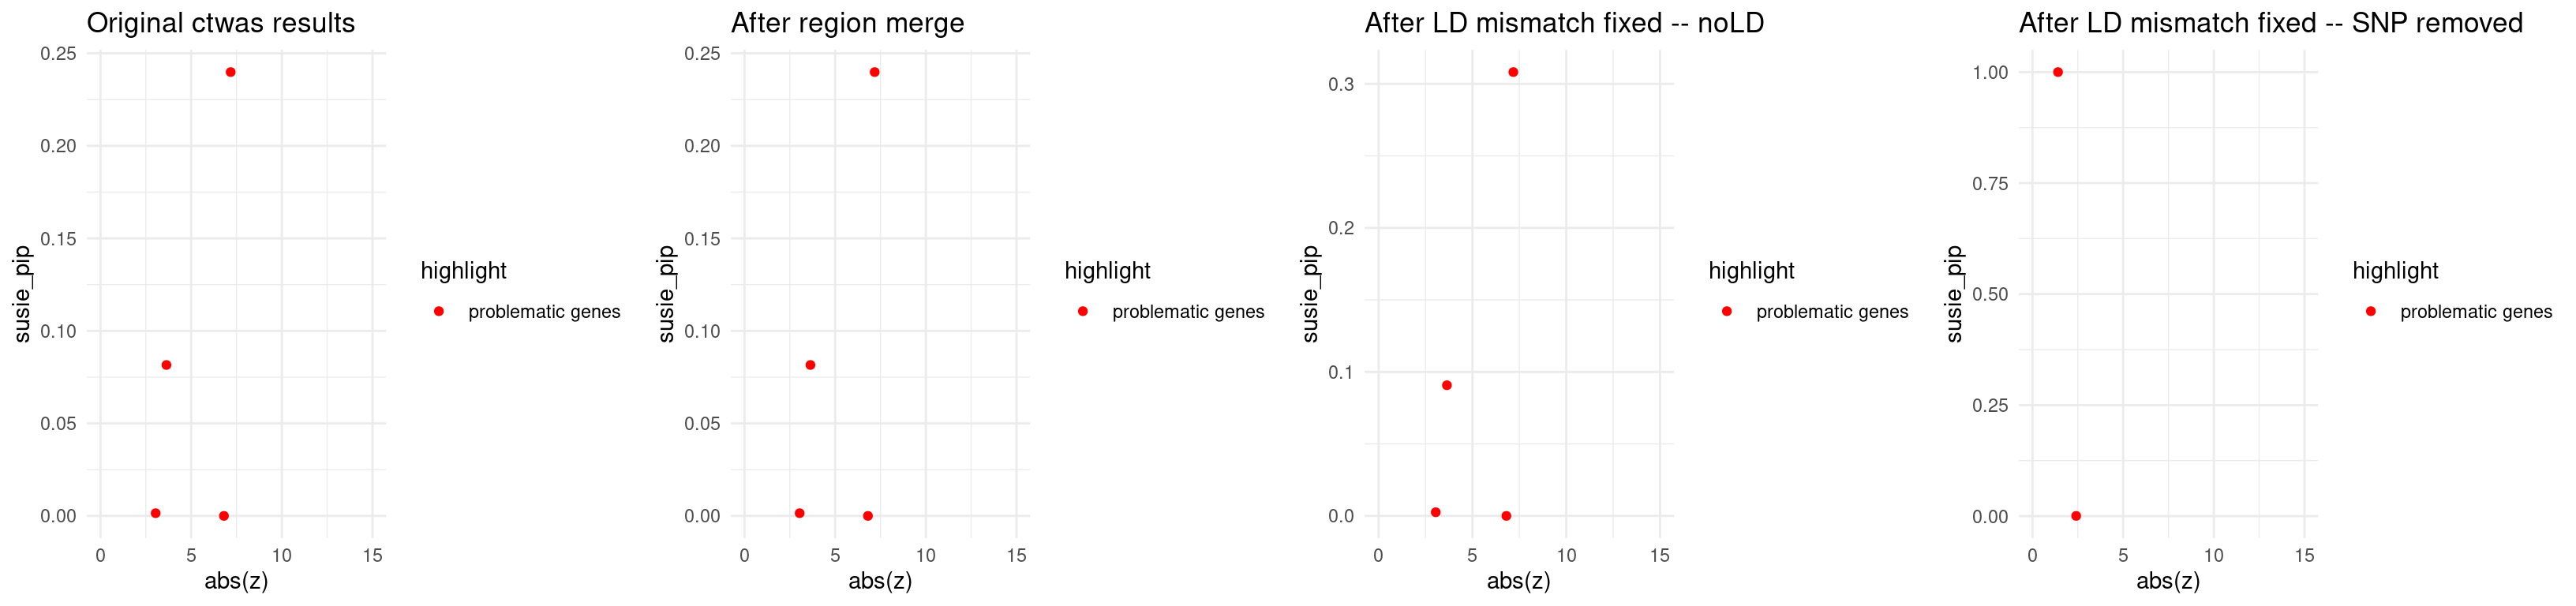
| Version | Author | Date |
|---|---|---|
| 65c1ad1 | XSun | 2024-12-19 |
SBP-ukb-a-360
trait <- "SBP-ukb-a-360"

results_dir_origin <- paste0("/project/xinhe/xsun/multi_group_ctwas/11.multi_group_1008/results/",trait,"/")
ctwas_res_origin <- readRDS(paste0(results_dir_origin,trait,".ctwas.res.RDS"))

finemap_res_origin <- ctwas_res_origin$finemap_res
Region merge
load(paste0("/project/xinhe/xsun/multi_group_ctwas/11.multi_group_1008/post_process_rm_ld/rm_",trait,".rdata"))

finemap_res_rm <- res_regionmerge$finemap_res
finemap_res_rm_boundary_genes <- finemap_res_rm[finemap_res_rm$id %in%selected_boundary_genes$id,]
finemap_res_rm_boundary_genes_pip <- finemap_res_rm_boundary_genes[,c("id","susie_pip","cs")]


finemap_res_origin_boundary_genes <- finemap_res_origin[finemap_res_origin$id %in%selected_boundary_genes$id,]
finemap_res_origin_boundary_genes_pip <- finemap_res_origin_boundary_genes[,c("id","susie_pip","cs")]

finemap_res_compare_regionmerge <- merge(finemap_res_origin_boundary_genes_pip,finemap_res_rm_boundary_genes_pip, by = "id")
colnames(finemap_res_compare_regionmerge) <- c("id","susie_pip_origin","cs_origin","susie_pip_reginmerge","cs_reginmerge")

DT::datatable(finemap_res_compare_regionmerge,caption = htmltools::tags$caption( style = 'caption-side: left; text-align: left; color:black;  font-size:150% ;','Selected boundary genes (susie_pip > 0.5)'),options = list(pageLength = 10) )
LD-mismatch
Diagnosis
file_pipthreshold02 <- paste0("/project/xinhe/xsun/multi_group_ctwas/11.multi_group_1008/post_process_rm_ld/ldmismatch_diagnosis_pipthres02_", trait, ".rdata")

load(file_pipthreshold02)
pip_02 <- data.frame(
  "PIP Threshold" = "0.2",
  "Number of Selected Regions" = length(selected_region_ids),
  "Number of Problematic Genes" = length(problematic_genes),
  "Number of Problematic Regions" = length(problematic_region_ids),
  "Number of Problematic SNPs" = length(res_ldmismatch$problematic_snps),
  "Number of Flipped SNPs" = length(res_ldmismatch$flipped_snps)
)


file_pipthreshold05 <- paste0("/project/xinhe/xsun/multi_group_ctwas/11.multi_group_1008/post_process_rm_ld/ldmismatch_diagnosis_pipthres05_", trait, ".rdata")

load(file_pipthreshold05)
pip_05 <- data.frame(
  "PIP Threshold" = "0.5",
  "Number of Selected Regions" = length(selected_region_ids),
  "Number of Problematic Genes" = length(problematic_genes),
  "Number of Problematic Regions" = length(problematic_region_ids),
  "Number of Problematic SNPs" = length(res_ldmismatch$problematic_snps),
  "Number of Flipped SNPs" = length(res_ldmismatch$flipped_snps)
)

results_table <- rbind(pip_02, pip_05)

DT::datatable(results_table,caption = htmltools::tags$caption( style = 'caption-side: left; text-align: left; color:black;  font-size:150% ;','LD mismatch diagnosis table for different gene cutoff'),options = list(pageLength = 10) )
Comparing 2 LD mismatch fixing methods
load(paste0("/project/xinhe/xsun/multi_group_ctwas/11.multi_group_1008/post_process_rm_ld/ldmismatch_pipthres05_nold_",trait,".rdata"))
finemap_res_ldmm_nold <- res_ldmm_nold$finemap_res
load(paste0("/project/xinhe/xsun/multi_group_ctwas/11.multi_group_1008/post_process_rm_ld/ldmismatch_pipthres02_removesnp_",trait,".rdata"))
finemap_res_ldmm_removesnp <- res_ldmm_removesnp$finemap_res

finemap_res_ldmm_nold_problematic_gene <- finemap_res_ldmm_nold[finemap_res_ldmm_nold$region_id %in% problematic_region_ids & finemap_res_ldmm_nold$type != "SNP",]
finemap_res_ldmm_removesnp_problematic_gene <- finemap_res_ldmm_removesnp[finemap_res_ldmm_removesnp$region_id %in% problematic_region_ids & finemap_res_ldmm_removesnp$type != "SNP",]

merge_2method <- merge(finemap_res_ldmm_nold_problematic_gene,finemap_res_ldmm_removesnp_problematic_gene, by ="id",all.x=T)
merge_2method$highlight <- ifelse(merge_2method$id %in% problematic_genes, "problematic genes", "good genes")
merge_2method$susie_pip.y[is.na(merge_2method$susie_pip.y)] <- 1.5
p1 <- ggplot(data = merge_2method, aes(x = susie_pip.x, y = susie_pip.y, color = highlight, alpha = highlight)) +
  geom_point() +
  scale_color_manual(values = c("problematic genes" = "red", "good genes" = "black")) +
  scale_alpha_manual(values = c("problematic genes" = 1, "good genes" = 0.1)) +
  labs(x = "PIP_noLD", y = "PIP_removesnp") +
  geom_abline(slope = 1, intercept = 0, col = "red") +
  ggtitle("Problematic regions only, genes only") +
  theme_minimal()

finemap_res_rm_problematic_gene <- finemap_res_rm[finemap_res_rm$region_id %in% problematic_region_ids & finemap_res_rm$type != "SNP",]

merge_rm_ldmm_nold <-  merge(finemap_res_rm_problematic_gene,finemap_res_ldmm_nold_problematic_gene, by ="id",all.x=T)
merge_rm_ldmm_nold$highlight <- ifelse(merge_rm_ldmm_nold$id %in% problematic_genes, "problematic genes", "good genes")
merge_rm_ldmm_nold$susie_pip.y[is.na(merge_rm_ldmm_nold$susie_pip.y)] <- 1.5
p2 <- ggplot(data = merge_rm_ldmm_nold, aes(x= susie_pip.x, y= susie_pip.y, color = highlight, alpha = highlight)) +
  geom_point() +
  labs(x="PIP_after_regionmerge", y="PIP_noLD") +
  scale_color_manual(values = c("problematic genes" = "red", "good genes" = "black")) +
  scale_alpha_manual(values = c("problematic genes" = 1, "good genes" = 0.1)) +
  geom_abline(slope = 1, intercept = 0, col ="red") +
  ggtitle("problematic regions only, genes only") +
  theme_minimal()

merge_rm_ldmm_removesnp <-  merge(finemap_res_rm_problematic_gene,finemap_res_ldmm_removesnp_problematic_gene, by ="id",all.x =T)
merge_rm_ldmm_removesnp$highlight <- ifelse(merge_rm_ldmm_removesnp$id %in% problematic_genes, "problematic genes", "good genes")
merge_rm_ldmm_removesnp$susie_pip.y[is.na(merge_rm_ldmm_removesnp$susie_pip.y)] <- 1.5
p3 <- ggplot(data = merge_rm_ldmm_removesnp, aes(x= susie_pip.x, y= susie_pip.y, color = highlight, alpha = highlight)) +
  geom_point() +
  labs(x="PIP_after_regionmerge", y="PIP_removesnp") +
  scale_alpha_manual(values = c("problematic genes" = 1, "good genes" = 0.1)) +
  scale_color_manual(values = c("problematic genes" = "red", "good genes" = "black")) +
  geom_abline(slope = 1, intercept = 0, col ="red") +
  ggtitle("problematic regions only, genes only") +
  theme_minimal()
print(sprintf("Total number of molecular traits in problematic regions = %s",nrow(merge_rm_ldmm_removesnp)))
[1] "Total number of molecular traits in problematic regions = 1912"print(sprintf("Number of molecular traits disappeared after removing prblematic SNPs = %s", sum(merge_rm_ldmm_removesnp$susie_pip.y == 1.5)))[1] "Number of molecular traits disappeared after removing prblematic SNPs = 6"finemap_res_rm_problematic_gene$highlight <- ifelse(finemap_res_rm_problematic_gene$id %in% problematic_genes, "problematic genes", "good genes")
print(sprintf("The number of problematic genes with PIP < 0.01 = %s",sum(finemap_res_rm_problematic_gene$highlight == "problematic genes" & finemap_res_rm_problematic_gene$susie_pip < 0.01)))[1] "The number of problematic genes with PIP < 0.01 = 7"print("The dots showing PIP =1.5 means: these genes were removed since the only QTLs of them are problematic")[1] "The dots showing PIP =1.5 means: these genes were removed since the only QTLs of them are problematic"grid.arrange(p1,p2,p3, ncol = 3)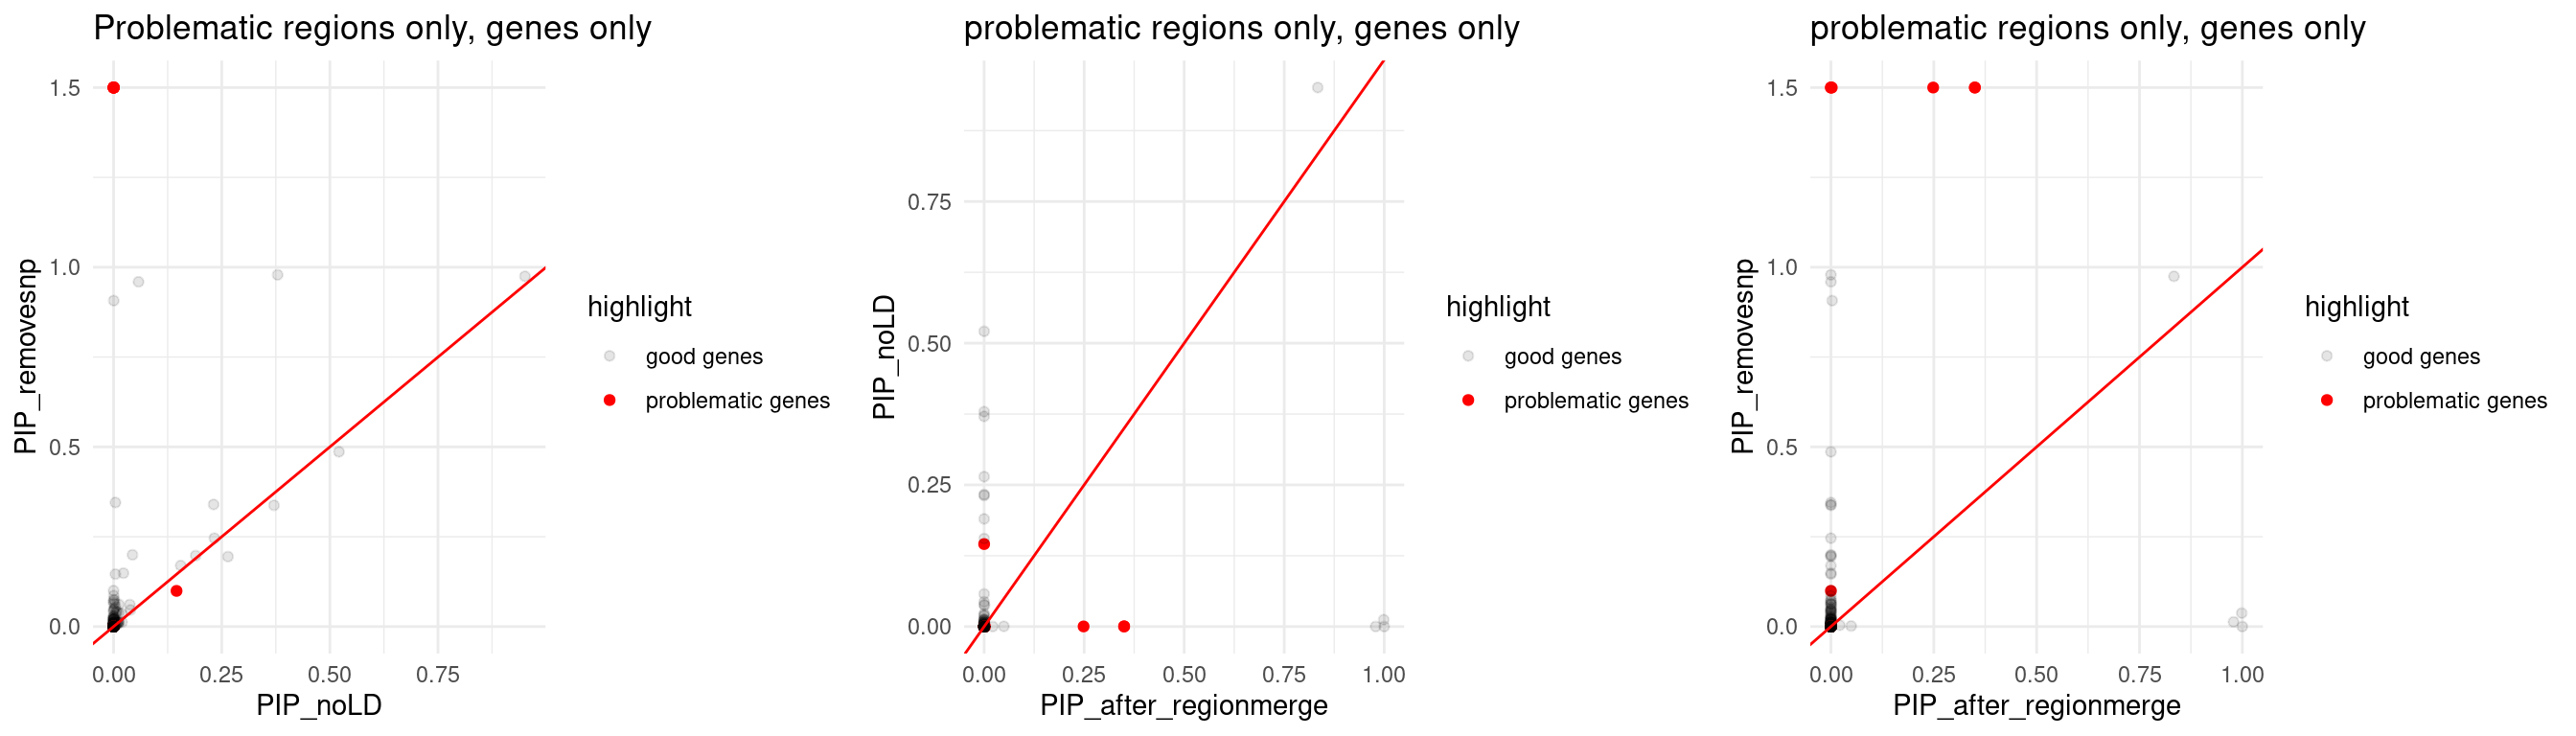
| Version | Author | Date |
|---|---|---|
| 65c1ad1 | XSun | 2024-12-19 |
Comparing z-scores and susie_pip
finemap_res_origin <- ctwas_res_origin$finemap_res
finemap_res_origin_gene <- finemap_res_origin[finemap_res_origin$type != "SNP",]
finemap_res_origin_gene$highlight <- ifelse(finemap_res_origin_gene$id %in% problematic_genes, "problematic genes", "good genes")

p1 <- ggplot(data = finemap_res_origin_gene, aes(x= abs(z), y= susie_pip, color = highlight)) +
  geom_point() +
  scale_color_manual(values = c("problematic genes" = "red", "good genes" = "black")) +
  ggtitle("Original ctwas results") +
  theme_minimal()


finemap_res_rm_gene <- finemap_res_rm[finemap_res_rm$type != "SNP",]
finemap_res_rm_gene$highlight <- ifelse(finemap_res_rm_gene$id %in% problematic_genes, "problematic genes", "good genes")

p2 <- ggplot(data = finemap_res_rm_gene, aes(x= abs(z), y= susie_pip, color = highlight)) +
  geom_point() +
  scale_color_manual(values = c("problematic genes" = "red", "good genes" = "black")) +
  ggtitle("After region merge") +
  theme_minimal()


finemap_res_ldmm_nold_gene <- finemap_res_ldmm_nold[finemap_res_ldmm_nold$type !="SNP",]
finemap_res_ldmm_nold_gene$highlight <- ifelse(finemap_res_ldmm_nold_gene$id %in% problematic_genes, "problematic genes", "good genes")

p3 <- ggplot(data = finemap_res_ldmm_nold_gene, aes(x= abs(z), y= susie_pip, color = highlight)) +
  geom_point() +
  scale_color_manual(values = c("problematic genes" = "red", "good genes" = "black")) +
  ggtitle("After LD mismatch fixed -- noLD") +
  theme_minimal()

finemap_res_ldmm_removesnp_gene <- finemap_res_ldmm_removesnp[finemap_res_ldmm_removesnp$type !="SNP",]
finemap_res_ldmm_removesnp_gene$highlight <- ifelse(finemap_res_ldmm_removesnp_gene$id %in% problematic_genes, "problematic genes", "good genes")

p4 <- ggplot(data = finemap_res_ldmm_removesnp_gene, aes(x= abs(z), y= susie_pip, color = highlight)) +
  geom_point() +
  scale_color_manual(values = c("problematic genes" = "red", "good genes" = "black")) +
  ggtitle("After LD mismatch fixed -- SNP removed") +
  theme_minimal()


grid.arrange(p1,p2,p3,p4, ncol = 4)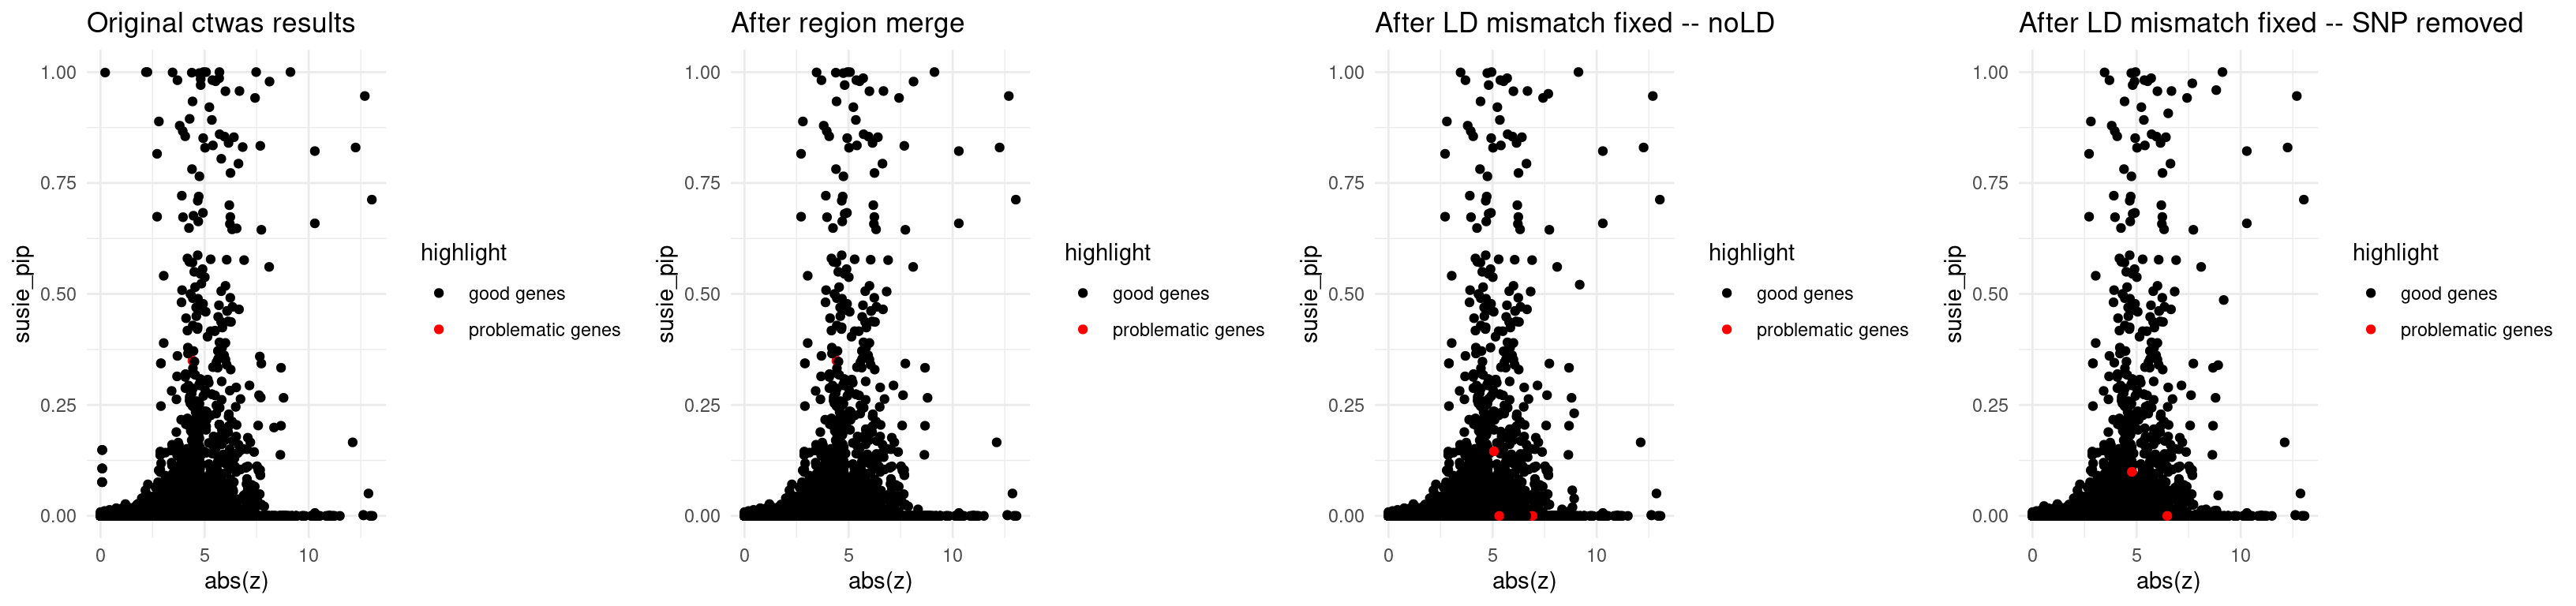
| Version | Author | Date |
|---|---|---|
| 65c1ad1 | XSun | 2024-12-19 |
print("L - estimated in region merge step")[1] "L - estimated in region merge step"print(updated_data_res_regionmerge$updated_region_L[problematic_region_ids])3_133533329_135738064 6_31603441_32714887 11_1192365_3644251
2 3 3
16_3951195_5068344
3 load(paste0("/project/xinhe/xsun/multi_group_ctwas/11.multi_group_1008/post_process_rm_ld/ldmismatch_pipthres05_removesnp_rescreenregion_",trait,".rdata"))
print("L - re-estimated after updating z_scores, region data")[1] "L - re-estimated after updating z_scores, region data"print(screen_res$screened_region_L)3_133533329_135738064 6_31603441_32714887 11_1192365_3644251
2 3 3
16_3951195_5068344
2 print("Zoom in the z<15 part")[1] "Zoom in the z<15 part"finemap_res_origin_gene_prob <- finemap_res_origin_gene[finemap_res_origin_gene$highlight == "problematic genes",]
p1 <- ggplot(data = finemap_res_origin_gene_prob,
aes(x = abs(z), y = susie_pip, color = highlight, alpha = highlight)) +
geom_point() +
scale_color_manual(values = c("problematic genes" = "red", "good genes" = "black")) +
scale_alpha_manual(values = c("problematic genes" = 1, "good genes" = 0.01)) +
ggtitle("Original ctwas results") +
theme_minimal() +
xlim(0, 15)
finemap_res_rm_gene_prob <- finemap_res_rm_gene[finemap_res_rm_gene$highlight == "problematic genes",]
p2 <- ggplot(data = finemap_res_rm_gene_prob,
aes(x = abs(z), y = susie_pip, color = highlight, alpha = highlight)) +
geom_point() +
scale_color_manual(values = c("problematic genes" = "red", "good genes" = "black")) +
scale_alpha_manual(values = c("problematic genes" = 1, "good genes" = 0.01)) +
ggtitle("After region merge") +
theme_minimal() +
xlim(0, 15)
finemap_res_ldmm_nold_gene_prob <- finemap_res_ldmm_nold_gene[finemap_res_ldmm_nold_gene$highlight == "problematic genes",]
p3 <- ggplot(data = finemap_res_ldmm_nold_gene_prob,
aes(x = abs(z), y = susie_pip, color = highlight, alpha = highlight)) +
geom_point() +
scale_color_manual(values = c("problematic genes" = "red", "good genes" = "black")) +
scale_alpha_manual(values = c("problematic genes" = 1, "good genes" = 0.01)) +
ggtitle("After LD mismatch fixed -- noLD") +
theme_minimal() +
xlim(0, 15)
finemap_res_ldmm_removesnp_gene_prob <- finemap_res_ldmm_removesnp_gene[finemap_res_ldmm_removesnp_gene$highlight == "problematic genes",]
p4 <- ggplot(data = finemap_res_ldmm_removesnp_gene_prob,
aes(x = abs(z), y = susie_pip, color = highlight, alpha = highlight)) +
geom_point() +
scale_color_manual(values = c("problematic genes" = "red", "good genes" = "black")) +
scale_alpha_manual(values = c("problematic genes" = 1, "good genes" = 0.01)) +
ggtitle("After LD mismatch fixed -- SNP removed") +
theme_minimal() +
xlim(0, 15)
grid.arrange(p1,p2,p3,p4, ncol = 4)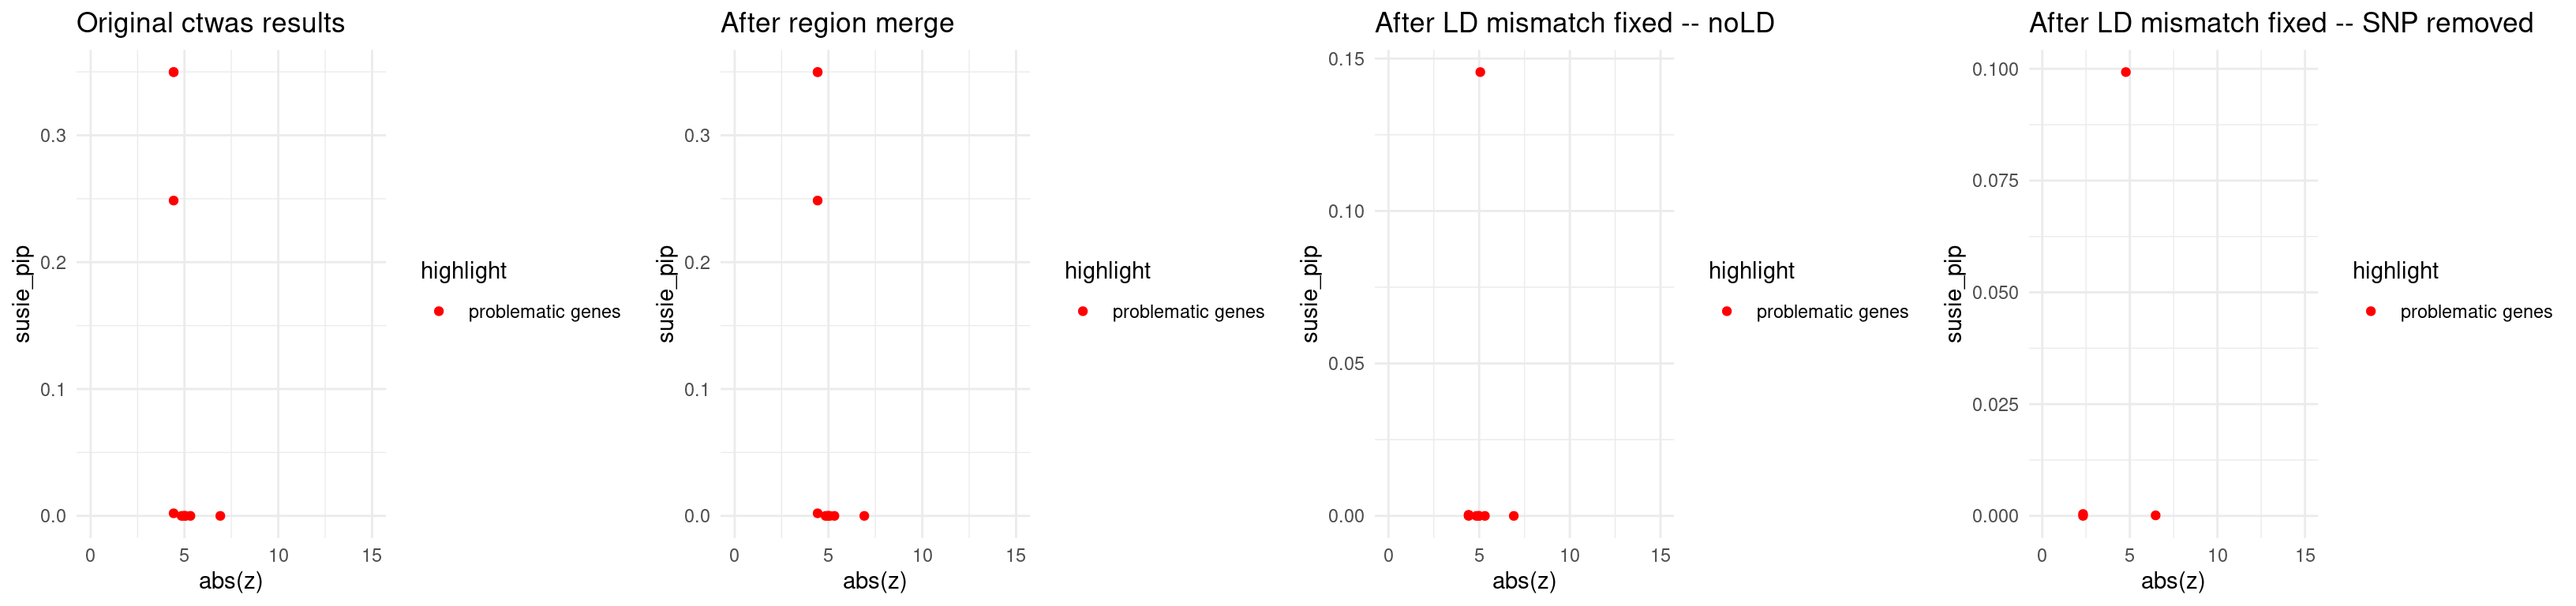
| Version | Author | Date |
|---|---|---|
| 65c1ad1 | XSun | 2024-12-19 |
Examples for LD-mismatch fixing
weights_origin <- readRDS(paste0("/project/xinhe/xsun/multi_group_ctwas/11.multi_group_1008/results/",trait,"/",trait,".preprocessed.weights.RDS"))

load(paste0("/project/xinhe/xsun/multi_group_ctwas/11.multi_group_1008/post_process_rm_ld/ldmismatch_pipthres05_removesnp_weights_updated_",trait,".rdata"))


finemap_res_rm <- anno_finemap_res(finemap_res_rm,
                                          snp_map = updated_data_res_regionmerge[["updated_snp_map"]],
                                          mapping_table = mapping_two,
                                          add_gene_annot = TRUE,
                                          map_by = "molecular_id",
                                          drop_unmapped = TRUE,
                                          add_position = TRUE,
                                          use_gene_pos = "mid")
2024-12-19 14:37:58 INFO::Annotating fine-mapping result ...
2024-12-19 14:37:58 INFO::Map molecular traits to genes
2024-12-19 14:37:59 INFO::Split PIPs for molecular traits mapped to multiple genes
2024-12-19 14:38:04 INFO::Add gene positions
2024-12-19 14:38:04 INFO::Add SNP positionsfinemap_res_ldmm_nold <- anno_finemap_res(finemap_res_ldmm_nold,
snp_map = updated_data_res_regionmerge[["updated_snp_map"]],
mapping_table = mapping_two,
add_gene_annot = TRUE,
map_by = "molecular_id",
drop_unmapped = TRUE,
add_position = TRUE,
use_gene_pos = "mid")2024-12-19 14:38:11 INFO::Annotating fine-mapping result ...
2024-12-19 14:38:11 INFO::Map molecular traits to genes
2024-12-19 14:38:11 INFO::Split PIPs for molecular traits mapped to multiple genes
2024-12-19 14:38:19 INFO::Add gene positions
2024-12-19 14:38:19 INFO::Add SNP positionsfinemap_res_ldmm_removesnp <- anno_finemap_res(finemap_res_ldmm_removesnp,
snp_map = updated_data_res_regionmerge[["updated_snp_map"]],
mapping_table = mapping_two,
add_gene_annot = TRUE,
map_by = "molecular_id",
drop_unmapped = TRUE,
add_position = TRUE,
use_gene_pos = "mid")2024-12-19 14:38:24 INFO::Annotating fine-mapping result ...
2024-12-19 14:38:25 INFO::Map molecular traits to genes
2024-12-19 14:38:25 INFO::Split PIPs for molecular traits mapped to multiple genes
2024-12-19 14:38:29 INFO::Add gene positions
2024-12-19 14:38:29 INFO::Add SNP positionsfinemap_res_rm_gene <- finemap_res_rm[finemap_res_rm$type != "SNP",]
finemap_res_ldmm_removesnp_gene <- finemap_res_ldmm_removesnp[finemap_res_ldmm_removesnp$type !="SNP",]
region_id <- "11_1192365_3644251"
print("locus plot -- after region merge")[1] "locus plot -- after region merge"make_locusplot(finemap_res_rm,
region_id = region_id,
ens_db = ens_db,
weights = weights_origin,
highlight_pip = 0.8,
filter_protein_coding_genes = TRUE,
filter_cs = TRUE,
color_pval_by = "cs",
color_pip_by = "cs",panel.heights = c(4,4,1,1))2024-12-19 14:38:39 INFO::Limit to protein coding genes
2024-12-19 14:38:39 INFO::focal id: intron_11_1925116_1929810|Artery_Tibial_sQTL
2024-12-19 14:38:39 INFO::focal molecular trait: TNNT3 Artery_Tibial sQTL
2024-12-19 14:38:39 INFO::Range of locus: chr11:1192481-3644228
2024-12-19 14:38:40 INFO::focal molecular trait QTL positions: 1924654,1929361
2024-12-19 14:38:40 INFO::Limit PIPs to credible sets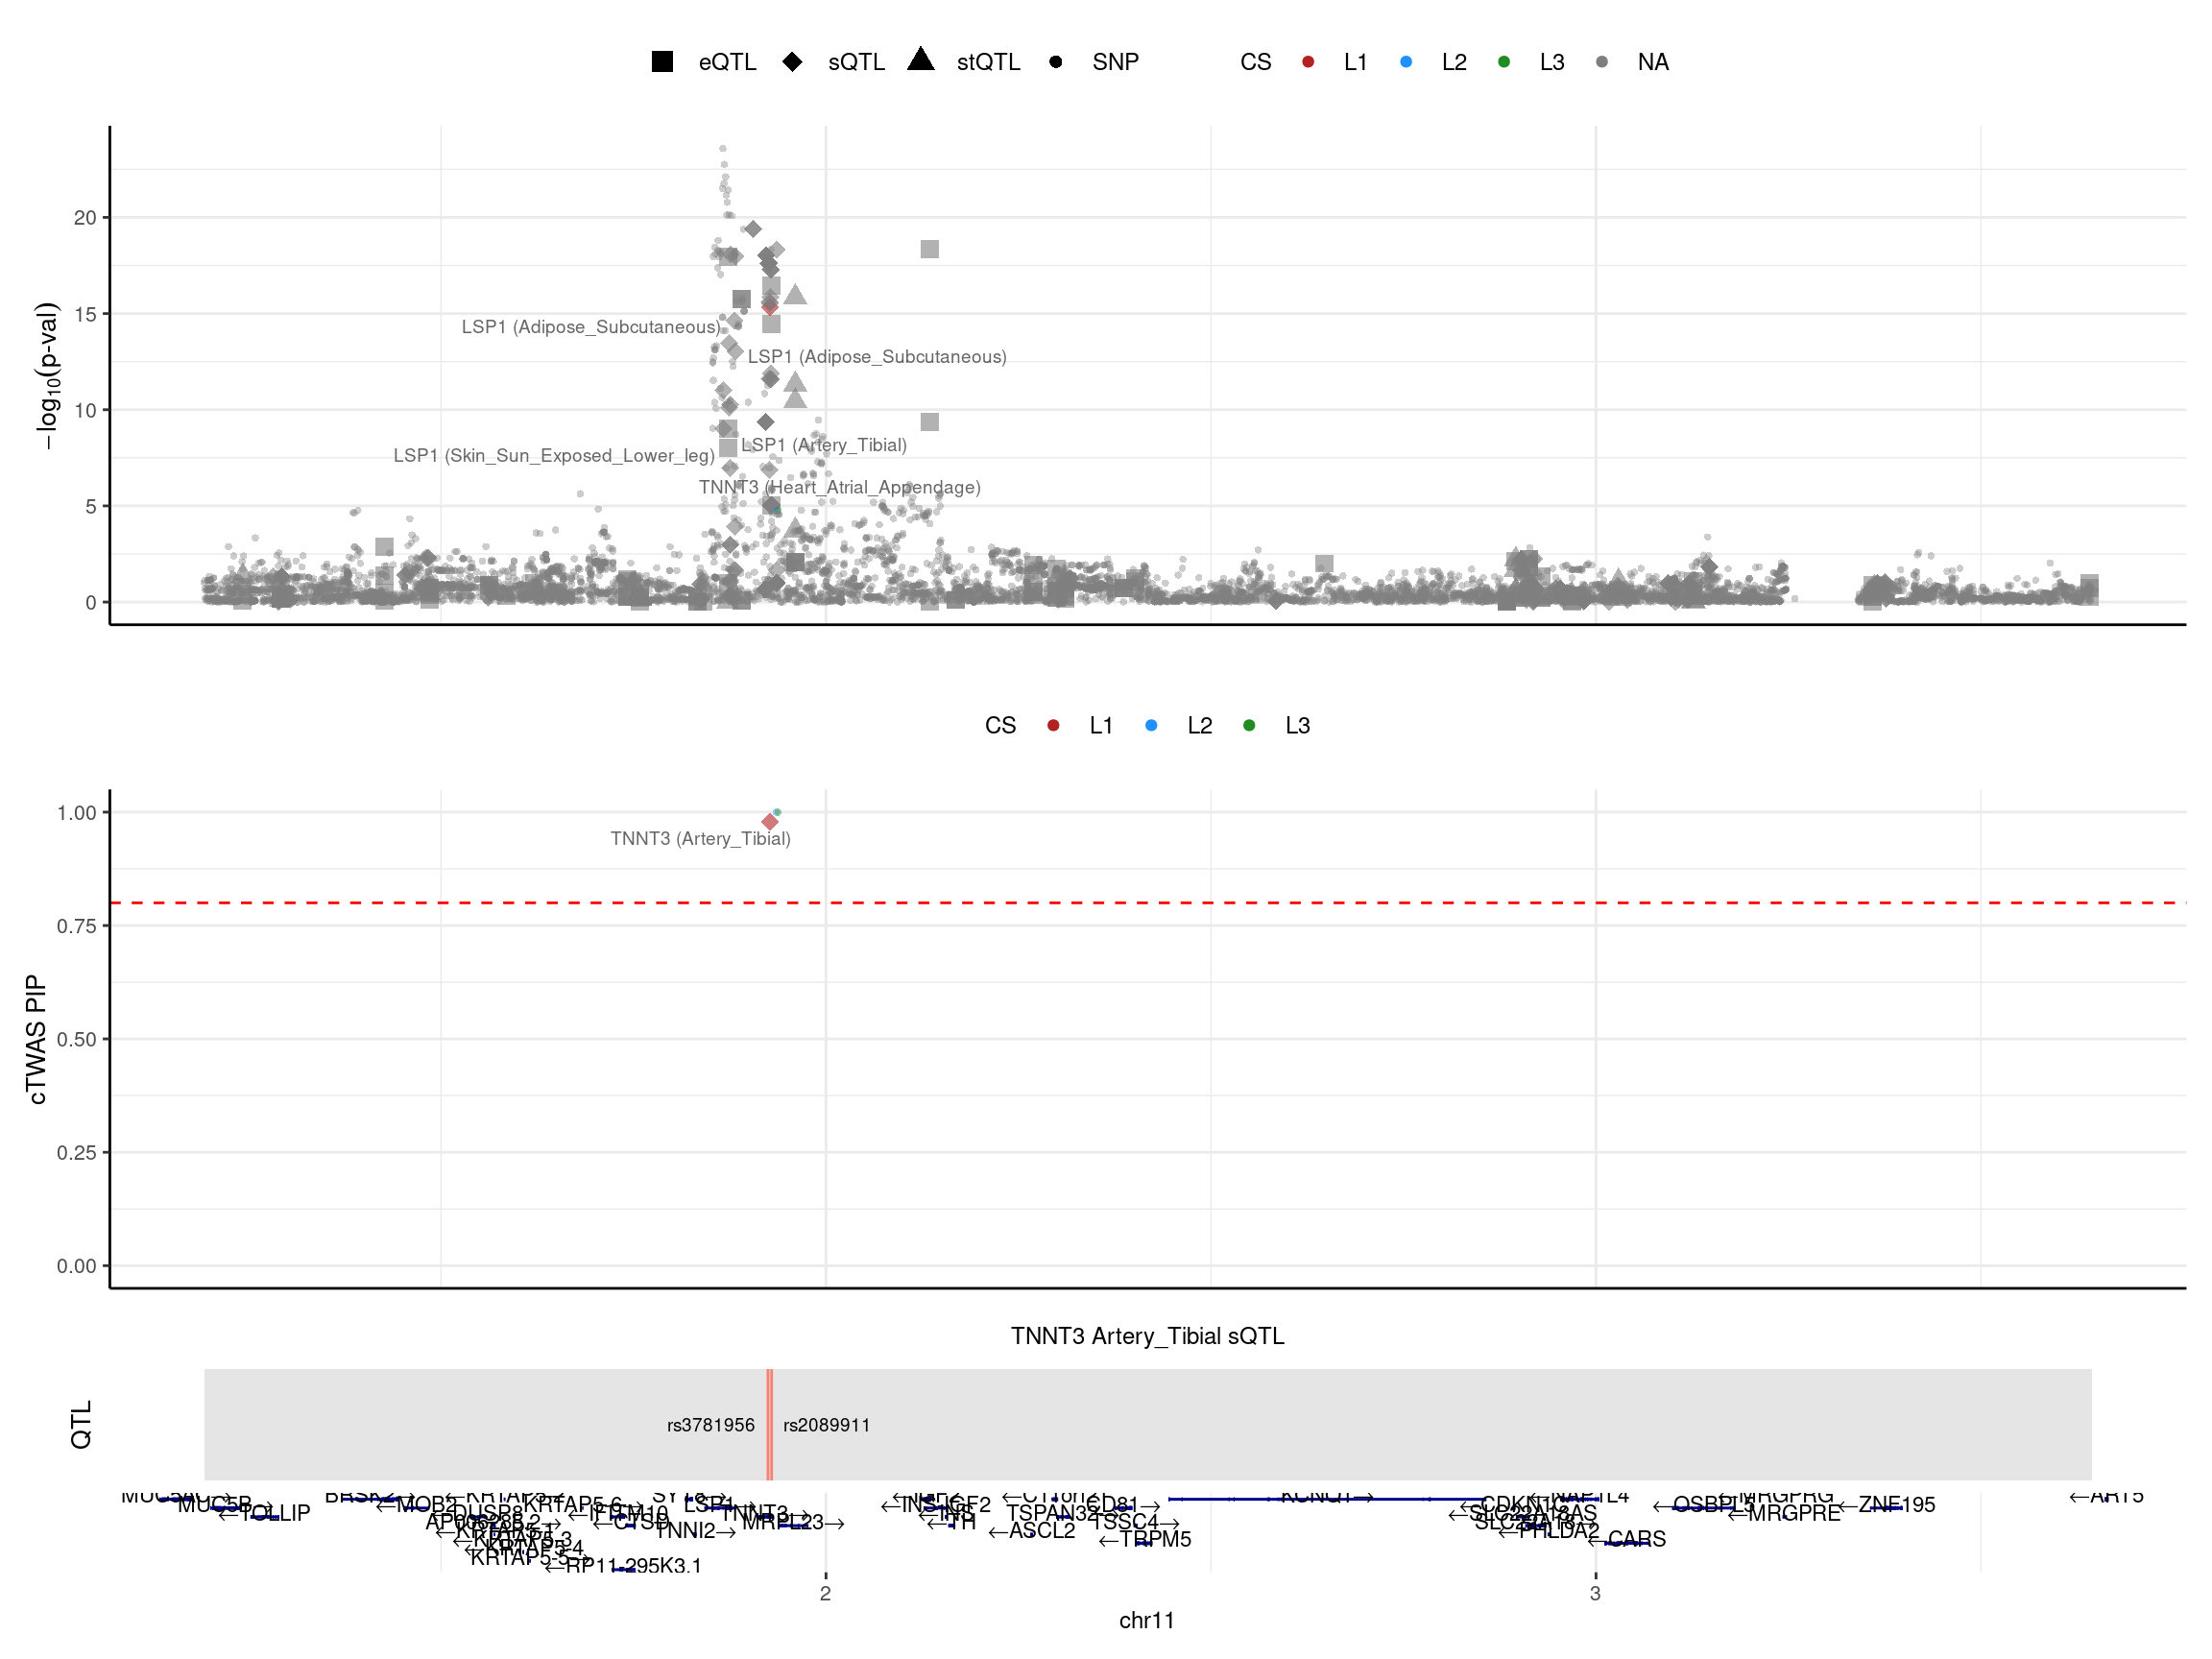
| Version | Author | Date |
|---|---|---|
| 65c1ad1 | XSun | 2024-12-19 |
print("locus plot -- LD mismatch: no LD")[1] "locus plot -- LD mismatch: no LD"make_locusplot(finemap_res_ldmm_nold,
region_id = region_id,
ens_db = ens_db,
weights = weights_origin,
highlight_pip = 0.8,
filter_protein_coding_genes = TRUE,
filter_cs = TRUE,
color_pval_by = "cs",
color_pip_by = "cs",panel.heights = c(4,4,1,1))2024-12-19 14:38:42 INFO::Limit to protein coding genes
2024-12-19 14:38:42 INFO::focal id: intron_11_1887576_1922857|Artery_Tibial_sQTL
2024-12-19 14:38:42 INFO::focal molecular trait: LSP1,TNNT3 Artery_Tibial,Artery_Tibial sQTL,sQTL
2024-12-19 14:38:42 INFO::Range of locus: chr11:1194372-3642292
2024-12-19 14:38:42 INFO::focal molecular trait QTL positions:
2024-12-19 14:38:42 INFO::Limit PIPs to credible sets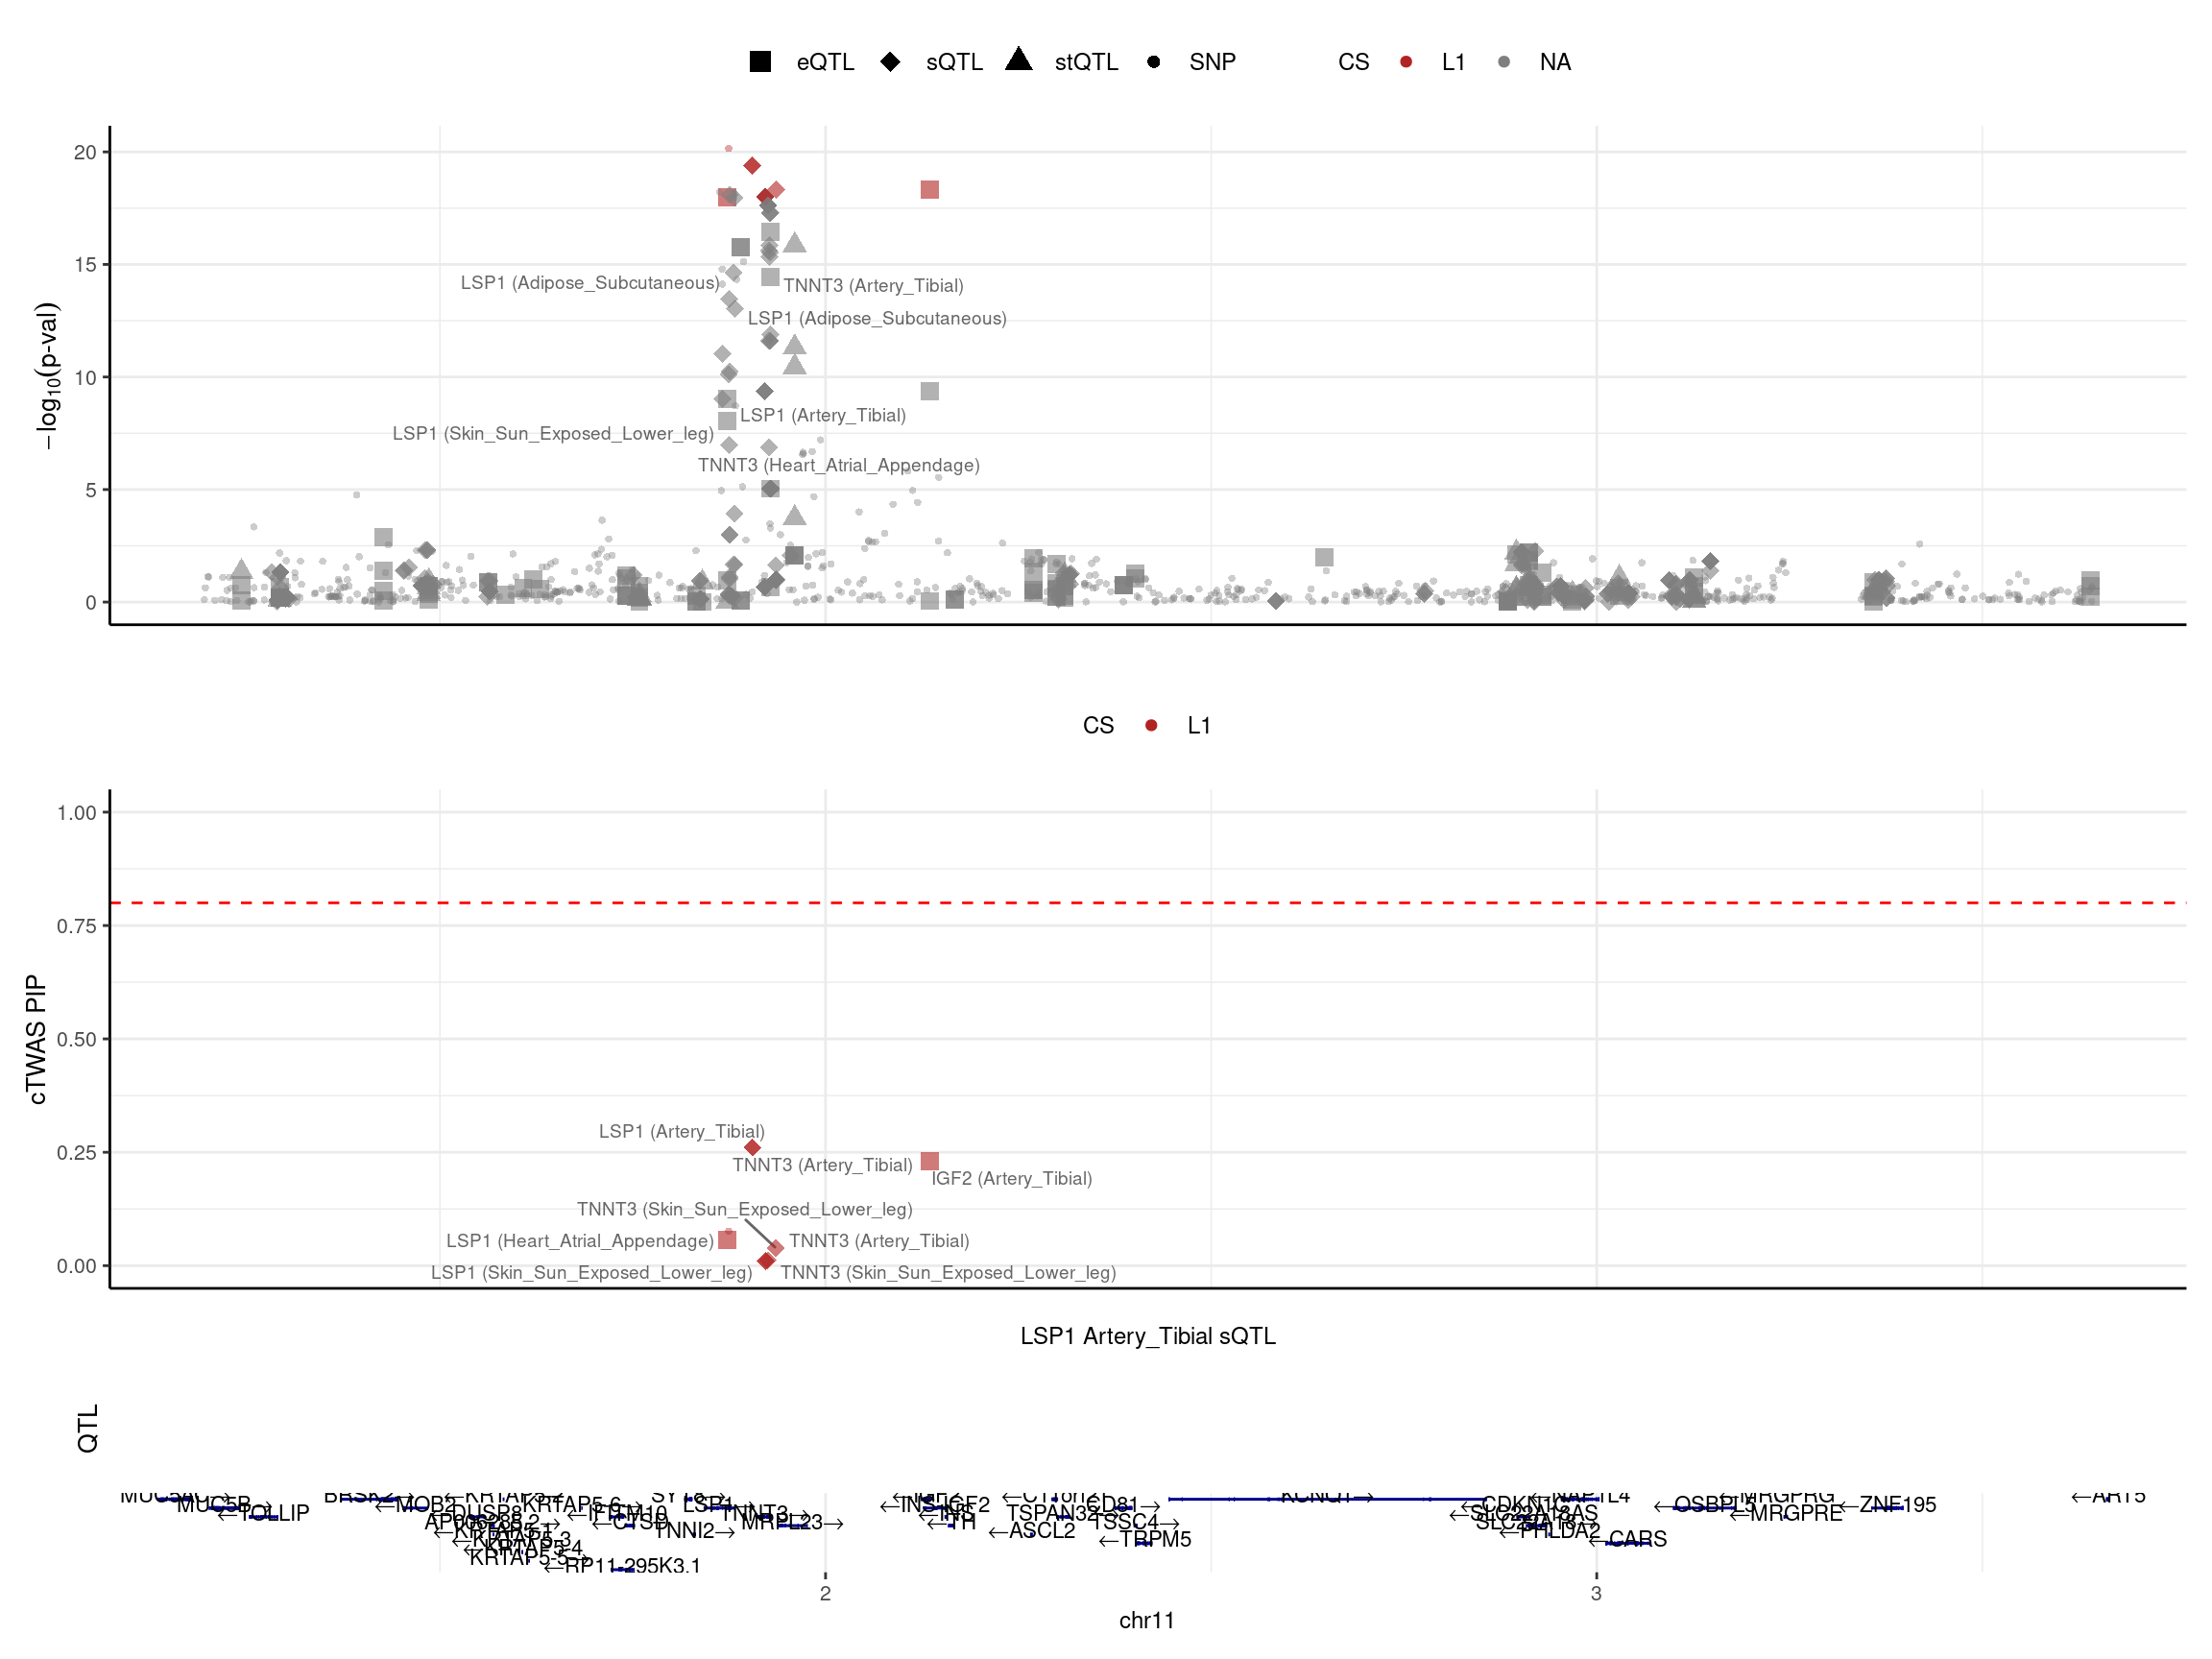
| Version | Author | Date |
|---|---|---|
| 65c1ad1 | XSun | 2024-12-19 |
print("locus plot -- LD mismatch: snp removed")[1] "locus plot -- LD mismatch: snp removed"make_locusplot(finemap_res_ldmm_removesnp,
region_id = region_id,
ens_db = ens_db,
weights = weights_updated,
highlight_pip = 0.8,
filter_protein_coding_genes = TRUE,
filter_cs = TRUE,
color_pval_by = "cs",
color_pip_by = "cs",panel.heights = c(4,4,1,1))2024-12-19 14:38:44 INFO::Limit to protein coding genes
2024-12-19 14:38:44 INFO::focal id: ENSG00000130592.15|Heart_Atrial_Appendage_eQTL
2024-12-19 14:38:44 INFO::focal molecular trait: LSP1 Heart_Atrial_Appendage eQTL
2024-12-19 14:38:44 INFO::Range of locus: chr11:1194372-3642292
2024-12-19 14:38:44 INFO::focal molecular trait QTL positions:
2024-12-19 14:38:44 INFO::Limit PIPs to credible sets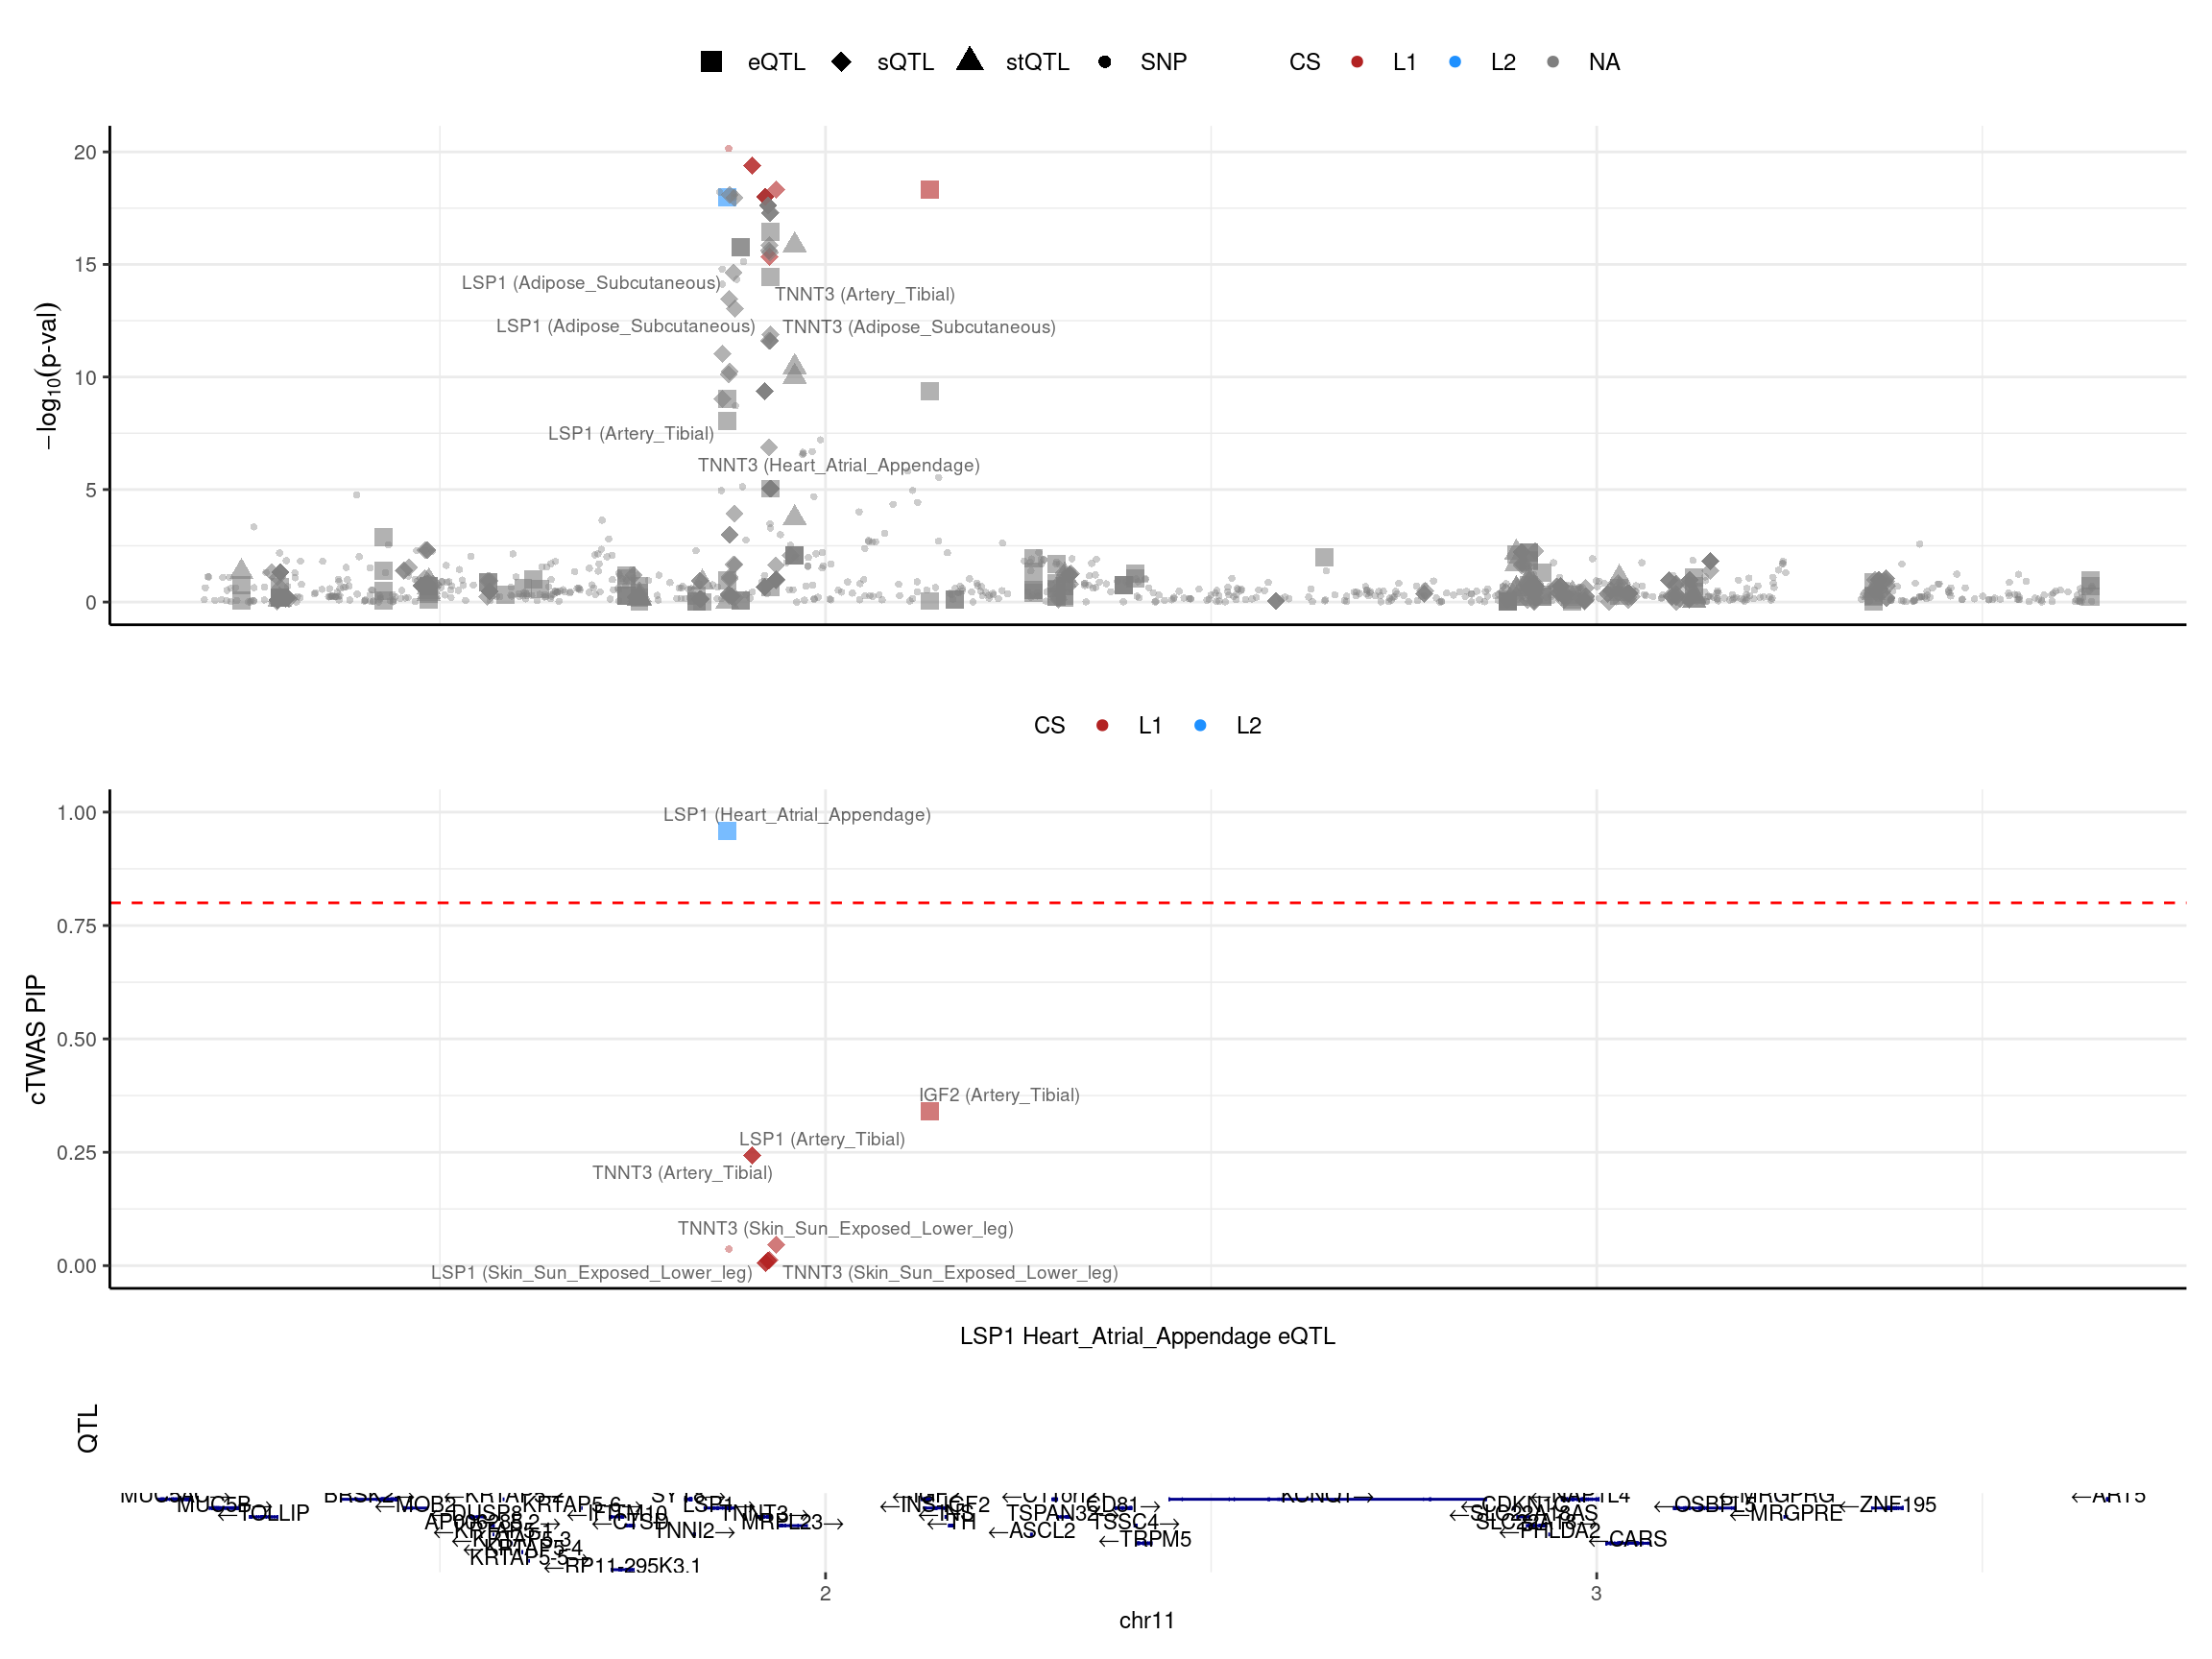
| Version | Author | Date |
|---|---|---|
| 65c1ad1 | XSun | 2024-12-19 |
finemap_res_rm_gene_region <- finemap_res_rm_gene[finemap_res_rm_gene$region_id == region_id,]
finemap_res_ldmm_removesnp_gene_region <- finemap_res_ldmm_removesnp_gene[finemap_res_ldmm_removesnp_gene$region_id == region_id,]
merged_region_gene <- merge(finemap_res_rm_gene_region,finemap_res_ldmm_removesnp_gene_region,by = "id",all.x=T)
merged_region_gene <- merged_region_gene[,c("id","gene_name.x","z.x","susie_pip.x","cs.x","z.y","susie_pip.y","cs.y")]
colnames(merged_region_gene) <- c("id","gene_name","z_regionmerge","susie_pip_regionmerge","cs_regionmerge","z_ldmismatch","susie_pip_ldmismatch","cs_ldmismatch")

merged_region_gene$highlight <- ifelse(merged_region_gene$id %in% problematic_genes, "problematic genes", "good genes")

merged_region_gene$z_ldmismatch[is.na(merged_region_gene$z_ldmismatch)] <- 10
print("The dots showing z_ldmismatch =10 means: these genes were removed since the only QTLs of them are problematic")
[1] "The dots showing z_ldmismatch =10 means: these genes were removed since the only QTLs of them are problematic"ggplot(data = merged_region_gene, aes(x= z_regionmerge, y= z_ldmismatch, color = highlight, alpha = highlight)) +
geom_point() +
scale_color_manual(values = c("problematic genes" = "red", "good genes" = "black")) +
scale_alpha_manual(values = c("problematic genes" = 1, "good genes" = 0.3)) +
ggtitle("Comparing z-scores before/after removing the problematic SNPs") +
theme_minimal()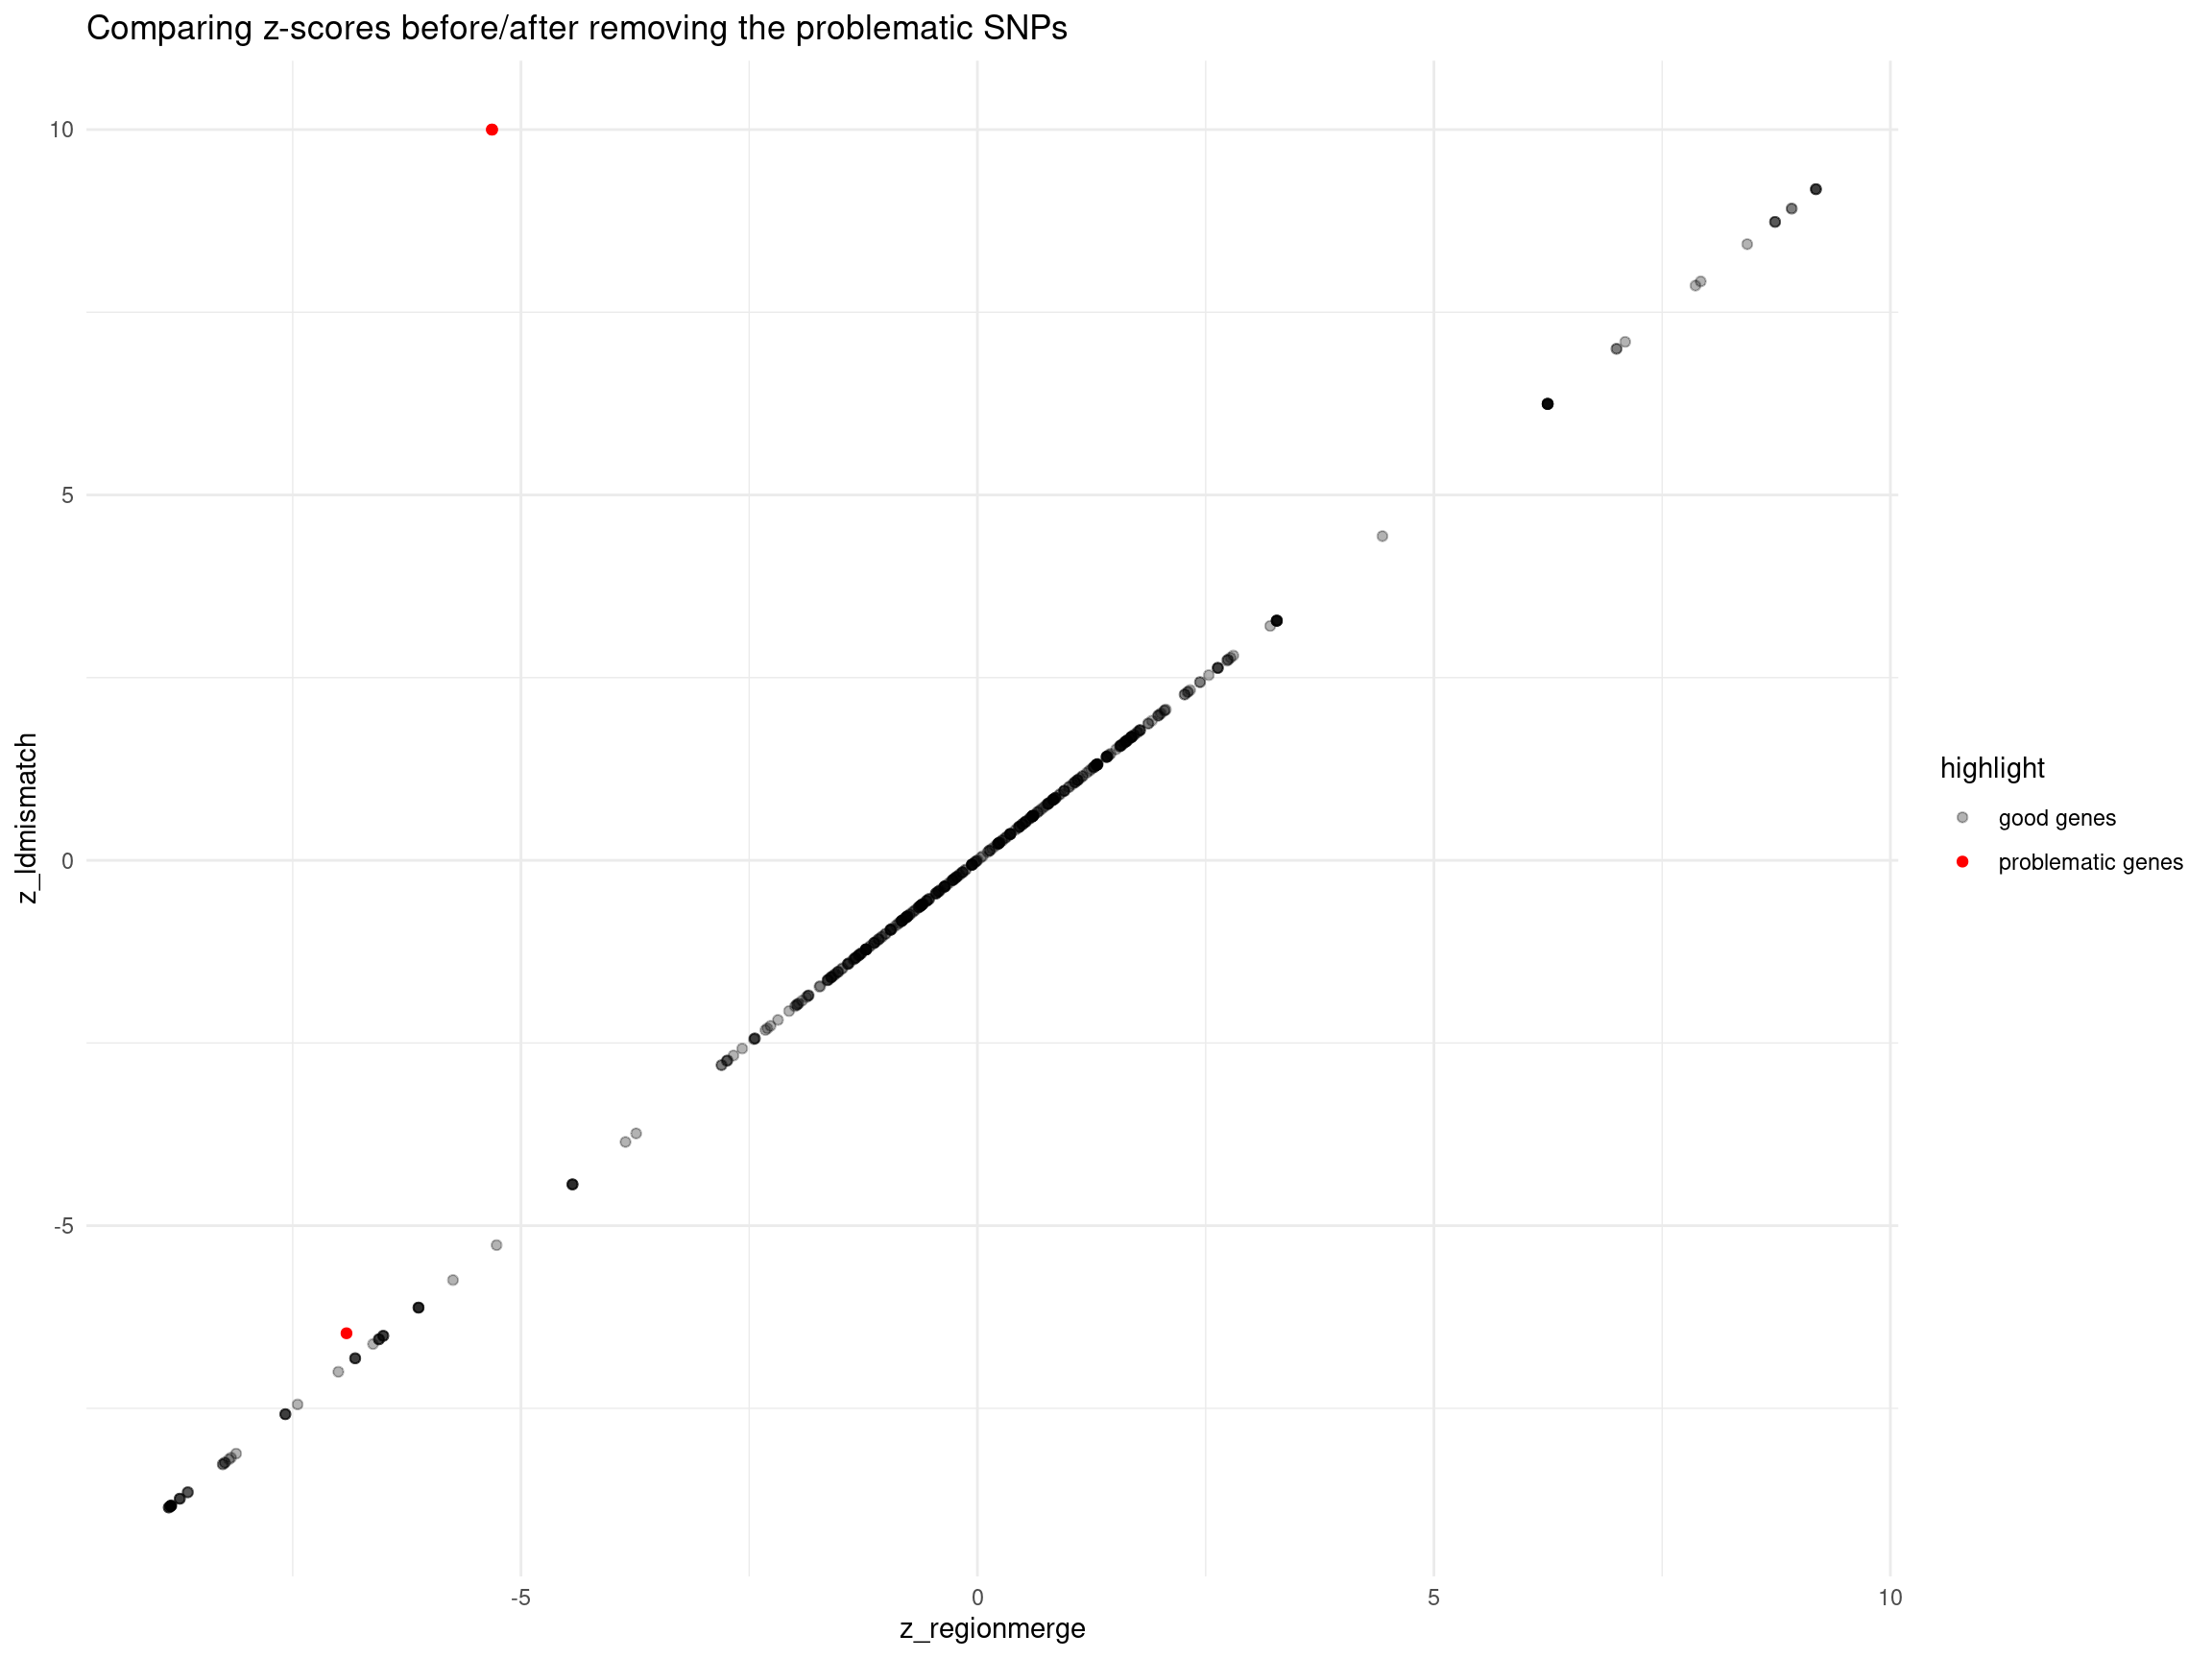
| Version | Author | Date |
|---|---|---|
| 65c1ad1 | XSun | 2024-12-19 |
DT::datatable(merged_region_gene[merged_region_gene$z_ldmismatch != merged_region_gene$z_regionmerge,],caption = htmltools::tags$caption( style = 'caption-side: left; text-align: left; color:black; font-size:150% ;','Genes with different z before / after removing the problematic SNPs'),options = list(pageLength = 10) )region_id <- "16_3951195_5068344"
print("locus plot -- after region merge")[1] "locus plot -- after region merge"make_locusplot(finemap_res_rm,
region_id = region_id,
ens_db = ens_db,
weights = weights_origin,
highlight_pip = 0.8,
filter_protein_coding_genes = TRUE,
filter_cs = TRUE,
color_pval_by = "cs",
color_pip_by = "cs",panel.heights = c(4,4,1,1))2024-12-19 14:38:46 INFO::Limit to protein coding genes
2024-12-19 14:38:46 INFO::focal id: ENSG00000168101.14|Adipose_Subcutaneous_eQTL
2024-12-19 14:38:46 INFO::focal molecular trait: NUDT16L1 Adipose_Subcutaneous eQTL
2024-12-19 14:38:46 INFO::Range of locus: chr16:3951797-5067946
2024-12-19 14:38:47 INFO::focal molecular trait QTL positions: 4700273
2024-12-19 14:38:47 INFO::Limit PIPs to credible sets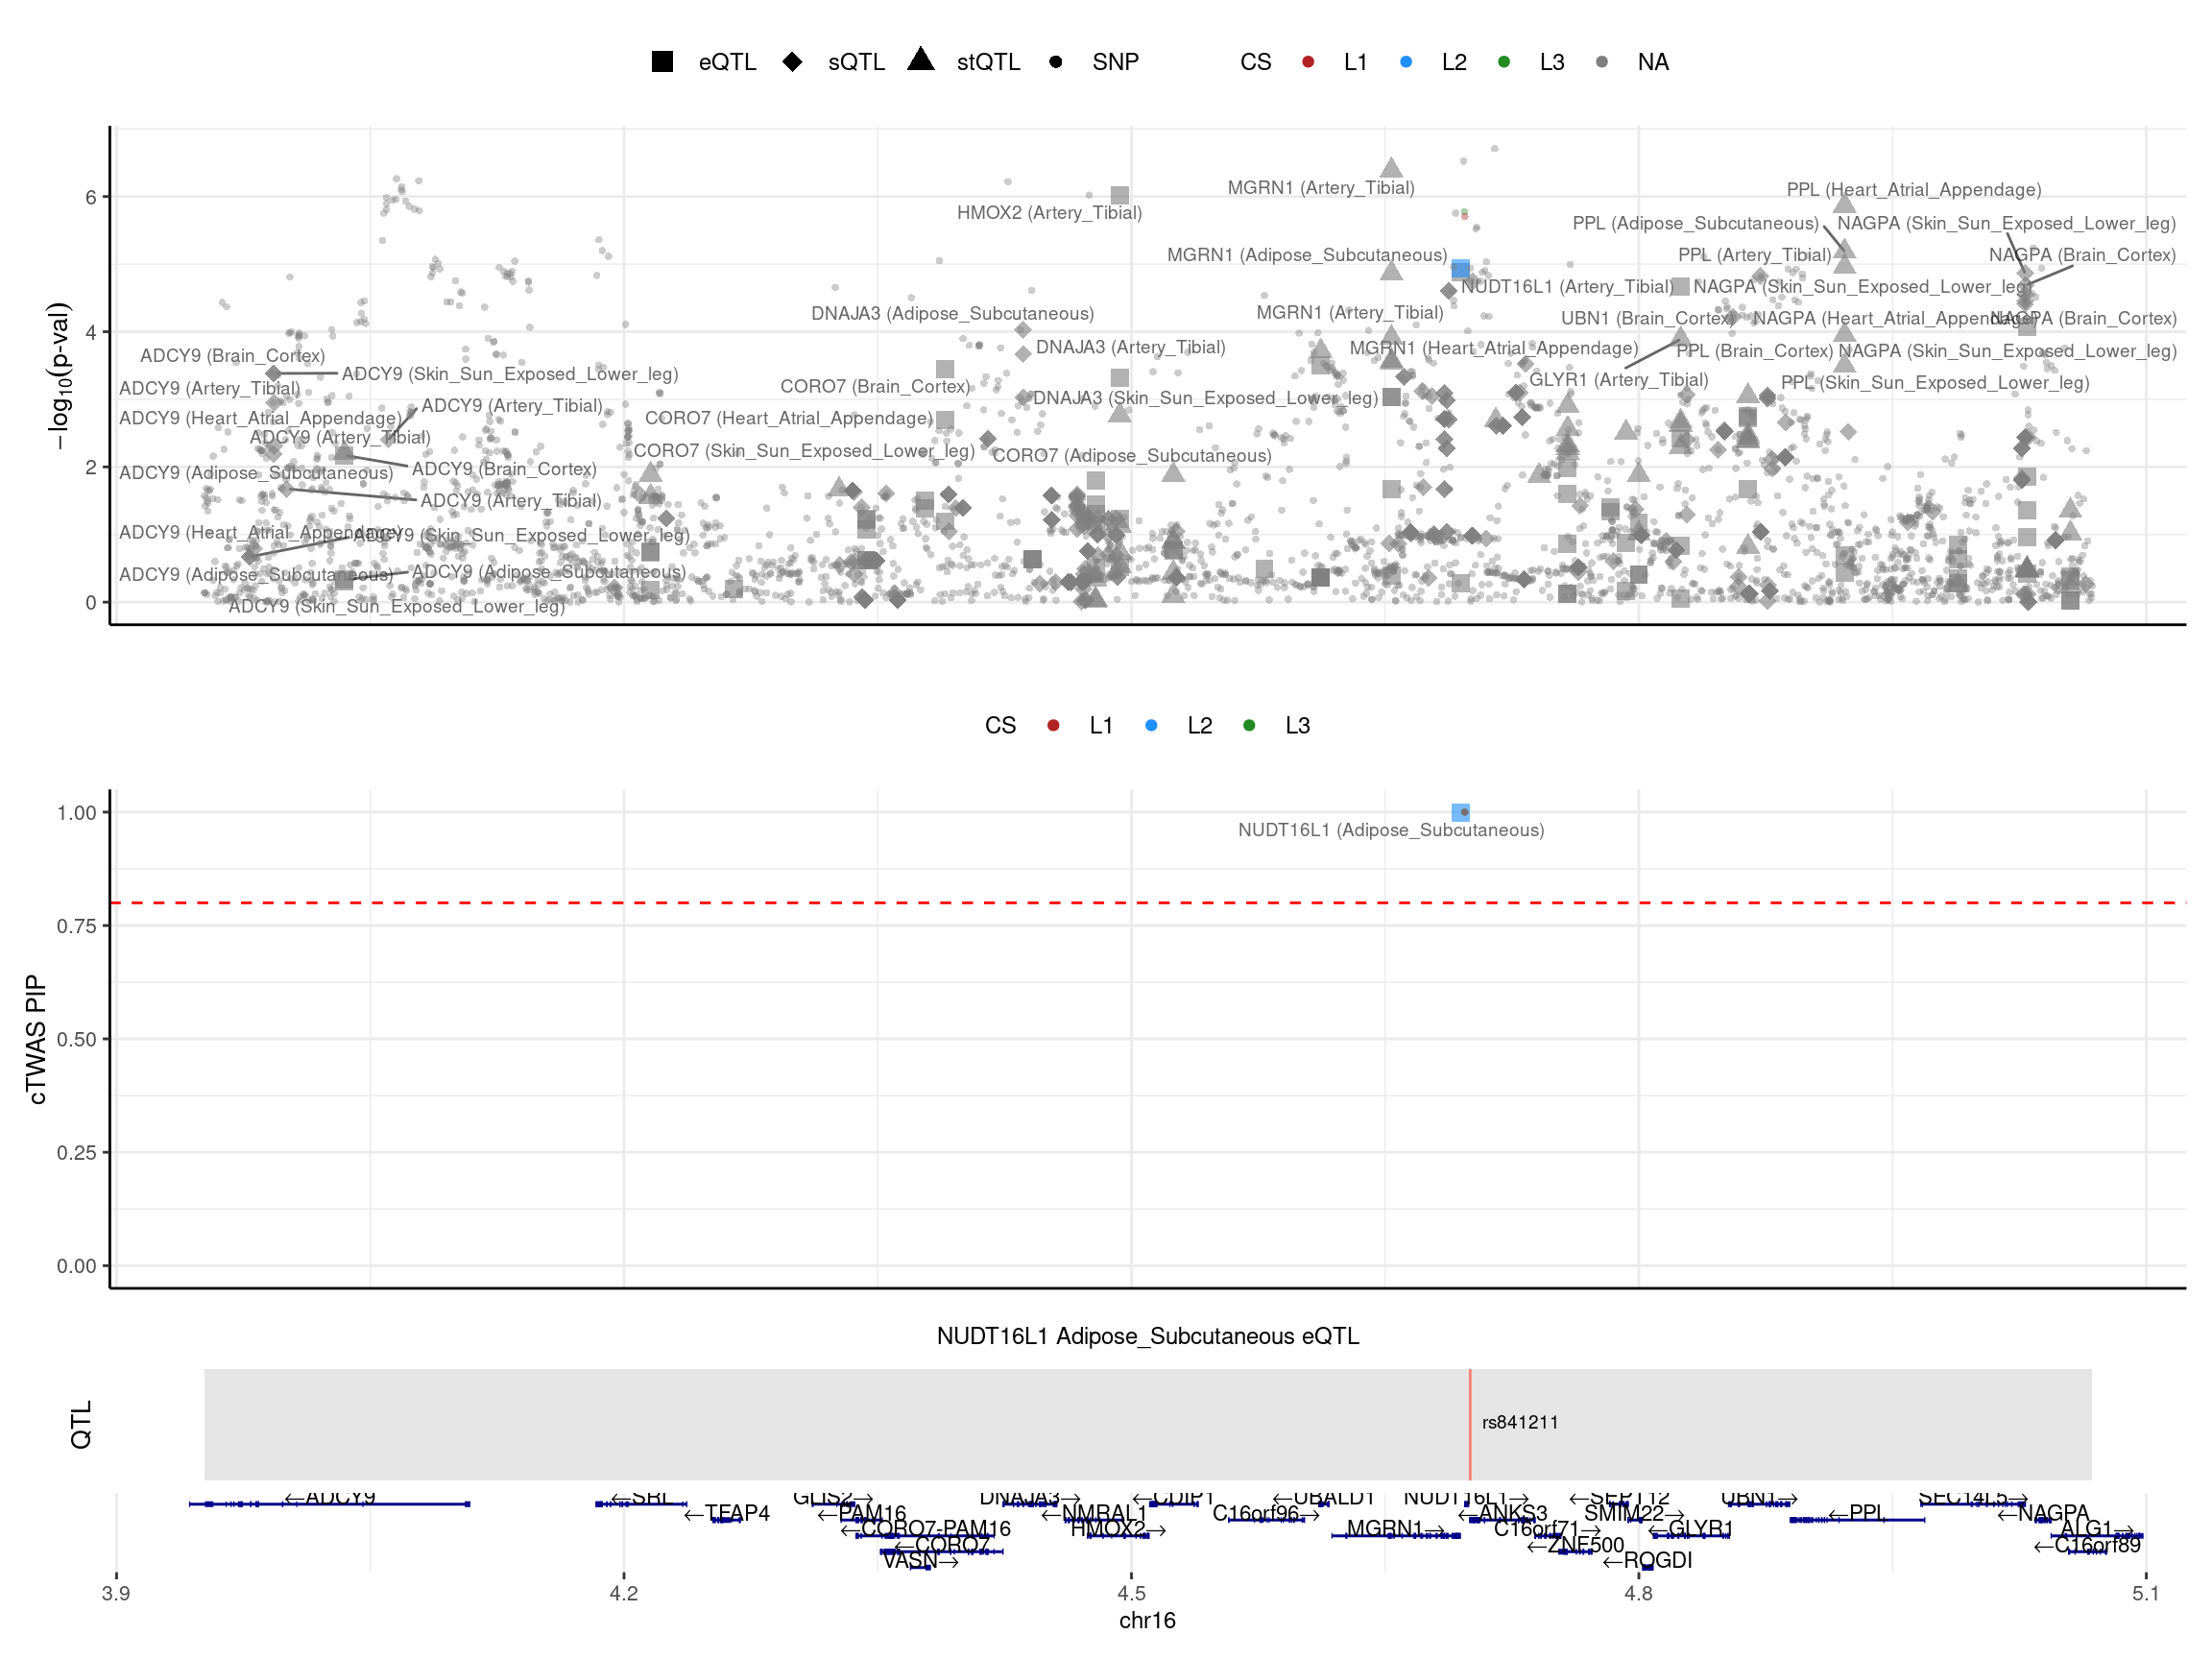
| Version | Author | Date |
|---|---|---|
| 65c1ad1 | XSun | 2024-12-19 |
print("locus plot -- LD mismatch: no LD")[1] "locus plot -- LD mismatch: no LD"make_locusplot(finemap_res_ldmm_nold,
region_id = region_id,
ens_db = ens_db,
weights = weights_origin,
highlight_pip = 0.8,
filter_protein_coding_genes = TRUE,
filter_cs = TRUE,
color_pval_by = "cs",
color_pip_by = "cs",panel.heights = c(4,4,1,1))2024-12-19 14:38:52 INFO::Limit to protein coding genes
2024-12-19 14:38:52 INFO::focal id: ENSG00000103415.11|Artery_Tibial_eQTL
2024-12-19 14:38:52 INFO::focal molecular trait: HMOX2 Artery_Tibial eQTL
2024-12-19 14:38:52 INFO::Range of locus: chr16:3951921-5065327
2024-12-19 14:38:52 INFO::focal molecular trait QTL positions:
2024-12-19 14:38:52 INFO::Limit PIPs to credible sets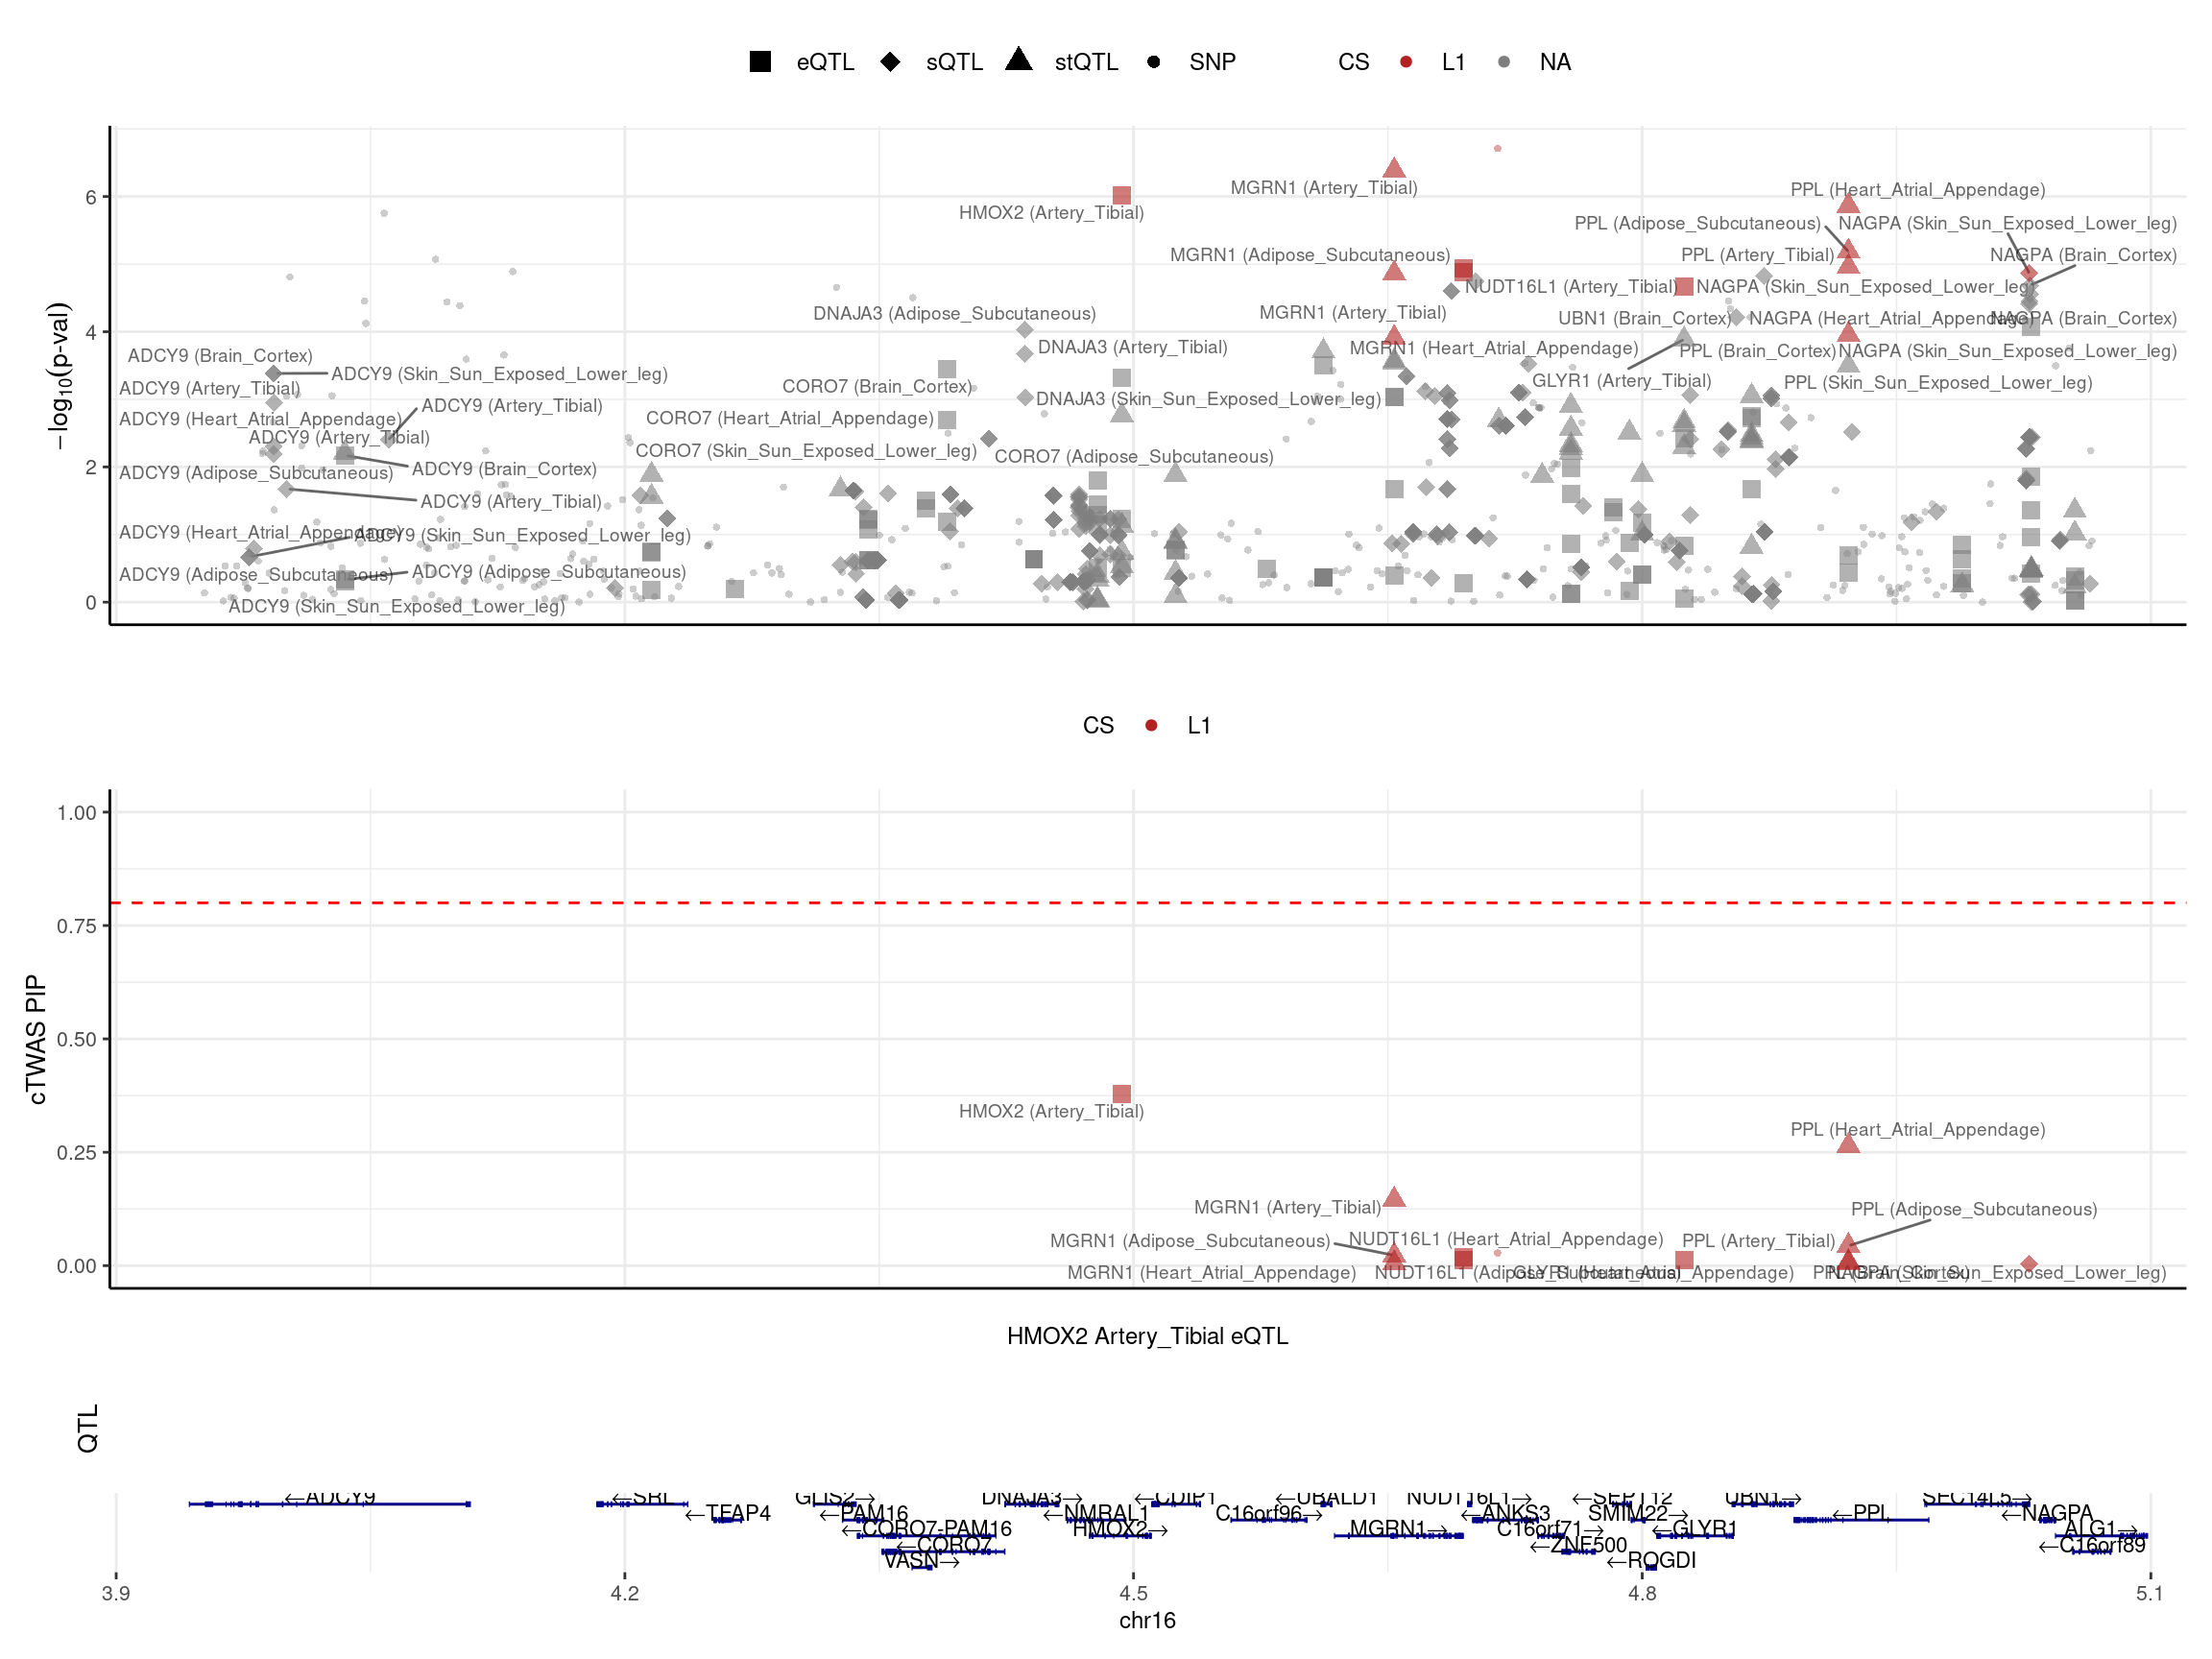
| Version | Author | Date |
|---|---|---|
| 65c1ad1 | XSun | 2024-12-19 |
print("locus plot -- LD mismatch: snp removed")[1] "locus plot -- LD mismatch: snp removed"make_locusplot(finemap_res_ldmm_removesnp,
region_id = region_id,
ens_db = ens_db,
weights = weights_updated,
highlight_pip = 0.8,
filter_protein_coding_genes = TRUE,
filter_cs = TRUE,
color_pval_by = "cs",
color_pip_by = "cs",panel.heights = c(4,4,1,1))2024-12-19 14:38:54 INFO::Limit to protein coding genes
2024-12-19 14:38:54 INFO::focal id: ENSG00000103415.11|Artery_Tibial_eQTL
2024-12-19 14:38:54 INFO::focal molecular trait: HMOX2 Artery_Tibial eQTL
2024-12-19 14:38:54 INFO::Range of locus: chr16:3951921-5065327
2024-12-19 14:38:54 INFO::focal molecular trait QTL positions:
2024-12-19 14:38:54 INFO::Limit PIPs to credible sets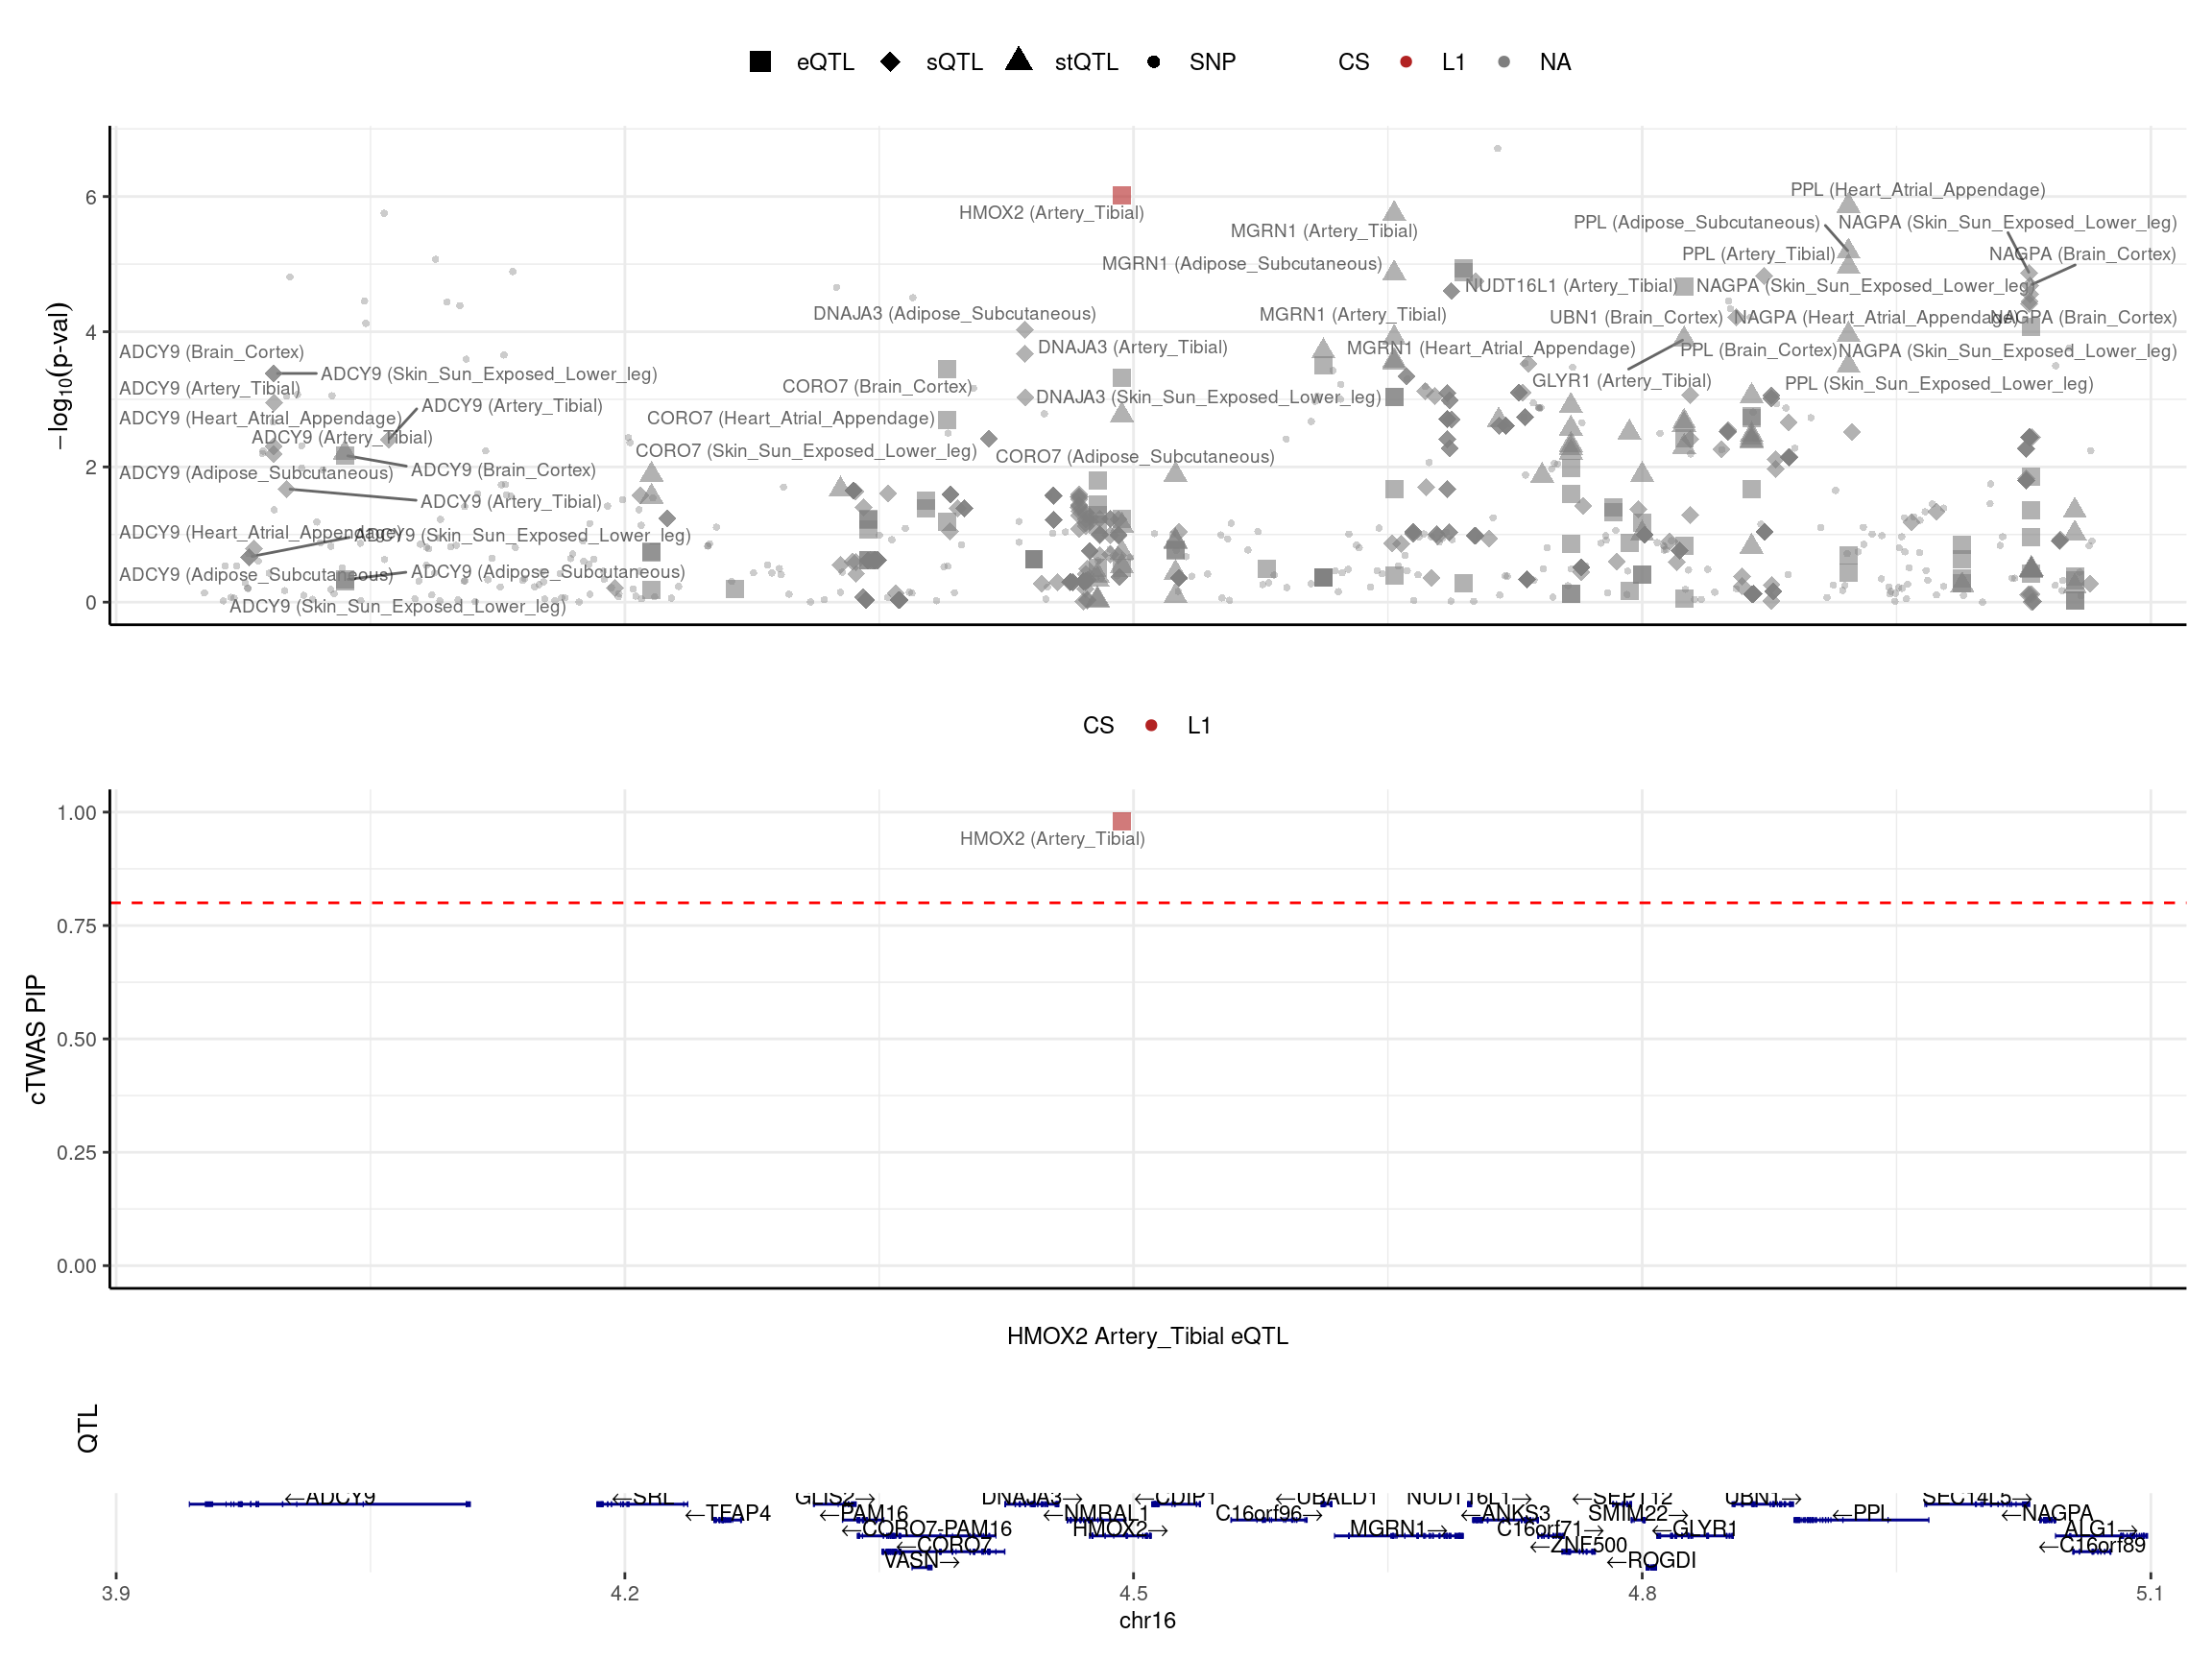
| Version | Author | Date |
|---|---|---|
| 65c1ad1 | XSun | 2024-12-19 |
finemap_res_rm_gene_region <- finemap_res_rm_gene[finemap_res_rm_gene$region_id == region_id,]
finemap_res_ldmm_removesnp_gene_region <- finemap_res_ldmm_removesnp_gene[finemap_res_ldmm_removesnp_gene$region_id == region_id,]
merged_region_gene <- merge(finemap_res_rm_gene_region,finemap_res_ldmm_removesnp_gene_region,by = "id",all.x=T)
merged_region_gene <- merged_region_gene[,c("id","gene_name.x","z.x","susie_pip.x","cs.x","z.y","susie_pip.y","cs.y")]
colnames(merged_region_gene) <- c("id","gene_name","z_regionmerge","susie_pip_regionmerge","cs_regionmerge","z_ldmismatch","susie_pip_ldmismatch","cs_ldmismatch")

merged_region_gene$highlight <- ifelse(merged_region_gene$id %in% problematic_genes, "problematic genes", "good genes")

merged_region_gene$z_ldmismatch[is.na(merged_region_gene$z_ldmismatch)] <- 10
print("The dots showing z_ldmismatch =10 means: these genes were removed since the only QTLs of them are problematic")
[1] "The dots showing z_ldmismatch =10 means: these genes were removed since the only QTLs of them are problematic"ggplot(data = merged_region_gene, aes(x= z_regionmerge, y= z_ldmismatch, color = highlight, alpha = highlight)) +
geom_point() +
scale_color_manual(values = c("problematic genes" = "red", "good genes" = "black")) +
scale_alpha_manual(values = c("problematic genes" = 1, "good genes" = 0.3)) +
ggtitle("Comparing z-scores before/after removing the problematic SNPs") +
theme_minimal()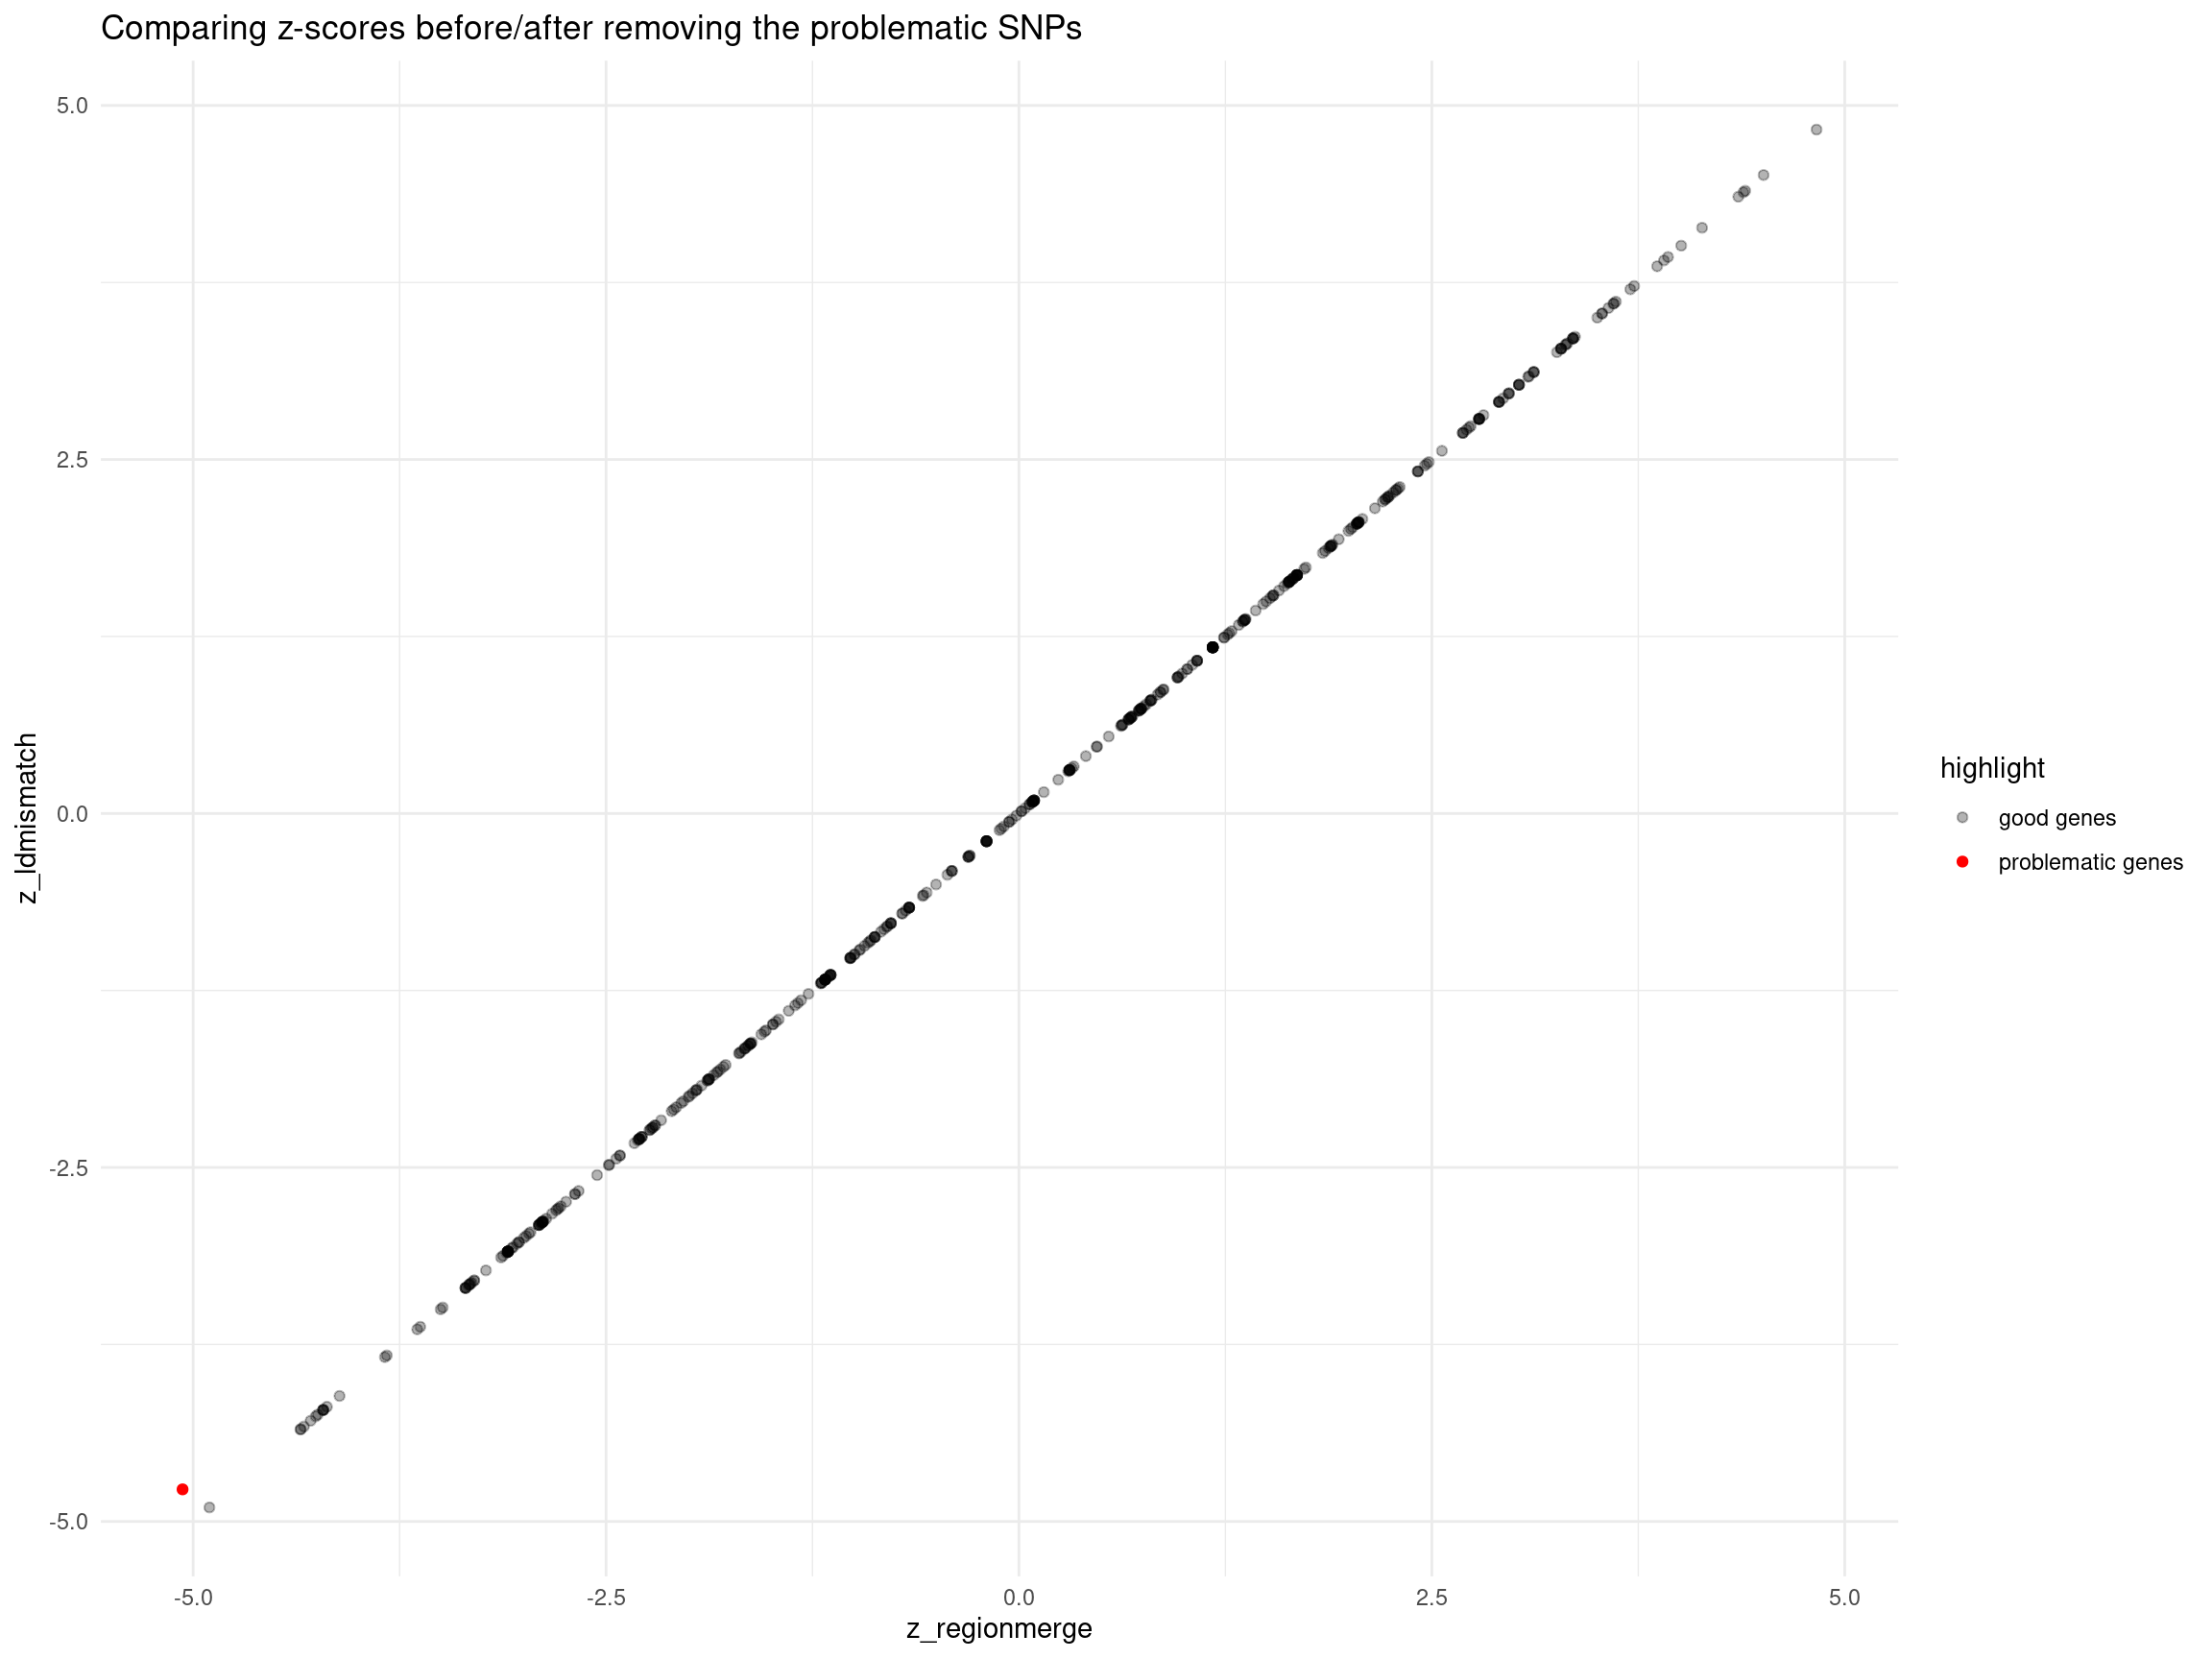
| Version | Author | Date |
|---|---|---|
| 65c1ad1 | XSun | 2024-12-19 |
DT::datatable(merged_region_gene[merged_region_gene$z_ldmismatch != merged_region_gene$z_regionmerge,],caption = htmltools::tags$caption( style = 'caption-side: left; text-align: left; color:black; font-size:150% ;','Genes with different z before / after removing the problematic SNPs'),options = list(pageLength = 10) )SCZ-ieu-b-5102
trait <- "SCZ-ieu-b-5102"

results_dir_origin <- paste0("/project/xinhe/xsun/multi_group_ctwas/11.multi_group_1008/results/",trait,"/")
ctwas_res_origin <- readRDS(paste0(results_dir_origin,trait,".ctwas.res.RDS"))

finemap_res_origin <- ctwas_res_origin$finemap_res
Region merge
load(paste0("/project/xinhe/xsun/multi_group_ctwas/11.multi_group_1008/post_process_rm_ld/rm_",trait,".rdata"))

finemap_res_rm <- res_regionmerge$finemap_res
finemap_res_rm_boundary_genes <- finemap_res_rm[finemap_res_rm$id %in%selected_boundary_genes$id,]
finemap_res_rm_boundary_genes_pip <- finemap_res_rm_boundary_genes[,c("id","susie_pip","cs")]


finemap_res_origin_boundary_genes <- finemap_res_origin[finemap_res_origin$id %in%selected_boundary_genes$id,]
finemap_res_origin_boundary_genes_pip <- finemap_res_origin_boundary_genes[,c("id","susie_pip","cs")]

finemap_res_compare_regionmerge <- merge(finemap_res_origin_boundary_genes_pip,finemap_res_rm_boundary_genes_pip, by = "id")
colnames(finemap_res_compare_regionmerge) <- c("id","susie_pip_origin","cs_origin","susie_pip_reginmerge","cs_reginmerge")

DT::datatable(finemap_res_compare_regionmerge,caption = htmltools::tags$caption( style = 'caption-side: left; text-align: left; color:black;  font-size:150% ;','Selected boundary genes (susie_pip > 0.5)'),options = list(pageLength = 10) )
LD-mismatch
Diagnosis
file_pipthreshold02 <- paste0("/project/xinhe/xsun/multi_group_ctwas/11.multi_group_1008/post_process_rm_ld/ldmismatch_diagnosis_pipthres02_", trait, ".rdata")

load(file_pipthreshold02)
pip_02 <- data.frame(
  "PIP Threshold" = "0.2",
  "Number of Selected Regions" = length(selected_region_ids),
  "Number of Problematic Genes" = length(problematic_genes),
  "Number of Problematic Regions" = length(problematic_region_ids),
  "Number of Problematic SNPs" = length(res_ldmismatch$problematic_snps),
  "Number of Flipped SNPs" = length(res_ldmismatch$flipped_snps)
)


file_pipthreshold05 <- paste0("/project/xinhe/xsun/multi_group_ctwas/11.multi_group_1008/post_process_rm_ld/ldmismatch_diagnosis_pipthres05_", trait, ".rdata")

load(file_pipthreshold05)
pip_05 <- data.frame(
  "PIP Threshold" = "0.5",
  "Number of Selected Regions" = length(selected_region_ids),
  "Number of Problematic Genes" = length(problematic_genes),
  "Number of Problematic Regions" = length(problematic_region_ids),
  "Number of Problematic SNPs" = length(res_ldmismatch$problematic_snps),
  "Number of Flipped SNPs" = length(res_ldmismatch$flipped_snps)
)

results_table <- rbind(pip_02, pip_05)

DT::datatable(results_table,caption = htmltools::tags$caption( style = 'caption-side: left; text-align: left; color:black;  font-size:150% ;','LD mismatch diagnosis table for different gene cutoff'),options = list(pageLength = 10) )
Comparing 2 LD mismatch fixing methods
load(paste0("/project/xinhe/xsun/multi_group_ctwas/11.multi_group_1008/post_process_rm_ld/ldmismatch_pipthres05_nold_",trait,".rdata"))
finemap_res_ldmm_nold <- res_ldmm_nold$finemap_res
load(paste0("/project/xinhe/xsun/multi_group_ctwas/11.multi_group_1008/post_process_rm_ld/ldmismatch_pipthres02_removesnp_",trait,".rdata"))
finemap_res_ldmm_removesnp <- res_ldmm_removesnp$finemap_res

finemap_res_ldmm_nold_problematic_gene <- finemap_res_ldmm_nold[finemap_res_ldmm_nold$region_id %in% problematic_region_ids & finemap_res_ldmm_nold$type != "SNP",]
finemap_res_ldmm_removesnp_problematic_gene <- finemap_res_ldmm_removesnp[finemap_res_ldmm_removesnp$region_id %in% problematic_region_ids & finemap_res_ldmm_removesnp$type != "SNP",]

merge_2method <- merge(finemap_res_ldmm_nold_problematic_gene,finemap_res_ldmm_removesnp_problematic_gene, by ="id",all.x=T)
merge_2method$highlight <- ifelse(merge_2method$id %in% problematic_genes, "problematic genes", "good genes")
merge_2method$susie_pip.y[is.na(merge_2method$susie_pip.y)] <- 1.5
p1 <- ggplot(data = merge_2method, aes(x = susie_pip.x, y = susie_pip.y, color = highlight, alpha = highlight)) +
  geom_point() +
  scale_color_manual(values = c("problematic genes" = "red", "good genes" = "black")) +
  scale_alpha_manual(values = c("problematic genes" = 1, "good genes" = 0.1)) +
  labs(x = "PIP_noLD", y = "PIP_removesnp") +
  geom_abline(slope = 1, intercept = 0, col = "red") +
  ggtitle("Problematic regions only, genes only") +
  theme_minimal()

finemap_res_rm_problematic_gene <- finemap_res_rm[finemap_res_rm$region_id %in% problematic_region_ids & finemap_res_rm$type != "SNP",]

merge_rm_ldmm_nold <-  merge(finemap_res_rm_problematic_gene,finemap_res_ldmm_nold_problematic_gene, by ="id",all.x=T)
merge_rm_ldmm_nold$highlight <- ifelse(merge_rm_ldmm_nold$id %in% problematic_genes, "problematic genes", "good genes")
merge_rm_ldmm_nold$susie_pip.y[is.na(merge_rm_ldmm_nold$susie_pip.y)] <- 1.5
p2 <- ggplot(data = merge_rm_ldmm_nold, aes(x= susie_pip.x, y= susie_pip.y, color = highlight, alpha = highlight)) +
  geom_point() +
  labs(x="PIP_after_regionmerge", y="PIP_noLD") +
  scale_color_manual(values = c("problematic genes" = "red", "good genes" = "black")) +
  scale_alpha_manual(values = c("problematic genes" = 1, "good genes" = 0.1)) +
  geom_abline(slope = 1, intercept = 0, col ="red") +
  ggtitle("problematic regions only, genes only") +
  theme_minimal()

merge_rm_ldmm_removesnp <-  merge(finemap_res_rm_problematic_gene,finemap_res_ldmm_removesnp_problematic_gene, by ="id",all.x =T)
merge_rm_ldmm_removesnp$highlight <- ifelse(merge_rm_ldmm_removesnp$id %in% problematic_genes, "problematic genes", "good genes")
merge_rm_ldmm_removesnp$susie_pip.y[is.na(merge_rm_ldmm_removesnp$susie_pip.y)] <- 1.5
p3 <- ggplot(data = merge_rm_ldmm_removesnp, aes(x= susie_pip.x, y= susie_pip.y, color = highlight, alpha = highlight)) +
  geom_point() +
  labs(x="PIP_after_regionmerge", y="PIP_removesnp") +
  scale_alpha_manual(values = c("problematic genes" = 1, "good genes" = 0.1)) +
  scale_color_manual(values = c("problematic genes" = "red", "good genes" = "black")) +
  geom_abline(slope = 1, intercept = 0, col ="red") +
  ggtitle("problematic regions only, genes only") +
  theme_minimal()
print(sprintf("Total number of molecular traits in problematic regions = %s",nrow(merge_rm_ldmm_removesnp)))
[1] "Total number of molecular traits in problematic regions = 1670"print(sprintf("Number of molecular traits disappeared after removing prblematic SNPs = %s", sum(merge_rm_ldmm_removesnp$susie_pip.y == 1.5)))[1] "Number of molecular traits disappeared after removing prblematic SNPs = 0"finemap_res_rm_problematic_gene$highlight <- ifelse(finemap_res_rm_problematic_gene$id %in% problematic_genes, "problematic genes", "good genes")
print(sprintf("The number of problematic genes with PIP < 0.01 = %s",sum(finemap_res_rm_problematic_gene$highlight == "problematic genes" & finemap_res_rm_problematic_gene$susie_pip < 0.01)))[1] "The number of problematic genes with PIP < 0.01 = 7"print("The dots showing PIP =1.5 means: these genes were removed since the only QTLs of them are problematic")[1] "The dots showing PIP =1.5 means: these genes were removed since the only QTLs of them are problematic"grid.arrange(p1,p2,p3, ncol = 3)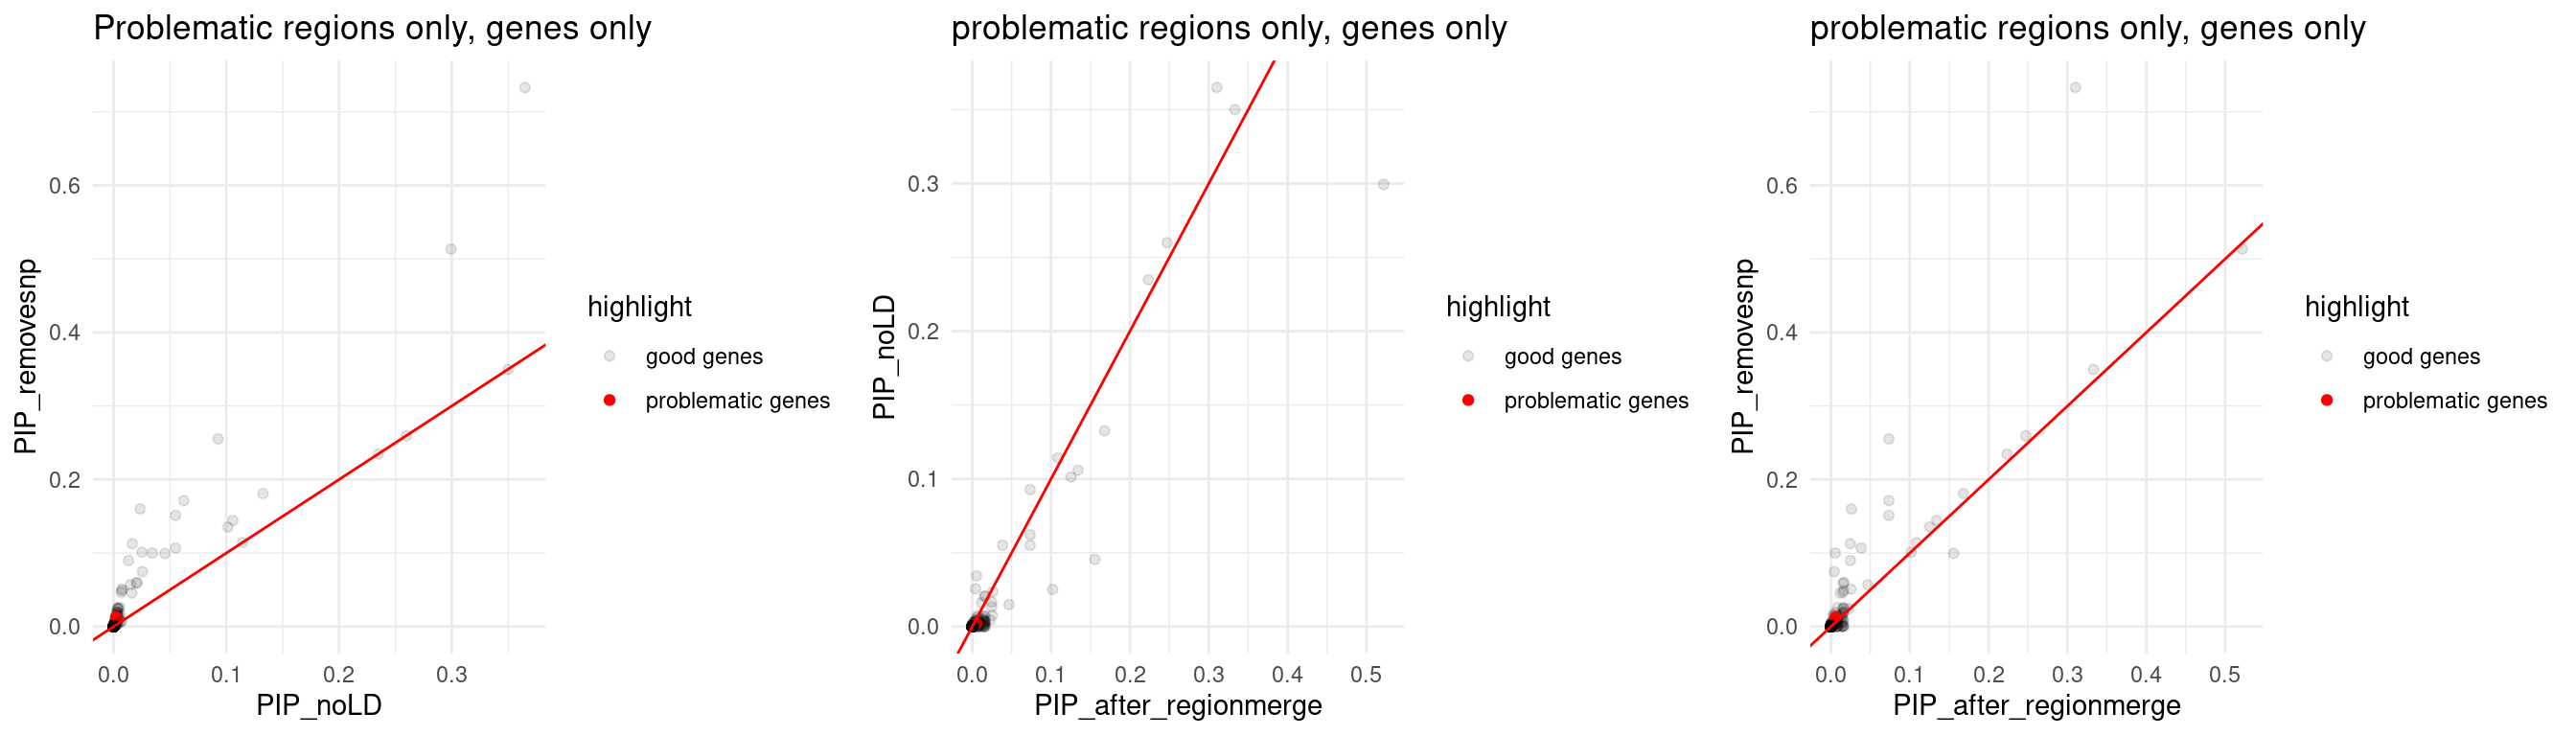
| Version | Author | Date |
|---|---|---|
| 65c1ad1 | XSun | 2024-12-19 |
Comparing z-scores and susie_pip
finemap_res_origin <- ctwas_res_origin$finemap_res
finemap_res_origin_gene <- finemap_res_origin[finemap_res_origin$type != "SNP",]
finemap_res_origin_gene$highlight <- ifelse(finemap_res_origin_gene$id %in% problematic_genes, "problematic genes", "good genes")

p1 <- ggplot(data = finemap_res_origin_gene, aes(x= abs(z), y= susie_pip, color = highlight)) +
  geom_point() +
  scale_color_manual(values = c("problematic genes" = "red", "good genes" = "black")) +
  ggtitle("Original ctwas results") +
  theme_minimal()


finemap_res_rm_gene <- finemap_res_rm[finemap_res_rm$type != "SNP",]
finemap_res_rm_gene$highlight <- ifelse(finemap_res_rm_gene$id %in% problematic_genes, "problematic genes", "good genes")

p2 <- ggplot(data = finemap_res_rm_gene, aes(x= abs(z), y= susie_pip, color = highlight)) +
  geom_point() +
  scale_color_manual(values = c("problematic genes" = "red", "good genes" = "black")) +
  ggtitle("After region merge") +
  theme_minimal()


finemap_res_ldmm_nold_gene <- finemap_res_ldmm_nold[finemap_res_ldmm_nold$type !="SNP",]
finemap_res_ldmm_nold_gene$highlight <- ifelse(finemap_res_ldmm_nold_gene$id %in% problematic_genes, "problematic genes", "good genes")

p3 <- ggplot(data = finemap_res_ldmm_nold_gene, aes(x= abs(z), y= susie_pip, color = highlight)) +
  geom_point() +
  scale_color_manual(values = c("problematic genes" = "red", "good genes" = "black")) +
  ggtitle("After LD mismatch fixed -- noLD") +
  theme_minimal()

finemap_res_ldmm_removesnp_gene <- finemap_res_ldmm_removesnp[finemap_res_ldmm_removesnp$type !="SNP",]
finemap_res_ldmm_removesnp_gene$highlight <- ifelse(finemap_res_ldmm_removesnp_gene$id %in% problematic_genes, "problematic genes", "good genes")

p4 <- ggplot(data = finemap_res_ldmm_removesnp_gene, aes(x= abs(z), y= susie_pip, color = highlight)) +
  geom_point() +
  scale_color_manual(values = c("problematic genes" = "red", "good genes" = "black")) +
  ggtitle("After LD mismatch fixed -- SNP removed") +
  theme_minimal()


grid.arrange(p1,p2,p3,p4, ncol = 4)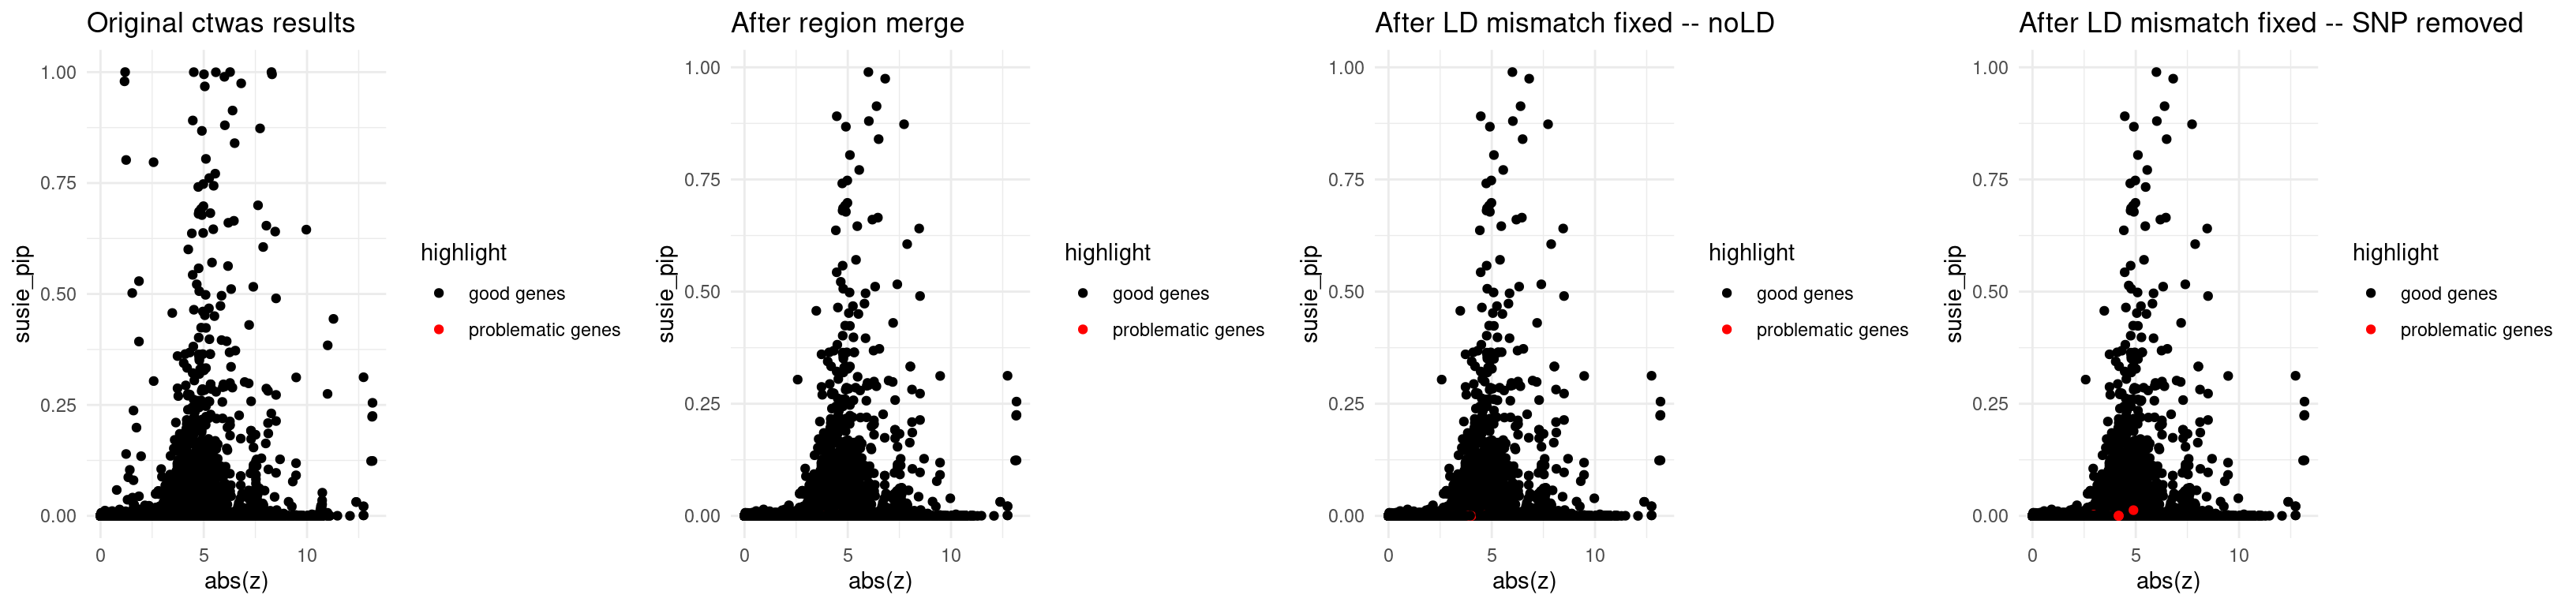
| Version | Author | Date |
|---|---|---|
| 65c1ad1 | XSun | 2024-12-19 |
print("L - estimated in region merge step")[1] "L - estimated in region merge step"print(updated_data_res_regionmerge$updated_region_L[problematic_region_ids]) 1_27075376_29689034 2_47985862_49795119 11_62456299_66131160
2 1 3 load(paste0("/project/xinhe/xsun/multi_group_ctwas/11.multi_group_1008/post_process_rm_ld/ldmismatch_pipthres05_removesnp_rescreenregion_",trait,".rdata"))
print("L - re-estimated after updating z_scores, region data")[1] "L - re-estimated after updating z_scores, region data"print(screen_res$screened_region_L) 1_27075376_29689034 2_47985862_49795119 11_62456299_66131160
2 1 3 print("Zoom in the z<15 part")[1] "Zoom in the z<15 part"finemap_res_origin_gene_prob <- finemap_res_origin_gene[finemap_res_origin_gene$highlight == "problematic genes",]
p1 <- ggplot(data = finemap_res_origin_gene_prob,
aes(x = abs(z), y = susie_pip, color = highlight, alpha = highlight)) +
geom_point() +
scale_color_manual(values = c("problematic genes" = "red", "good genes" = "black")) +
scale_alpha_manual(values = c("problematic genes" = 1, "good genes" = 0.01)) +
ggtitle("Original ctwas results") +
theme_minimal() +
xlim(0, 15)
finemap_res_rm_gene_prob <- finemap_res_rm_gene[finemap_res_rm_gene$highlight == "problematic genes",]
p2 <- ggplot(data = finemap_res_rm_gene_prob,
aes(x = abs(z), y = susie_pip, color = highlight, alpha = highlight)) +
geom_point() +
scale_color_manual(values = c("problematic genes" = "red", "good genes" = "black")) +
scale_alpha_manual(values = c("problematic genes" = 1, "good genes" = 0.01)) +
ggtitle("After region merge") +
theme_minimal() +
xlim(0, 15)
finemap_res_ldmm_nold_gene_prob <- finemap_res_ldmm_nold_gene[finemap_res_ldmm_nold_gene$highlight == "problematic genes",]
p3 <- ggplot(data = finemap_res_ldmm_nold_gene_prob,
aes(x = abs(z), y = susie_pip, color = highlight, alpha = highlight)) +
geom_point() +
scale_color_manual(values = c("problematic genes" = "red", "good genes" = "black")) +
scale_alpha_manual(values = c("problematic genes" = 1, "good genes" = 0.01)) +
ggtitle("After LD mismatch fixed -- noLD") +
theme_minimal() +
xlim(0, 15)
finemap_res_ldmm_removesnp_gene_prob <- finemap_res_ldmm_removesnp_gene[finemap_res_ldmm_removesnp_gene$highlight == "problematic genes",]
p4 <- ggplot(data = finemap_res_ldmm_removesnp_gene_prob,
aes(x = abs(z), y = susie_pip, color = highlight, alpha = highlight)) +
geom_point() +
scale_color_manual(values = c("problematic genes" = "red", "good genes" = "black")) +
scale_alpha_manual(values = c("problematic genes" = 1, "good genes" = 0.01)) +
ggtitle("After LD mismatch fixed -- SNP removed") +
theme_minimal() +
xlim(0, 15)
grid.arrange(p1,p2,p3,p4, ncol = 4)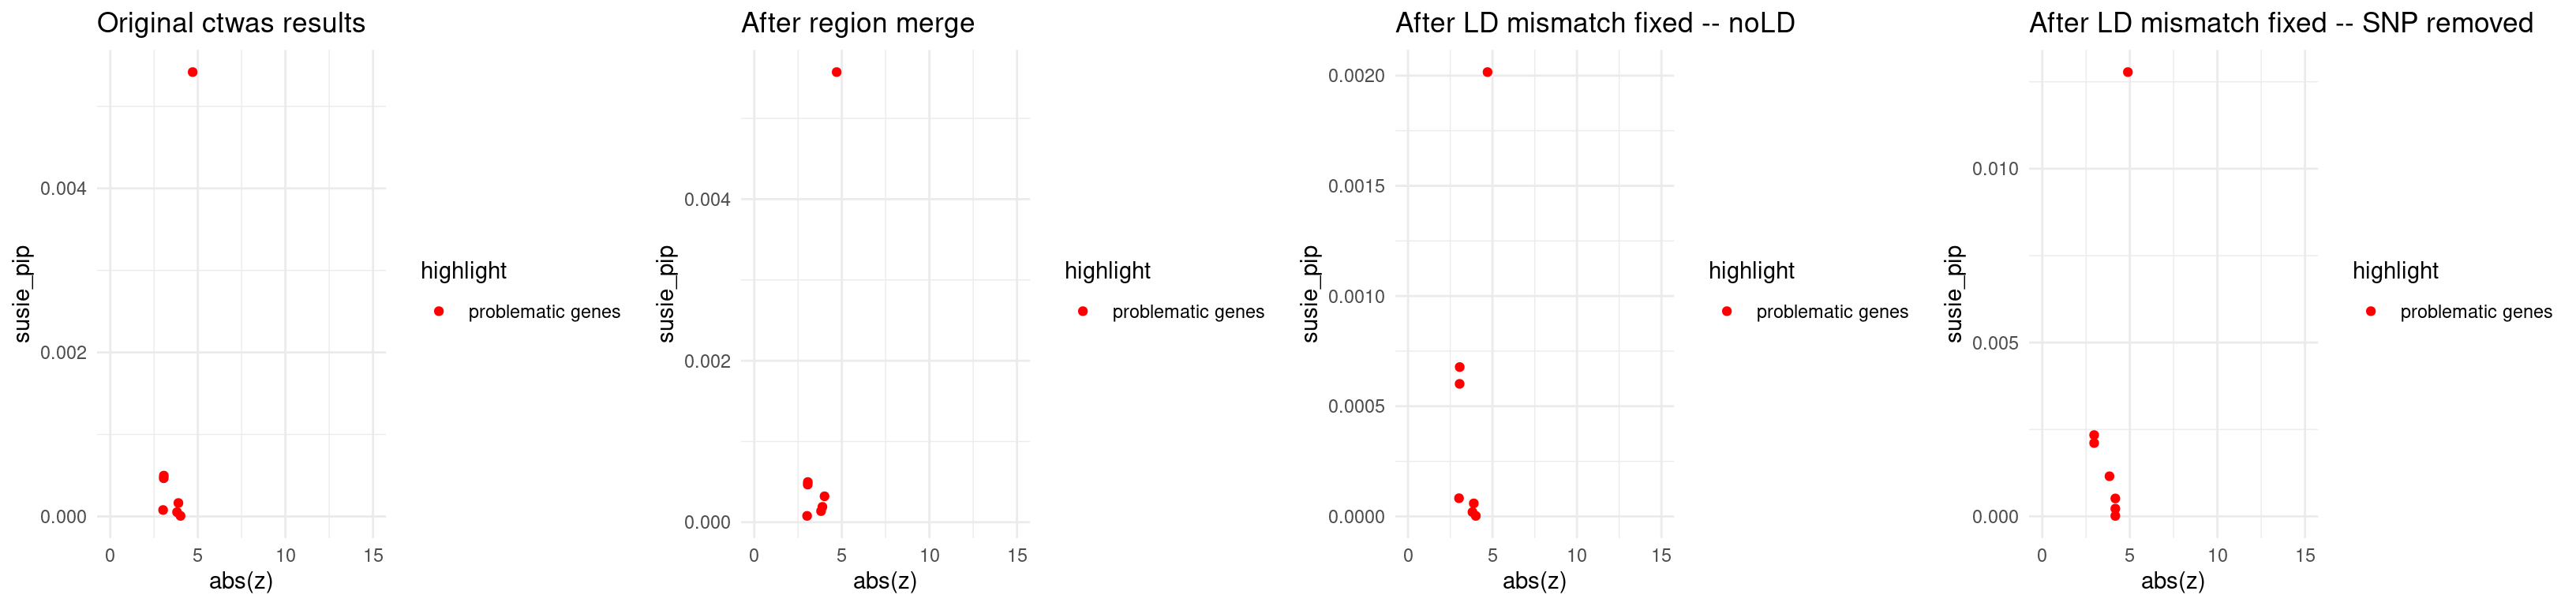
| Version | Author | Date |
|---|---|---|
| 65c1ad1 | XSun | 2024-12-19 |
WBC-ieu-b-30
trait <- "WBC-ieu-b-30"

results_dir_origin <- paste0("/project/xinhe/xsun/multi_group_ctwas/11.multi_group_1008/results/",trait,"/")
ctwas_res_origin <- readRDS(paste0(results_dir_origin,trait,".ctwas.res.RDS"))

finemap_res_origin <- ctwas_res_origin$finemap_res
Region merge
load(paste0("/project/xinhe/xsun/multi_group_ctwas/11.multi_group_1008/post_process_rm_ld/rm_",trait,".rdata"))

finemap_res_rm <- res_regionmerge$finemap_res
finemap_res_rm_boundary_genes <- finemap_res_rm[finemap_res_rm$id %in%selected_boundary_genes$id,]
finemap_res_rm_boundary_genes_pip <- finemap_res_rm_boundary_genes[,c("id","susie_pip","cs")]


finemap_res_origin_boundary_genes <- finemap_res_origin[finemap_res_origin$id %in%selected_boundary_genes$id,]
finemap_res_origin_boundary_genes_pip <- finemap_res_origin_boundary_genes[,c("id","susie_pip","cs")]

finemap_res_compare_regionmerge <- merge(finemap_res_origin_boundary_genes_pip,finemap_res_rm_boundary_genes_pip, by = "id")
colnames(finemap_res_compare_regionmerge) <- c("id","susie_pip_origin","cs_origin","susie_pip_reginmerge","cs_reginmerge")

DT::datatable(finemap_res_compare_regionmerge,caption = htmltools::tags$caption( style = 'caption-side: left; text-align: left; color:black;  font-size:150% ;','Selected boundary genes (susie_pip > 0.5)'),options = list(pageLength = 10) )
LD-mismatch
Diagnosis
file_pipthreshold02 <- paste0("/project/xinhe/xsun/multi_group_ctwas/11.multi_group_1008/post_process_rm_ld/ldmismatch_diagnosis_pipthres02_", trait, ".rdata")

load(file_pipthreshold02)
pip_02 <- data.frame(
  "PIP Threshold" = "0.2",
  "Number of Selected Regions" = length(selected_region_ids),
  "Number of Problematic Genes" = length(problematic_genes),
  "Number of Problematic Regions" = length(problematic_region_ids),
  "Number of Problematic SNPs" = length(res_ldmismatch$problematic_snps),
  "Number of Flipped SNPs" = length(res_ldmismatch$flipped_snps)
)


file_pipthreshold05 <- paste0("/project/xinhe/xsun/multi_group_ctwas/11.multi_group_1008/post_process_rm_ld/ldmismatch_diagnosis_pipthres05_", trait, ".rdata")

load(file_pipthreshold05)
pip_05 <- data.frame(
  "PIP Threshold" = "0.5",
  "Number of Selected Regions" = length(selected_region_ids),
  "Number of Problematic Genes" = length(problematic_genes),
  "Number of Problematic Regions" = length(problematic_region_ids),
  "Number of Problematic SNPs" = length(res_ldmismatch$problematic_snps),
  "Number of Flipped SNPs" = length(res_ldmismatch$flipped_snps)
)

results_table <- rbind(pip_02, pip_05)

DT::datatable(results_table,caption = htmltools::tags$caption( style = 'caption-side: left; text-align: left; color:black;  font-size:150% ;','LD mismatch diagnosis table for different gene cutoff'),options = list(pageLength = 10) )
Comparing 2 LD mismatch fixing methods
load(paste0("/project/xinhe/xsun/multi_group_ctwas/11.multi_group_1008/post_process_rm_ld/ldmismatch_pipthres05_nold_",trait,".rdata"))
finemap_res_ldmm_nold <- res_ldmm_nold$finemap_res
load(paste0("/project/xinhe/xsun/multi_group_ctwas/11.multi_group_1008/post_process_rm_ld/ldmismatch_pipthres02_removesnp_",trait,".rdata"))
finemap_res_ldmm_removesnp <- res_ldmm_removesnp$finemap_res

finemap_res_ldmm_nold_problematic_gene <- finemap_res_ldmm_nold[finemap_res_ldmm_nold$region_id %in% problematic_region_ids & finemap_res_ldmm_nold$type != "SNP",]
finemap_res_ldmm_removesnp_problematic_gene <- finemap_res_ldmm_removesnp[finemap_res_ldmm_removesnp$region_id %in% problematic_region_ids & finemap_res_ldmm_removesnp$type != "SNP",]

merge_2method <- merge(finemap_res_ldmm_nold_problematic_gene,finemap_res_ldmm_removesnp_problematic_gene, by ="id",all.x=T)
merge_2method$highlight <- ifelse(merge_2method$id %in% problematic_genes, "problematic genes", "good genes")
merge_2method$susie_pip.y[is.na(merge_2method$susie_pip.y)] <- 1.5
p1 <- ggplot(data = merge_2method, aes(x = susie_pip.x, y = susie_pip.y, color = highlight, alpha = highlight)) +
  geom_point() +
  scale_color_manual(values = c("problematic genes" = "red", "good genes" = "black")) +
  scale_alpha_manual(values = c("problematic genes" = 1, "good genes" = 0.1)) +
  labs(x = "PIP_noLD", y = "PIP_removesnp") +
  geom_abline(slope = 1, intercept = 0, col = "red") +
  ggtitle("Problematic regions only, genes only") +
  theme_minimal()

finemap_res_rm_problematic_gene <- finemap_res_rm[finemap_res_rm$region_id %in% problematic_region_ids & finemap_res_rm$type != "SNP",]

merge_rm_ldmm_nold <-  merge(finemap_res_rm_problematic_gene,finemap_res_ldmm_nold_problematic_gene, by ="id",all.x=T)
merge_rm_ldmm_nold$highlight <- ifelse(merge_rm_ldmm_nold$id %in% problematic_genes, "problematic genes", "good genes")
merge_rm_ldmm_nold$susie_pip.y[is.na(merge_rm_ldmm_nold$susie_pip.y)] <- 1.5
p2 <- ggplot(data = merge_rm_ldmm_nold, aes(x= susie_pip.x, y= susie_pip.y, color = highlight, alpha = highlight)) +
  geom_point() +
  labs(x="PIP_after_regionmerge", y="PIP_noLD") +
  scale_color_manual(values = c("problematic genes" = "red", "good genes" = "black")) +
  scale_alpha_manual(values = c("problematic genes" = 1, "good genes" = 0.1)) +
  geom_abline(slope = 1, intercept = 0, col ="red") +
  ggtitle("problematic regions only, genes only") +
  theme_minimal()

merge_rm_ldmm_removesnp <-  merge(finemap_res_rm_problematic_gene,finemap_res_ldmm_removesnp_problematic_gene, by ="id",all.x =T)
merge_rm_ldmm_removesnp$highlight <- ifelse(merge_rm_ldmm_removesnp$id %in% problematic_genes, "problematic genes", "good genes")
merge_rm_ldmm_removesnp$susie_pip.y[is.na(merge_rm_ldmm_removesnp$susie_pip.y)] <- 1.5
p3 <- ggplot(data = merge_rm_ldmm_removesnp, aes(x= susie_pip.x, y= susie_pip.y, color = highlight, alpha = highlight)) +
  geom_point() +
  labs(x="PIP_after_regionmerge", y="PIP_removesnp") +
  scale_alpha_manual(values = c("problematic genes" = 1, "good genes" = 0.1)) +
  scale_color_manual(values = c("problematic genes" = "red", "good genes" = "black")) +
  geom_abline(slope = 1, intercept = 0, col ="red") +
  ggtitle("problematic regions only, genes only") +
  theme_minimal()
print(sprintf("Total number of molecular traits in problematic regions = %s",nrow(merge_rm_ldmm_removesnp)))
[1] "Total number of molecular traits in problematic regions = 7811"print(sprintf("Number of molecular traits disappeared after removing prblematic SNPs = %s", sum(merge_rm_ldmm_removesnp$susie_pip.y == 1.5)))[1] "Number of molecular traits disappeared after removing prblematic SNPs = 9"finemap_res_rm_problematic_gene$highlight <- ifelse(finemap_res_rm_problematic_gene$id %in% problematic_genes, "problematic genes", "good genes")
print(sprintf("The number of problematic genes with PIP < 0.01 = %s",sum(finemap_res_rm_problematic_gene$highlight == "problematic genes" & finemap_res_rm_problematic_gene$susie_pip < 0.01)))[1] "The number of problematic genes with PIP < 0.01 = 33"print("The dots showing PIP =1.5 means: these genes were removed since the only QTLs of them are problematic")[1] "The dots showing PIP =1.5 means: these genes were removed since the only QTLs of them are problematic"grid.arrange(p1,p2,p3, ncol = 3)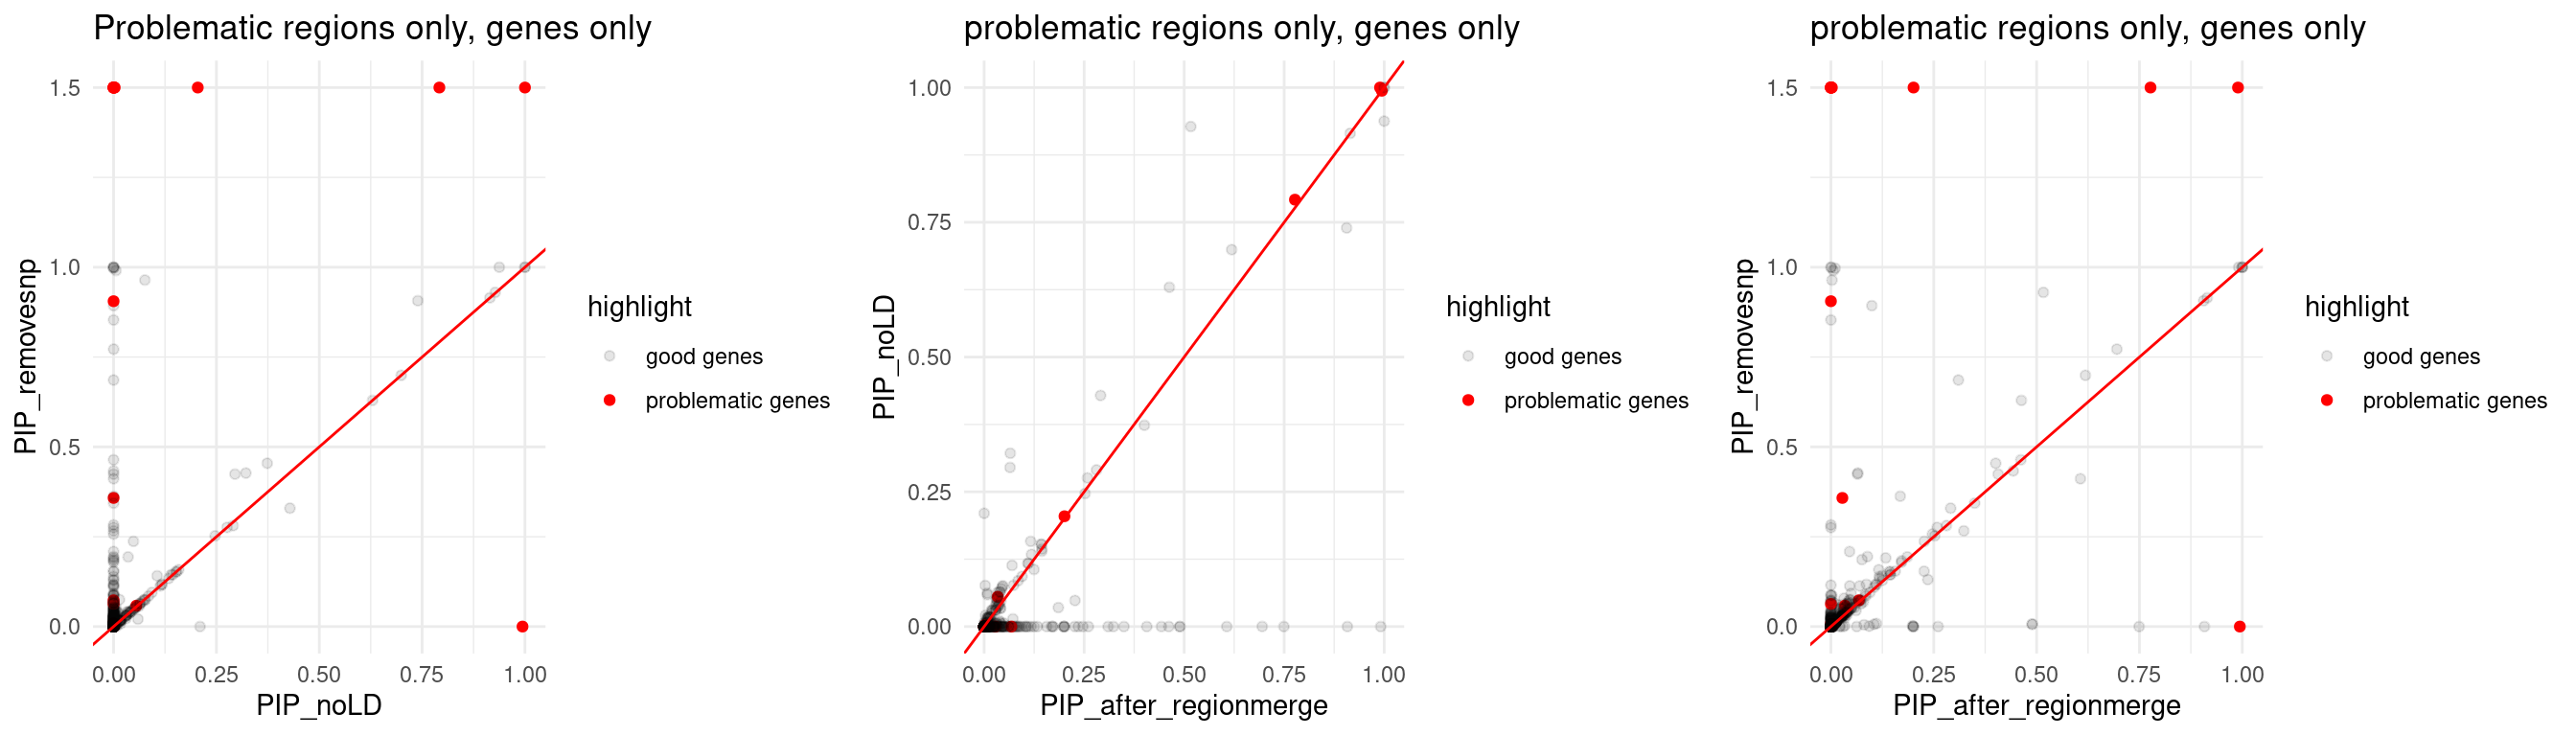
| Version | Author | Date |
|---|---|---|
| 65c1ad1 | XSun | 2024-12-19 |
Comparing z-scores and susie_pip
finemap_res_origin <- ctwas_res_origin$finemap_res
finemap_res_origin_gene <- finemap_res_origin[finemap_res_origin$type != "SNP",]
finemap_res_origin_gene$highlight <- ifelse(finemap_res_origin_gene$id %in% problematic_genes, "problematic genes", "good genes")

p1 <- ggplot(data = finemap_res_origin_gene, aes(x= abs(z), y= susie_pip, color = highlight)) +
  geom_point() +
  scale_color_manual(values = c("problematic genes" = "red", "good genes" = "black")) +
  ggtitle("Original ctwas results") +
  theme_minimal()


finemap_res_rm_gene <- finemap_res_rm[finemap_res_rm$type != "SNP",]
finemap_res_rm_gene$highlight <- ifelse(finemap_res_rm_gene$id %in% problematic_genes, "problematic genes", "good genes")

p2 <- ggplot(data = finemap_res_rm_gene, aes(x= abs(z), y= susie_pip, color = highlight)) +
  geom_point() +
  scale_color_manual(values = c("problematic genes" = "red", "good genes" = "black")) +
  ggtitle("After region merge") +
  theme_minimal()


finemap_res_ldmm_nold_gene <- finemap_res_ldmm_nold[finemap_res_ldmm_nold$type !="SNP",]
finemap_res_ldmm_nold_gene$highlight <- ifelse(finemap_res_ldmm_nold_gene$id %in% problematic_genes, "problematic genes", "good genes")

p3 <- ggplot(data = finemap_res_ldmm_nold_gene, aes(x= abs(z), y= susie_pip, color = highlight)) +
  geom_point() +
  scale_color_manual(values = c("problematic genes" = "red", "good genes" = "black")) +
  ggtitle("After LD mismatch fixed -- noLD") +
  theme_minimal()

finemap_res_ldmm_removesnp_gene <- finemap_res_ldmm_removesnp[finemap_res_ldmm_removesnp$type !="SNP",]
finemap_res_ldmm_removesnp_gene$highlight <- ifelse(finemap_res_ldmm_removesnp_gene$id %in% problematic_genes, "problematic genes", "good genes")

p4 <- ggplot(data = finemap_res_ldmm_removesnp_gene, aes(x= abs(z), y= susie_pip, color = highlight)) +
  geom_point() +
  scale_color_manual(values = c("problematic genes" = "red", "good genes" = "black")) +
  ggtitle("After LD mismatch fixed -- SNP removed") +
  theme_minimal()


grid.arrange(p1,p2,p3,p4, ncol = 4)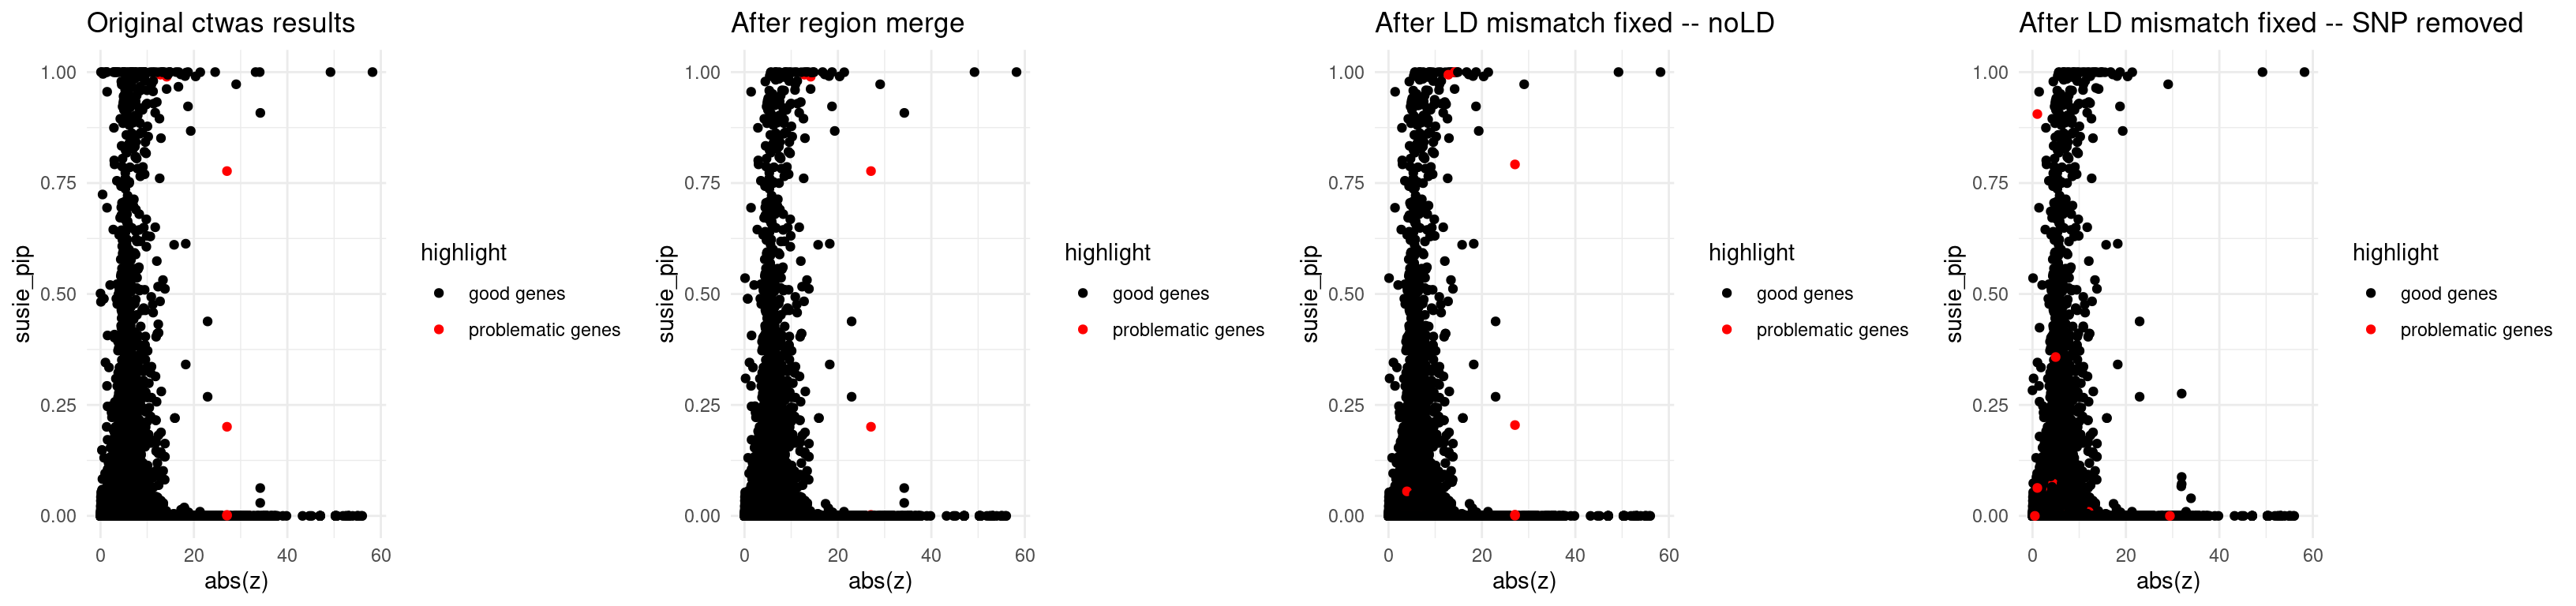
| Version | Author | Date |
|---|---|---|
| 65c1ad1 | XSun | 2024-12-19 |
print("L - estimated in region merge step")[1] "L - estimated in region merge step"print(updated_data_res_regionmerge$updated_region_L[problematic_region_ids]) 1_51248054_53760589 1_153208353_154797927 2_84913556_87738988
1 2 2
2_180448012_181401304 2_184415446_189017339 2_217530757_219589829
5 1 3
3_49279539_51797999 5_68555033_71944629 6_86359782_88112422
1 1 1
9_110015744_112068802 11_59013076_62456299 13_112918174_114344378
3 3 4
17_38653091_40721152 19_43358303_44239955 19_48778970_51029311
5 3 3
22_29255810_31043932 22_31043932_32268999 10_101189482_104935290
3 1 2 load(paste0("/project/xinhe/xsun/multi_group_ctwas/11.multi_group_1008/post_process_rm_ld/ldmismatch_pipthres05_removesnp_rescreenregion_",trait,".rdata"))
print("L - re-estimated after updating z_scores, region data")[1] "L - re-estimated after updating z_scores, region data"print(screen_res$screened_region_L) 1_51248054_53760589 1_153208353_154797927 2_84913556_87738988
1 2 2
2_180448012_181401304 2_184415446_189017339 2_217530757_219589829
3 1 4
3_49279539_51797999 5_68555033_71944629 6_86359782_88112422
1 1 1
9_110015744_112068802 11_59013076_62456299 13_112918174_114344378
3 3 4
17_38653091_40721152 19_43358303_44239955 19_48778970_51029311
5 4 3
22_29255810_31043932 22_31043932_32268999 10_101189482_104935290
3 1 2 print("Zoom in the z<15 part")[1] "Zoom in the z<15 part"finemap_res_origin_gene_prob <- finemap_res_origin_gene[finemap_res_origin_gene$highlight == "problematic genes",]
p1 <- ggplot(data = finemap_res_origin_gene_prob,
aes(x = abs(z), y = susie_pip, color = highlight, alpha = highlight)) +
geom_point() +
scale_color_manual(values = c("problematic genes" = "red", "good genes" = "black")) +
scale_alpha_manual(values = c("problematic genes" = 1, "good genes" = 0.01)) +
ggtitle("Original ctwas results") +
theme_minimal() +
xlim(0, 15)
finemap_res_rm_gene_prob <- finemap_res_rm_gene[finemap_res_rm_gene$highlight == "problematic genes",]
p2 <- ggplot(data = finemap_res_rm_gene_prob,
aes(x = abs(z), y = susie_pip, color = highlight, alpha = highlight)) +
geom_point() +
scale_color_manual(values = c("problematic genes" = "red", "good genes" = "black")) +
scale_alpha_manual(values = c("problematic genes" = 1, "good genes" = 0.01)) +
ggtitle("After region merge") +
theme_minimal() +
xlim(0, 15)
finemap_res_ldmm_nold_gene_prob <- finemap_res_ldmm_nold_gene[finemap_res_ldmm_nold_gene$highlight == "problematic genes",]
p3 <- ggplot(data = finemap_res_ldmm_nold_gene_prob,
aes(x = abs(z), y = susie_pip, color = highlight, alpha = highlight)) +
geom_point() +
scale_color_manual(values = c("problematic genes" = "red", "good genes" = "black")) +
scale_alpha_manual(values = c("problematic genes" = 1, "good genes" = 0.01)) +
ggtitle("After LD mismatch fixed -- noLD") +
theme_minimal() +
xlim(0, 15)
finemap_res_ldmm_removesnp_gene_prob <- finemap_res_ldmm_removesnp_gene[finemap_res_ldmm_removesnp_gene$highlight == "problematic genes",]
p4 <- ggplot(data = finemap_res_ldmm_removesnp_gene_prob,
aes(x = abs(z), y = susie_pip, color = highlight, alpha = highlight)) +
geom_point() +
scale_color_manual(values = c("problematic genes" = "red", "good genes" = "black")) +
scale_alpha_manual(values = c("problematic genes" = 1, "good genes" = 0.01)) +
ggtitle("After LD mismatch fixed -- SNP removed") +
theme_minimal() +
xlim(0, 15)
grid.arrange(p1,p2,p3,p4, ncol = 4)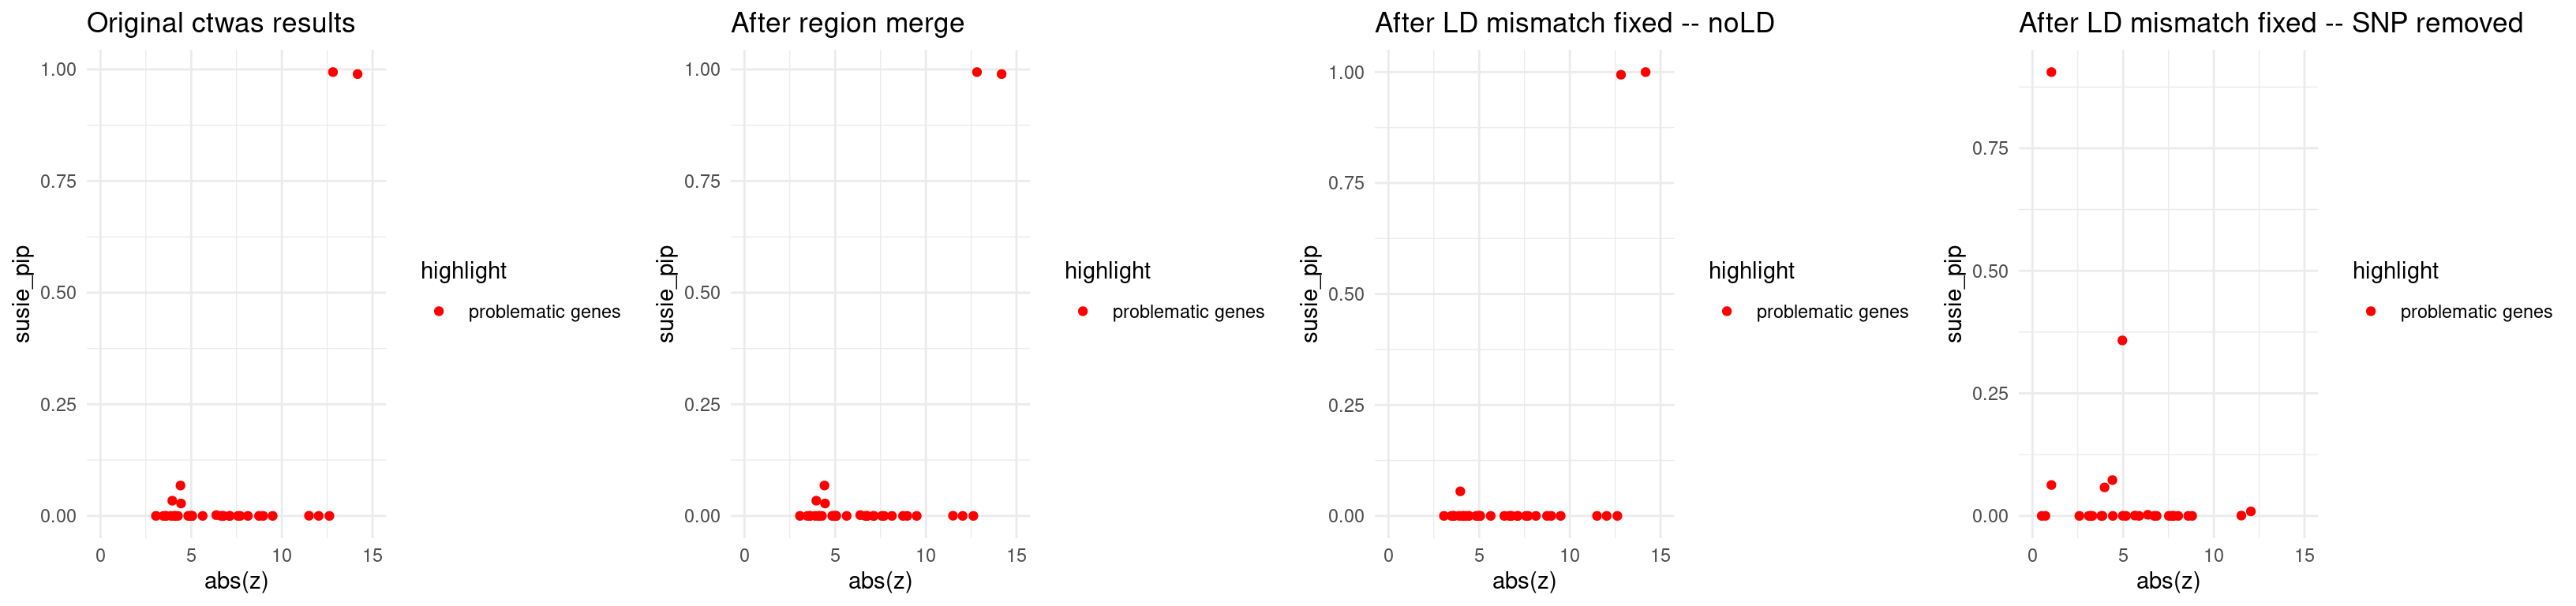
| Version | Author | Date |
|---|---|---|
| 65c1ad1 | XSun | 2024-12-19 |
sessionInfo()R version 4.2.0 (2022-04-22)
Platform: x86_64-pc-linux-gnu (64-bit)
Running under: CentOS Linux 7 (Core)
Matrix products: default
BLAS/LAPACK: /software/openblas-0.3.13-el7-x86_64/lib/libopenblas_haswellp-r0.3.13.so
locale:
[1] C
attached base packages:
[1] stats4 stats graphics grDevices utils datasets methods
[8] base
other attached packages:
[1] dplyr_1.1.4 gridExtra_2.3
[3] ggplot2_3.5.1 EnsDb.Hsapiens.v86_2.99.0
[5] ensembldb_2.20.2 AnnotationFilter_1.20.0
[7] GenomicFeatures_1.48.3 AnnotationDbi_1.58.0
[9] Biobase_2.56.0 GenomicRanges_1.48.0
[11] GenomeInfoDb_1.39.9 IRanges_2.30.0
[13] S4Vectors_0.34.0 BiocGenerics_0.42.0
[15] ctwas_0.4.20.9001
loaded via a namespace (and not attached):
[1] colorspace_2.0-3 rjson_0.2.21
[3] ellipsis_0.3.2 rprojroot_2.0.3
[5] XVector_0.36.0 locuszoomr_0.2.1
[7] fs_1.5.2 rstudioapi_0.13
[9] farver_2.1.0 DT_0.22
[11] ggrepel_0.9.1 bit64_4.0.5
[13] fansi_1.0.3 xml2_1.3.3
[15] codetools_0.2-18 logging_0.10-108
[17] cachem_1.0.6 knitr_1.39
[19] jsonlite_1.8.0 workflowr_1.7.0
[21] Rsamtools_2.12.0 dbplyr_2.1.1
[23] png_0.1-7 readr_2.1.2
[25] compiler_4.2.0 httr_1.4.3
[27] assertthat_0.2.1 Matrix_1.5-3
[29] fastmap_1.1.0 lazyeval_0.2.2
[31] cli_3.6.1 later_1.3.0
[33] htmltools_0.5.2 prettyunits_1.1.1
[35] tools_4.2.0 gtable_0.3.0
[37] glue_1.6.2 GenomeInfoDbData_1.2.8
[39] rappdirs_0.3.3 Rcpp_1.0.12
[41] jquerylib_0.1.4 vctrs_0.6.5
[43] Biostrings_2.64.0 rtracklayer_1.56.0
[45] crosstalk_1.2.0 xfun_0.41
[47] stringr_1.5.1 lifecycle_1.0.4
[49] irlba_2.3.5 restfulr_0.0.14
[51] XML_3.99-0.14 zlibbioc_1.42.0
[53] zoo_1.8-10 scales_1.3.0
[55] gggrid_0.2-0 hms_1.1.1
[57] promises_1.2.0.1 MatrixGenerics_1.8.0
[59] ProtGenerics_1.28.0 parallel_4.2.0
[61] SummarizedExperiment_1.26.1 LDlinkR_1.2.3
[63] yaml_2.3.5 curl_4.3.2
[65] memoise_2.0.1 sass_0.4.1
[67] biomaRt_2.54.1 stringi_1.7.6
[69] RSQLite_2.3.1 highr_0.9
[71] BiocIO_1.6.0 filelock_1.0.2
[73] BiocParallel_1.30.3 rlang_1.1.2
[75] pkgconfig_2.0.3 matrixStats_0.62.0
[77] bitops_1.0-7 evaluate_0.15
[79] lattice_0.20-45 purrr_1.0.2
[81] labeling_0.4.2 GenomicAlignments_1.32.0
[83] htmlwidgets_1.5.4 cowplot_1.1.1
[85] bit_4.0.4 tidyselect_1.2.0
[87] magrittr_2.0.3 R6_2.5.1
[89] generics_0.1.2 DelayedArray_0.22.0
[91] DBI_1.2.2 withr_2.5.0
[93] pgenlibr_0.3.3 pillar_1.9.0
[95] whisker_0.4 KEGGREST_1.36.3
[97] RCurl_1.98-1.7 mixsqp_0.3-43
[99] tibble_3.2.1 crayon_1.5.1
[101] utf8_1.2.2 BiocFileCache_2.4.0
[103] plotly_4.10.0 tzdb_0.4.0
[105] rmarkdown_2.25 progress_1.2.2
[107] grid_4.2.0 data.table_1.14.2
[109] blob_1.2.3 git2r_0.30.1
[111] digest_0.6.29 tidyr_1.3.0
[113] httpuv_1.6.5 munsell_0.5.0
[115] viridisLite_0.4.0 bslib_0.3.1