6 Traits, 5 tissues, eQTL + sQTL + stQTL
XSun
2024-10-15
Last updated: 2024-11-26
Checks: 6 1
Knit directory: multigroup_ctwas_analysis/
This reproducible R Markdown analysis was created with workflowr (version 1.7.1). The Checks tab describes the reproducibility checks that were applied when the results were created. The Past versions tab lists the development history.
The R Markdown file has unstaged changes. To know which version of the R Markdown file created these results, you’ll want to first commit it to the Git repo. If you’re still working on the analysis, you can ignore this warning. When you’re finished, you can run wflow_publish to commit the R Markdown file and build the HTML.
Great job! The global environment was empty. Objects defined in the global environment can affect the analysis in your R Markdown file in unknown ways. For reproduciblity it’s best to always run the code in an empty environment.
The command set.seed(20231112) was run prior to running the code in the R Markdown file. Setting a seed ensures that any results that rely on randomness, e.g. subsampling or permutations, are reproducible.
Great job! Recording the operating system, R version, and package versions is critical for reproducibility.
Nice! There were no cached chunks for this analysis, so you can be confident that you successfully produced the results during this run.
Great job! Using relative paths to the files within your workflowr project makes it easier to run your code on other machines.
Great! You are using Git for version control. Tracking code development and connecting the code version to the results is critical for reproducibility.
The results in this page were generated with repository version e365a66. See the Past versions tab to see a history of the changes made to the R Markdown and HTML files.
Note that you need to be careful to ensure that all relevant files for the analysis have been committed to Git prior to generating the results (you can use wflow_publish or wflow_git_commit). workflowr only checks the R Markdown file, but you know if there are other scripts or data files that it depends on. Below is the status of the Git repository when the results were generated:
Ignored files:
    Ignored:    .Rhistory
    Ignored:    analysis/figure/

Unstaged changes:
    Modified:   analysis/multi_group_6traits_15weights_ess.Rmd
Note that any generated files, e.g. HTML, png, CSS, etc., are not included in this status report because it is ok for generated content to have uncommitted changes.
These are the previous versions of the repository in which changes were made to the R Markdown (analysis/multi_group_6traits_15weights_ess.Rmd) and HTML (docs/multi_group_6traits_15weights_ess.html) files. If you’ve configured a remote Git repository (see ?wflow_git_remote), click on the hyperlinks in the table below to view the files as they were in that past version.
| File | Version | Author | Date | Message |
|---|---|---|---|---|
| Rmd | e365a66 | XSun | 2024-11-24 | update |
| html | e365a66 | XSun | 2024-11-24 | update |
| Rmd | dc10f9d | XSun | 2024-11-23 | update |
| html | dc10f9d | XSun | 2024-11-23 | update |
| Rmd | eb58424 | XSun | 2024-10-17 | update |
| html | eb58424 | XSun | 2024-10-17 | update |
| Rmd | 4a84d72 | XSun | 2024-10-15 | update |
| html | 4a84d72 | XSun | 2024-10-15 | update |
Overview
Tissues
The independent tissues are selected by single tissue analysis
Omics
eQTL, sQTL weights are from Predictdb
stQTL was a combination of Munro apa + rs QTL, if a gene has both rs-QTL and APA-QTL, we use rs-QTL.
Settings
stQTL from Munro
- Weight processing:
PredictDB:
all the PredictDB are converted from FUSION weights
- drop_strand_ambig = TRUE,
- scale_by_ld_variance = F (FUSION converted weights)
- load_predictdb_LD = F,
- Parameter estimation and fine-mapping
- niter_prefit = 5,
- niter = 30(default),
- filter_L = TRUE,
- group_prior_var_structure = “shared_type”,
- maxSNP = 20000,
- min_nonSNP_PIP = 0.5,
e + s QTL from predictdb
- Weight processing:
PredictDB (eqtl, sqtl)
- drop_strand_ambig = TRUE,
- scale_by_ld_variance = T
- load_predictdb_LD = F,
- Parameter estimation and fine-mapping
- group_prior_var_structure = “shared_type”,
- filter_L = TRUE,
- filter_nonSNP_PIP = FALSE,
- min_abs_corr = 0.1,
mem: 150g 10cores
library(ctwas)
library(ggplot2)
library(tidyverse)
library(pheatmap)
library(EnsDb.Hsapiens.v86)

ens_db <- EnsDb.Hsapiens.v86

mapping_predictdb <- readRDS("/project2/xinhe/shared_data/multigroup_ctwas/weights/mapping_files/PredictDB_mapping.RDS")
mapping_munro <- readRDS("/project2/xinhe/shared_data/multigroup_ctwas/weights/mapping_files/Munro_mapping.RDS")
mapping_two <- rbind(mapping_predictdb,mapping_munro)

load("/project2/xinhe/shared_data/multigroup_ctwas/gwas/samplesize.rdata")


colors <- c(  "#1f77b4", "#ff7f0e", "#2ca02c", "#d62728",  "#9467bd", "#8c564b", "#e377c2", "#7f7f7f",  "#bcbd22",  "#17becf",  "#f7b6d2",  "#c5b0d5",  "#9edae5", "#ffbb78",  "#98df8a",  "#ff9896" )

plot_piechart <- function(ctwas_parameters, colors, by) {
  # Create the initial data frame
  data <- data.frame(
    category = names(ctwas_parameters$prop_heritability),
    percentage = ctwas_parameters$prop_heritability
  )

  # Split the category into context and type
  data <- data %>%
    mutate(
      context = sub("\\|.*", "", category),
      type = sub(".*\\|", "", category)
    )

  # Aggregate the data based on the 'by' parameter
  if (by == "type") {
    data <- data %>%
      group_by(type) %>%
      summarize(percentage = sum(percentage)) %>%
      mutate(category = type)  # Use type as the new category
  } else if (by == "context") {
    data <- data %>%
      group_by(context) %>%
      summarize(percentage = sum(percentage)) %>%
      mutate(category = context)  # Use context as the new category
  } else {
    stop("Invalid 'by' parameter. Use 'type' or 'context'.")
  }

  # Calculate percentage labels for the chart
  data$percentage_label <- paste0(round(data$percentage * 100, 1), "%")

  # Create the pie chart
  pie <- ggplot(data, aes(x = "", y = percentage, fill = category)) +
    geom_bar(stat = "identity", width = 1) +
    coord_polar("y", start = 0) +
    theme_void() +  # Remove background and axes
    geom_text(aes(label = percentage_label),
              position = position_stack(vjust = 0.5), size = 3) +  # Adjust size as needed
    scale_fill_manual(values = colors) +  # Custom colors
    labs(fill = "Category") +  # Legend title
    ggtitle("Percent of Heritability")  # Title

  return(pie)
}


plot_heatmap <- function(heatmap_data, main) {

  rownames(heatmap_data) <- heatmap_data$gene_name
  heatmap_data <- heatmap_data %>% dplyr::select(-gene_name, -combined_pip)

  if(nrow(heatmap_data) ==1){

    heatmap_data <- rbind(heatmap_data,rep(0,ncol(heatmap_data)))
    rownames(heatmap_data)[2] <- "fake_gene_for_plotting"

  }

  heatmap_matrix <- as.matrix(heatmap_data)

  p <- pheatmap(heatmap_matrix,
                cluster_rows = F,   # Cluster the rows (genes)
                cluster_cols = F,   # Cluster the columns (QTL types)
                color = colorRampPalette(c("white", "red"))(50), # Color gradient
                display_numbers = TRUE, # Display numbers in cells
                main = main,labels_row = rownames(heatmap_data), silent = T)

  return(p)
}


compute_pip_per_cs <- function(combined_data, susie_data) {
  # Initialize an empty list to store results
  details <- list()

  # Iterate over each unique gene name in the combined data
  unique_genes <- unique(combined_data$gene_name)

  for (genename in unique_genes) {
    # dplyr::filter susie data for the current gene
    susie_alpha_res_multi_per_gene <- susie_data %>%
      dplyr::filter(gene_name == genename)

    # Get all unique credible sets for the current gene
    cs_all <- unique(susie_alpha_res_multi_per_gene$susie_set[susie_alpha_res_multi_per_gene$in_cs])

    if (length(cs_all) > 1) {
      # dplyr::filter complete cases and those in credible sets
      susie_alpha_res_multi_per_gene <- susie_alpha_res_multi_per_gene %>%
        dplyr::filter(complete.cases(cs), in_cs)

      # Summarize the data
      summed_alpha_with_details <- susie_alpha_res_multi_per_gene %>%
        group_by(susie_set) %>%
        summarise(
          total_susie_alpha = round(sum(susie_alpha, na.rm = TRUE), digits = 3),
          num_molecular_traits = n(),
          ids_pip = paste0(id, "(", round(susie_alpha, digits = 3), ")", collapse = ", ")
        )

      # Add gene name to the summarized data
      summed_alpha_with_details$gene_name <- genename

      # Append the result to the details list
      details[[length(details) + 1]] <- summed_alpha_with_details
    }
  }

  # Combine all results into a single data frame
  final_details <- bind_rows(details)
  final_details <- final_details[,c("gene_name","susie_set","total_susie_alpha","num_molecular_traits","ids_pip")]
  colnames(final_details) <- c("gene_name","CS","total_PIP_CS","num_molecular_traits_CS","ids_pip_CS")
  return(final_details)
}
aFib-ebi-a-GCST006414
Parameters
trait <- "aFib-ebi-a-GCST006414"
gwas_n <- samplesize[trait]
tissue <- c("Heart_Atrial_Appendage","Artery_Tibial","Muscle_Skeletal","Stomach","Thyroid")

results_dir_multi <- paste0("/project/xinhe/xsun/multi_group_ctwas/11.multi_group_1008/results/",trait,"/")
ctwas_res_multi <- readRDS(paste0(results_dir_multi,trait,".ctwas.res.RDS"))

param_multi <- ctwas_res_multi$param
make_convergence_plots(param_multi, gwas_n, colors = colors)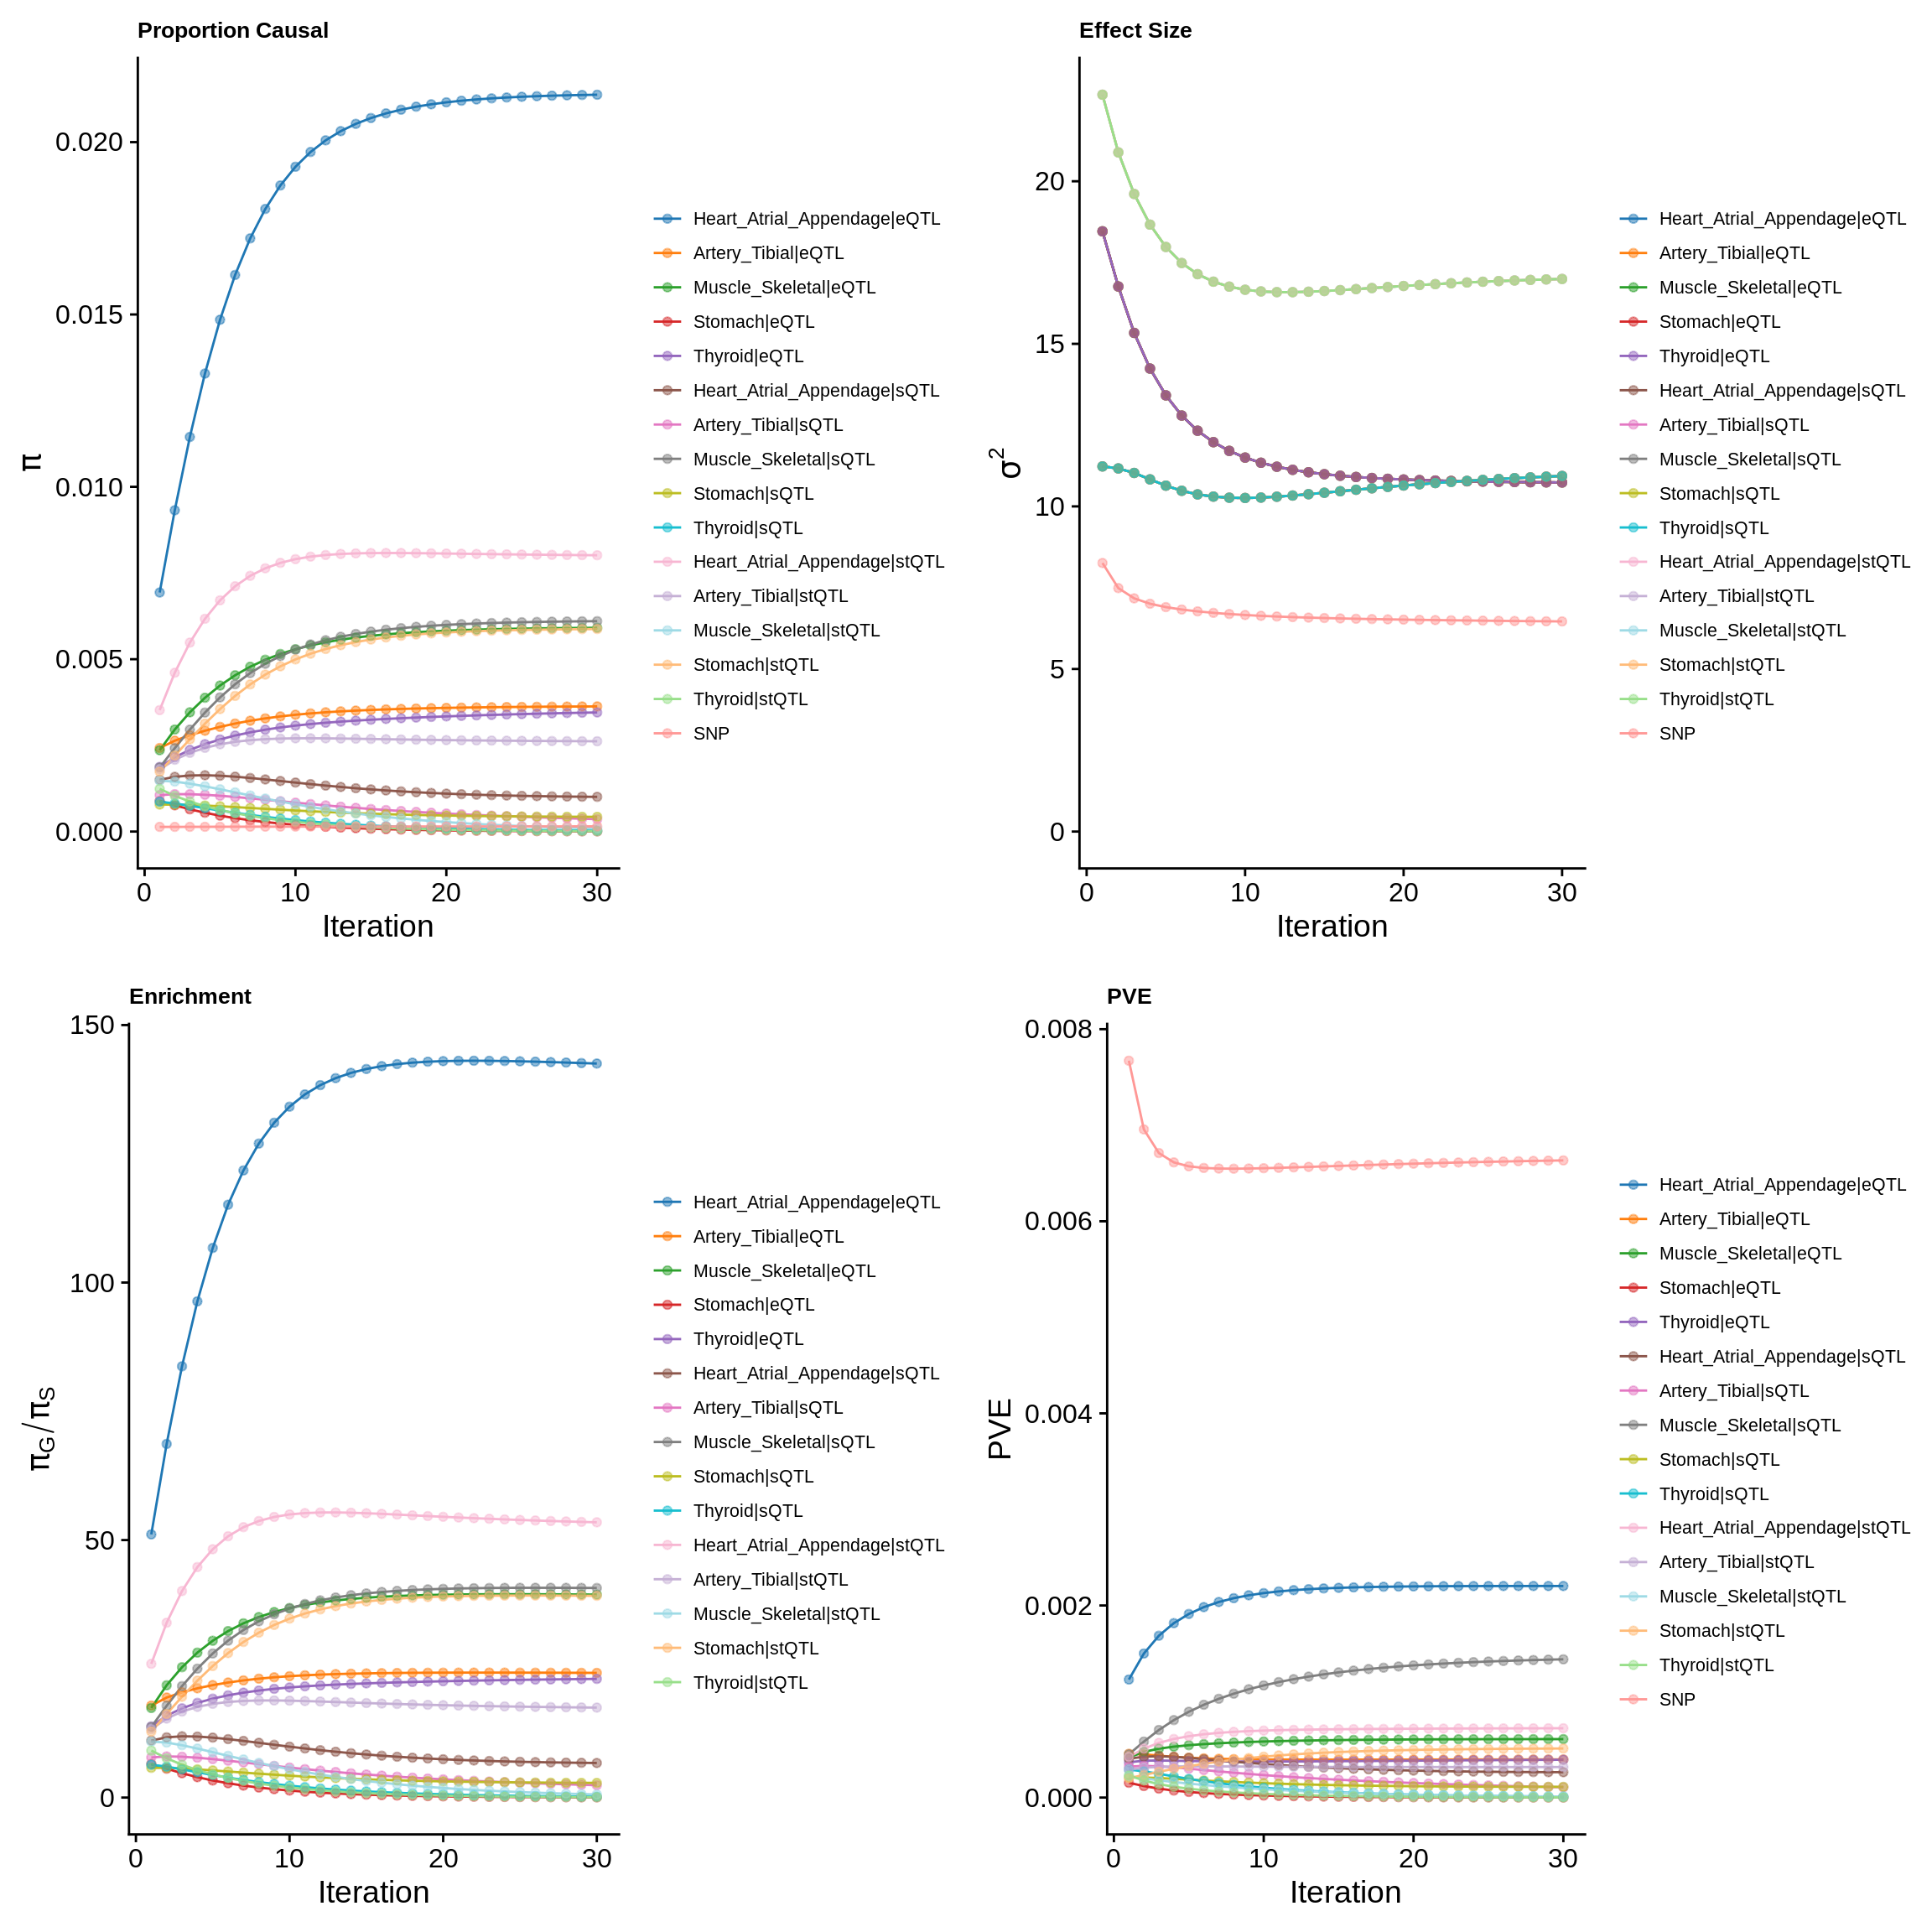
ctwas_parameters_multi <- summarize_param(param_multi, gwas_n)
pve_pie_by_type_multi <- plot_piechart(ctwas_parameters = ctwas_parameters_multi, colors = colors, by = "type")
pve_pie_by_context_multi <- plot_piechart(ctwas_parameters = ctwas_parameters_multi, colors = colors, by = "context")

gridExtra::grid.arrange(pve_pie_by_type_multi,pve_pie_by_context_multi, ncol = 2)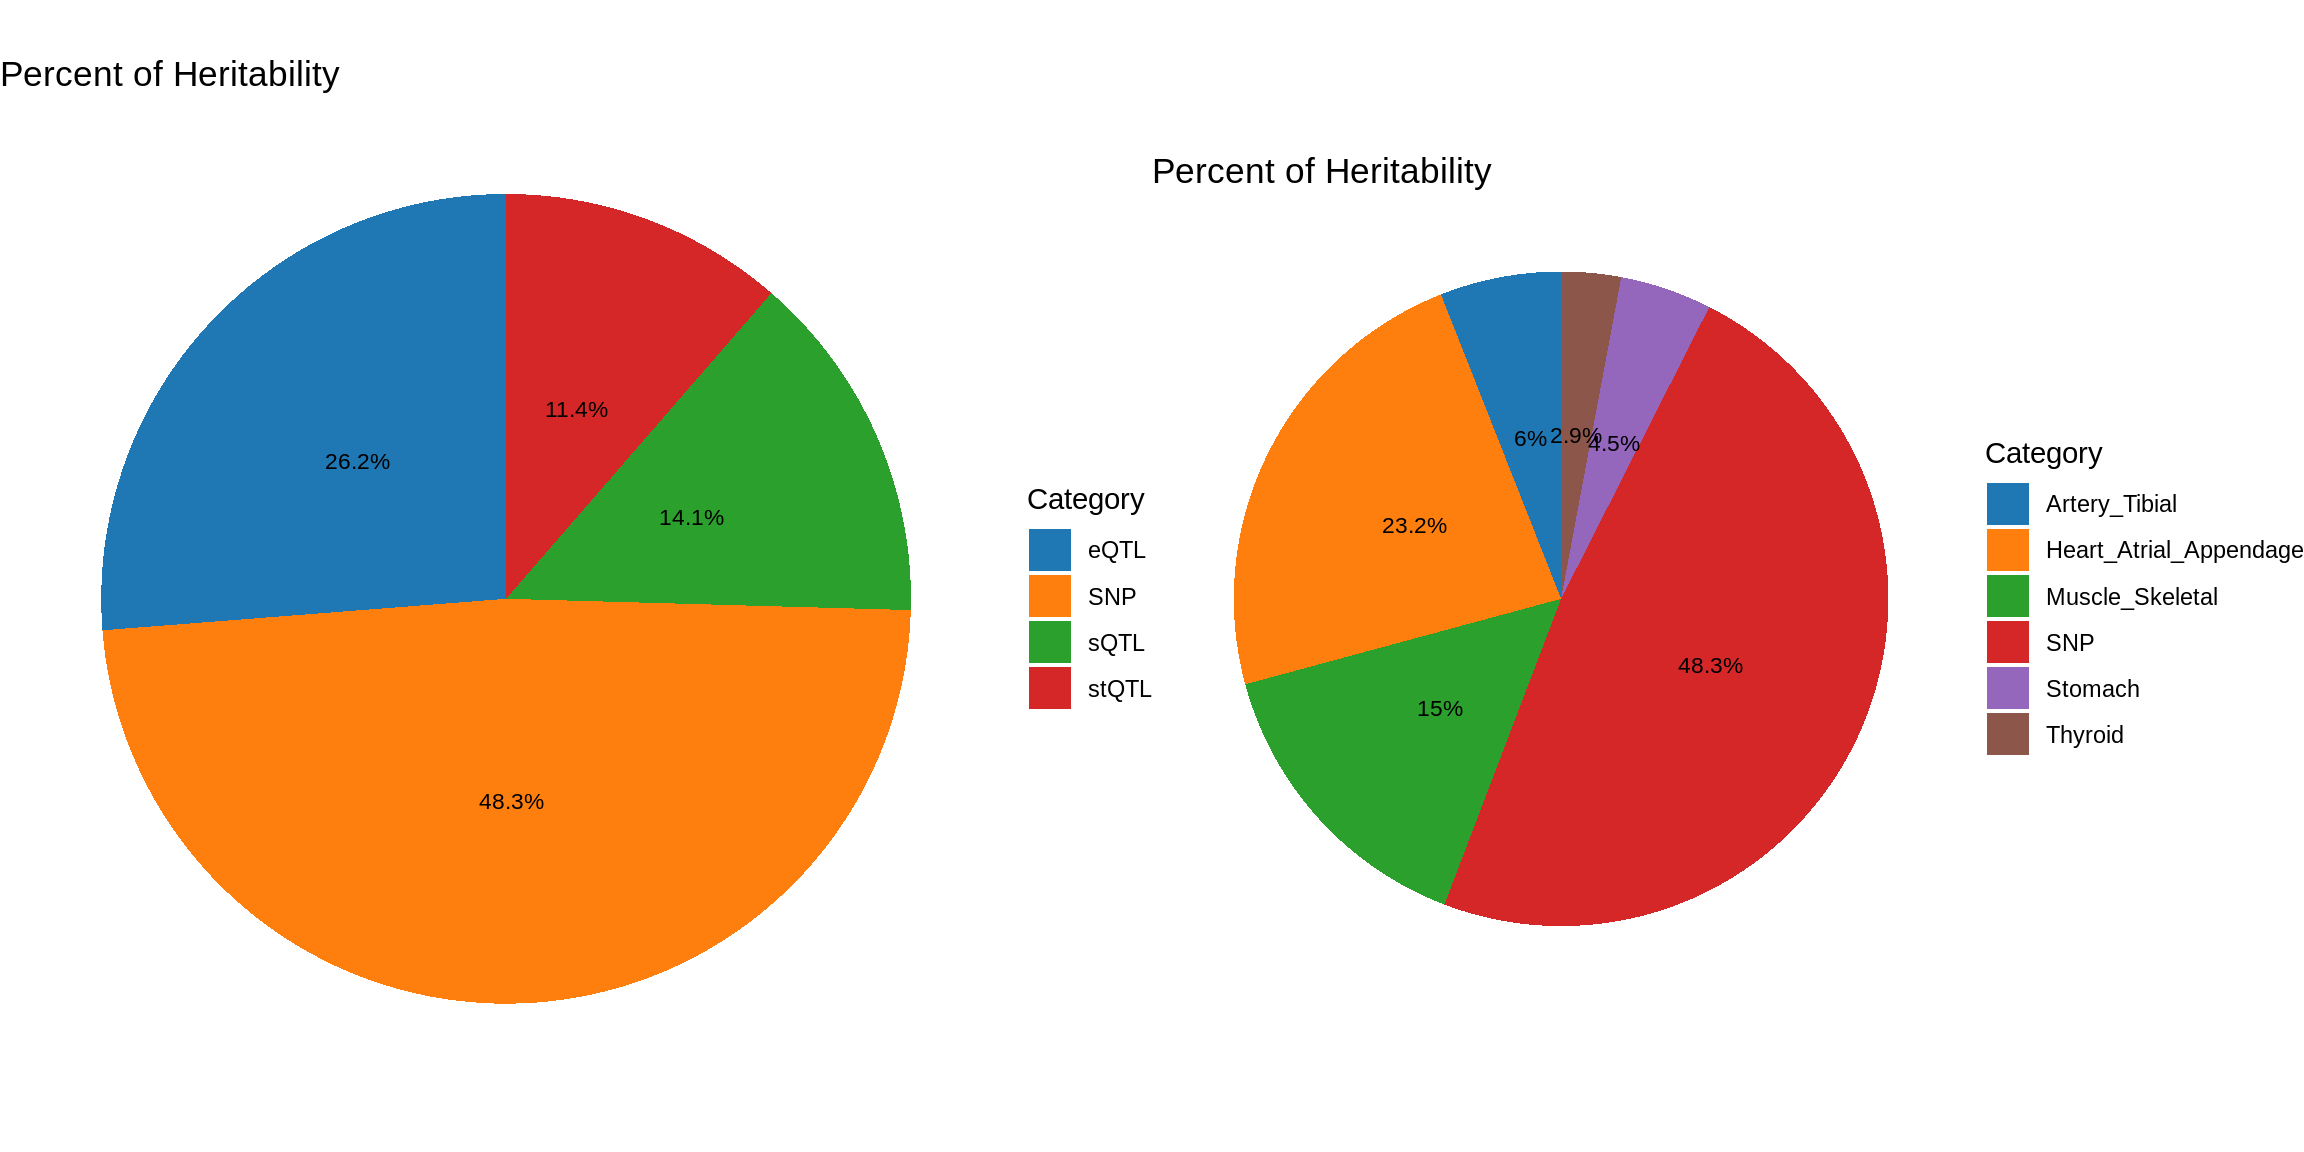
Postprocessing – LD mismatch
finemap_res_multi <- ctwas_res_multi$finemap_res
finemap_res_multi <- ctwas_res_multi$finemap_res

finemap_res_multi_gene <- finemap_res_multi[finemap_res_multi$type != "SNP",]

ggplot(data = finemap_res_multi_gene, aes(x= abs(z), y= susie_pip)) +
  geom_point() +
  ggtitle("Z scores vs PIP") +
  theme_minimal()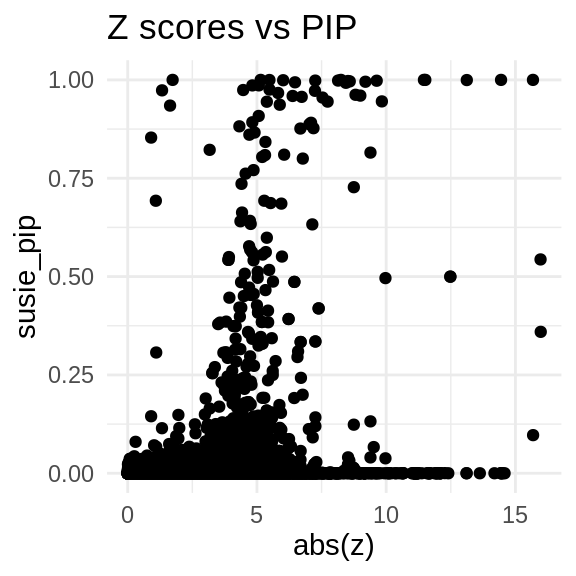
load(paste0("/project/xinhe/xsun/multi_group_ctwas/11.multi_group_1008/ld_mismatch/LD_mismatch_", trait,".rdata"))

sprintf("The number of problematic regions = %s", length(problematic_region_ids))
[1] "The number of problematic regions = 5"sprintf("The number of problematic genes = %s", length(problematic_genes))[1] "The number of problematic genes = 5"sprintf("The number of problematic snps = %s", length(res$problematic_snps))[1] "The number of problematic snps = 1775"sprintf("The number of flipped snps = %s", length(res$flipped_snps))[1] "The number of flipped snps = 23"problematic_snps <- res$condz_stats[res$condz_stats$id %in% res$problematic_snps,]
DT::datatable(problematic_snps,caption = htmltools::tags$caption(style = 'caption-side: topleft; text-align = left; color:black;','Stats for problematic snps'),options = list(pageLength = 5) )finemap_origin_res_problematic_region <- finemap_res_multi[finemap_res_multi$id %in% problematic_genes,]
merge_origin_nold <- merge(finemap_origin_res_problematic_region,finemap_noLD_res_problematic_region, by = "id")
merge_origin_nold <- merge_origin_nold[,c("id","susie_pip.x","susie_pip.y")]
colnames(merge_origin_nold) <- c("id","susie_pip_origin","susie_pip_ld-mismatch-fixed")
DT::datatable(merge_origin_nold,caption = htmltools::tags$caption(style = 'caption-side: topleft; text-align = left; color:black;','Original PIP and fixed PIP for problematic genes'),options = list(pageLength = 5) )Fine-mapping (LD mis-match fixed)
susie_alpha_res_multi <- ctwas_res_multi$susie_alpha_res
rerun_finemap_res <- res$finemap_res
rerun_susie_alpha_res <- res$susie_alpha_res
res <- update_finemap_res(finemap_res_multi,
                          susie_alpha_res_multi,
                          rerun_finemap_res,
                          rerun_susie_alpha_res,
                          updated_region_ids = problematic_region_ids)

finemap_res_multi <- res$finemap_res
susie_alpha_res_multi <- res$susie_alpha_res

susie_alpha_res_multi <- anno_susie_alpha_res(susie_alpha_res_multi,
                                        mapping_table = mapping_two,
                                        map_by = "molecular_id",
                                        drop_unmapped = TRUE)
2024-11-26 14:46:51 INFO::Annotating susie alpha result ...
2024-11-26 14:46:51 INFO::Map molecular traits to genes
2024-11-26 14:46:52 INFO::Split PIPs for molecular traits mapped to multiple genescombined_pip_by_type_cs_multi <- combine_gene_pips(susie_alpha_res_multi,
group_by = "gene_name",
by = "type",
method = "combine_cs",
filter_cs = TRUE,
include_cs_id = T)
combined_pip_by_context_cs_multi <- combine_gene_pips(susie_alpha_res_multi,
group_by = "gene_name",
by = "context",
method = "combine_cs",
filter_cs = TRUE,
include_cs_id = T)
DT::datatable(combined_pip_by_type_cs_multi[combined_pip_by_type_cs_multi$combined_pip>0.8,],caption = htmltools::tags$caption( style = 'caption-side: topleft; text-align = left; color:black;','Combined PIP by omics'),options = list(pageLength = 5) )DT::datatable(combined_pip_by_context_cs_multi[combined_pip_by_context_cs_multi$combined_pip>0.8,],caption = htmltools::tags$caption( style = 'caption-side: topleft; text-align = left; color:black;','Combined PIP by tissue'),options = list(pageLength = 5) )combined_pip_by_group_multi <- combine_gene_pips(susie_alpha_res_multi,
group_by = "gene_name",
by = "group",
method = "combine_cs",
filter_cs = TRUE,
include_cs_id = F)
combined_pip_by_group_sig_multi <- combined_pip_by_group_multi[combined_pip_by_group_multi$combined_pip > 0.8,]
plot_heatmap(heatmap_data = combined_pip_by_group_sig_multi, main = "PIP partitions for genes with PIP>0.8")
Comparing with single tissue + eQTL analysis
ctwas_res_single <- readRDS(paste0("/project/xinhe/xsun/multi_group_ctwas/10.single_tissue_1007/results/",trait,"/",tissue[1],"/",trait,"_",tissue[1], ".ctwas.res.RDS"))

susie_alpha_res_single <- ctwas_res_single$susie_alpha_res

susie_alpha_res_single <- anno_susie_alpha_res(susie_alpha_res_single,
                                        mapping_table = mapping_predictdb,
                                        map_by = "molecular_id",
                                        drop_unmapped = TRUE)
2024-11-26 14:47:04 INFO::Annotating susie alpha result ...
2024-11-26 14:47:04 INFO::Map molecular traits to genescombined_pip_by_type_single <- combine_gene_pips(susie_alpha_res_single,
group_by = "gene_name",
by = "type",
method = "combine_cs",
filter_cs = TRUE,
include_cs_id = F)
combined_pip_by_type_sig_single <- combined_pip_by_type_single[combined_pip_by_type_single$combined_pip > 0.8,]
combined_pip_by_type_sig_multi <- combined_pip_by_type_cs_multi[combined_pip_by_type_cs_multi$combined_pip > 0.8,]
sprintf("Number of genes with PIP > 0.8 -- Multi-group = %s", nrow(combined_pip_by_type_sig_multi))[1] "Number of genes with PIP > 0.8 -- Multi-group = 64"sprintf("Number of genes with PIP > 0.8 -- single eQTL = %s", nrow(combined_pip_by_type_sig_single))[1] "Number of genes with PIP > 0.8 -- single eQTL = 24"sprintf("Number of overlapped genes = %s", sum(combined_pip_by_type_sig_single$gene_name %in% combined_pip_by_type_sig_multi$gene_name))[1] "Number of overlapped genes = 23"genes_not_reported <- combined_pip_by_type_sig_single$gene_name[!combined_pip_by_type_sig_single$gene_name %in%combined_pip_by_type_sig_multi$gene_name]
DT::datatable(combined_pip_by_type_sig_single[combined_pip_by_type_sig_single$gene_name %in% genes_not_reported,],caption = htmltools::tags$caption( style = 'caption-side: topleft; text-align = left; color:black;','Genes not reported by multi-group analysis'),options = list(pageLength = 5) )DT::datatable(combined_pip_by_type_cs_multi[combined_pip_by_type_cs_multi$gene_name %in% genes_not_reported,],caption = htmltools::tags$caption( style = 'caption-side: topleft; text-align = left; color:black;','Genes not reported by multi-group analysis'),options = list(pageLength = 5) )gene_multi_unique_type <- combined_pip_by_group_sig_multi[!combined_pip_by_group_sig_multi$gene_name %in% combined_pip_by_type_sig_single$gene_name,]
plot_heatmap(heatmap_data = gene_multi_unique_type, main = "PIP partition for unique genes found by multi-group analysis")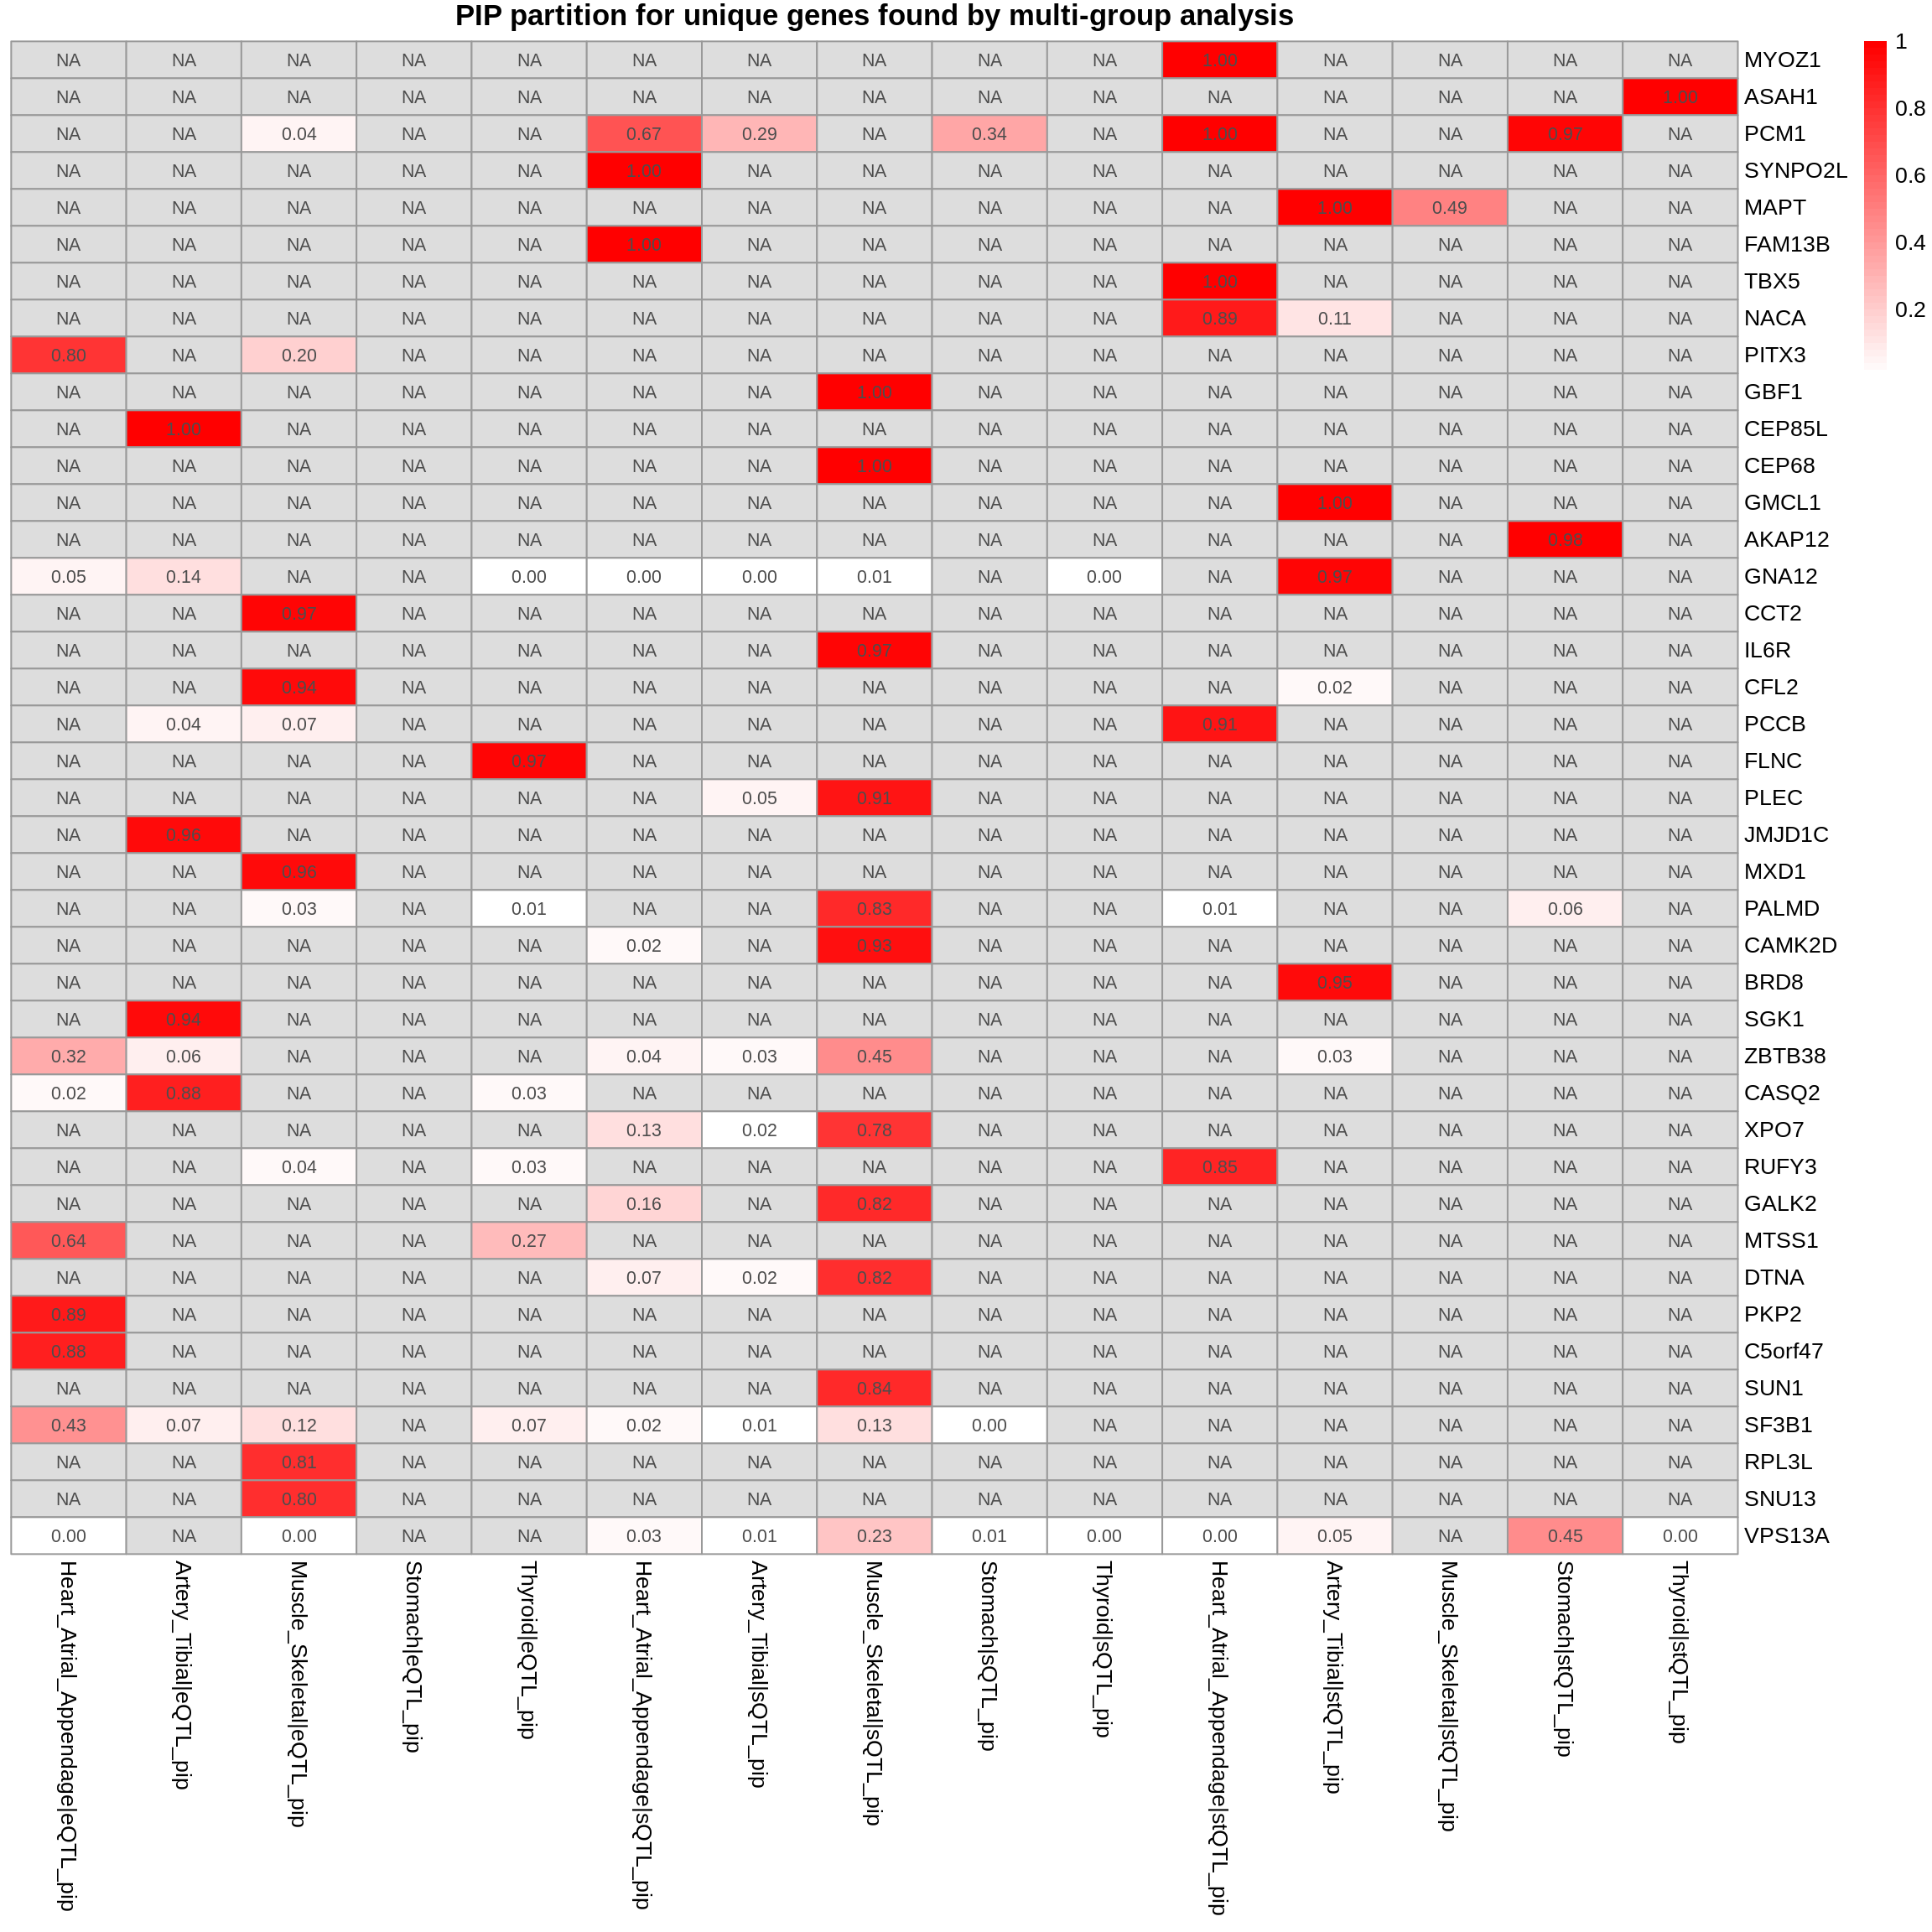
snp_map_single <- readRDS(paste0("/project/xinhe/xsun/multi_group_ctwas/10.single_tissue_1007/results/",trait,"/",tissue[1],"/",trait,"_",tissue[1], ".snp_map.RDS"))
weights_single <- readRDS(paste0("/project/xinhe/xsun/multi_group_ctwas/10.single_tissue_1007/results/",trait,"/",tissue[1],"/",trait,"_",tissue[1], ".preprocessed.weights.RDS"))

finemap_res_single <- ctwas_res_single$finemap_res
finemap_res_single$molecular_id <- get_molecular_ids(finemap_res_single)
finemap_res_single <- anno_finemap_res(finemap_res_single,
                                snp_map = snp_map_single,
                                mapping_table = mapping_two,
                                add_gene_annot = TRUE,
                                map_by = "molecular_id",
                                drop_unmapped = TRUE,
                                add_position = TRUE,
                                use_gene_pos = "mid")
2024-11-26 14:47:27 INFO::Annotating fine-mapping result ...
2024-11-26 14:47:27 INFO::Map molecular traits to genes
2024-11-26 14:47:32 INFO::Add gene positions
2024-11-26 14:47:33 INFO::Add SNP positionsmake_locusplot(finemap_res_single,
region_id = "13_48809826_51016955",
ens_db = ens_db,
weights = weights_single,
highlight_pip = 0.8,
filter_protein_coding_genes = TRUE,
filter_cs = TRUE,
color_pval_by = "cs",
color_pip_by = "cs")2024-11-26 14:47:45 INFO::Limit to protein coding genes
2024-11-26 14:47:45 INFO::focal id: ENSG00000176124.11|Heart_Atrial_Appendage_eQTL
2024-11-26 14:47:45 INFO::focal molecular trait: DLEU1 Heart_Atrial_Appendage eQTL
2024-11-26 14:47:45 INFO::Range of locus: chr13:48809898-51016397
2024-11-26 14:47:49 INFO::focal molecular trait QTL positions: 50081853
2024-11-26 14:47:49 INFO::Limit PIPs to credible sets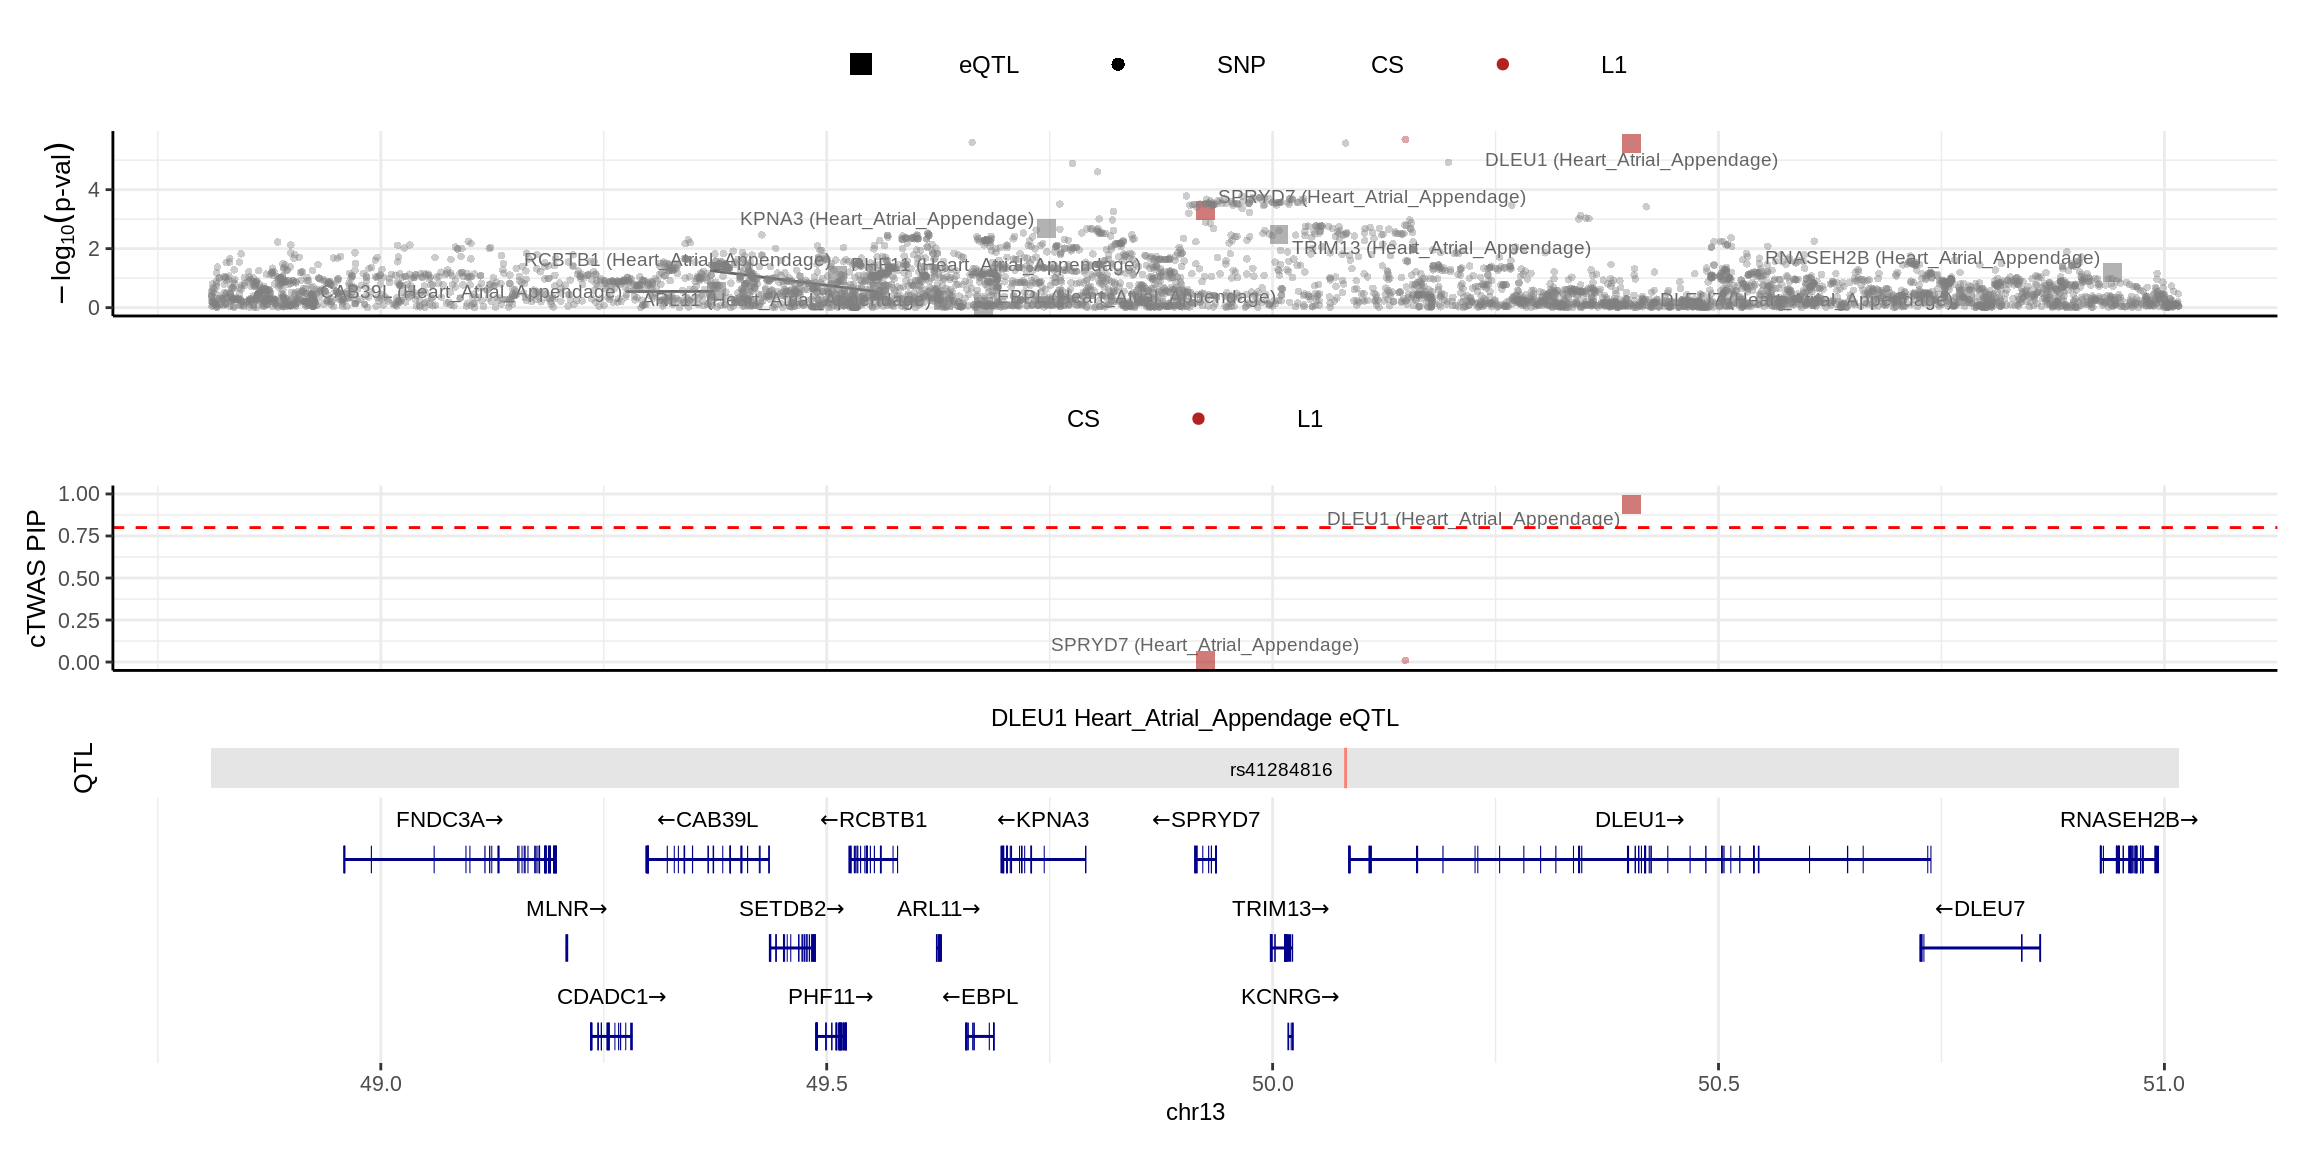
snp_map_multi <- readRDS(paste0(results_dir_multi,trait,".snp_map.RDS"))
weights_multi <- readRDS(paste0(results_dir_multi,trait,".preprocessed.weights.RDS"))

finemap_res_multi <- ctwas_res_multi$finemap_res
finemap_res_multi$molecular_id <- get_molecular_ids(finemap_res_multi)
finemap_res_multi <- anno_finemap_res(finemap_res_multi,
                                snp_map = snp_map_multi,
                                mapping_table = mapping_two,
                                add_gene_annot = TRUE,
                                map_by = "molecular_id",
                                drop_unmapped = TRUE,
                                add_position = TRUE,
                                use_gene_pos = "mid")
2024-11-26 14:48:06 INFO::Annotating fine-mapping result ...
2024-11-26 14:48:06 INFO::Map molecular traits to genes
2024-11-26 14:48:07 INFO::Split PIPs for molecular traits mapped to multiple genes
2024-11-26 14:48:13 INFO::Add gene positions
2024-11-26 14:48:13 INFO::Add SNP positionsmake_locusplot(finemap_res_multi,
region_id = "13_48809826_51016955",
ens_db = ens_db,
weights = weights_multi,
highlight_pip = 0.8,
filter_protein_coding_genes = TRUE,
filter_cs = TRUE,
color_pval_by = "cs",
color_pip_by = "cs")2024-11-26 14:48:17 INFO::Limit to protein coding genes
2024-11-26 14:48:17 INFO::focal id: ENSG00000176124.11|Heart_Atrial_Appendage_eQTL
2024-11-26 14:48:17 INFO::focal molecular trait: DLEU1 Heart_Atrial_Appendage eQTL
2024-11-26 14:48:17 INFO::Range of locus: chr13:48809898-51016397
2024-11-26 14:48:18 INFO::focal molecular trait QTL positions: 50081853
2024-11-26 14:48:18 INFO::Limit PIPs to credible sets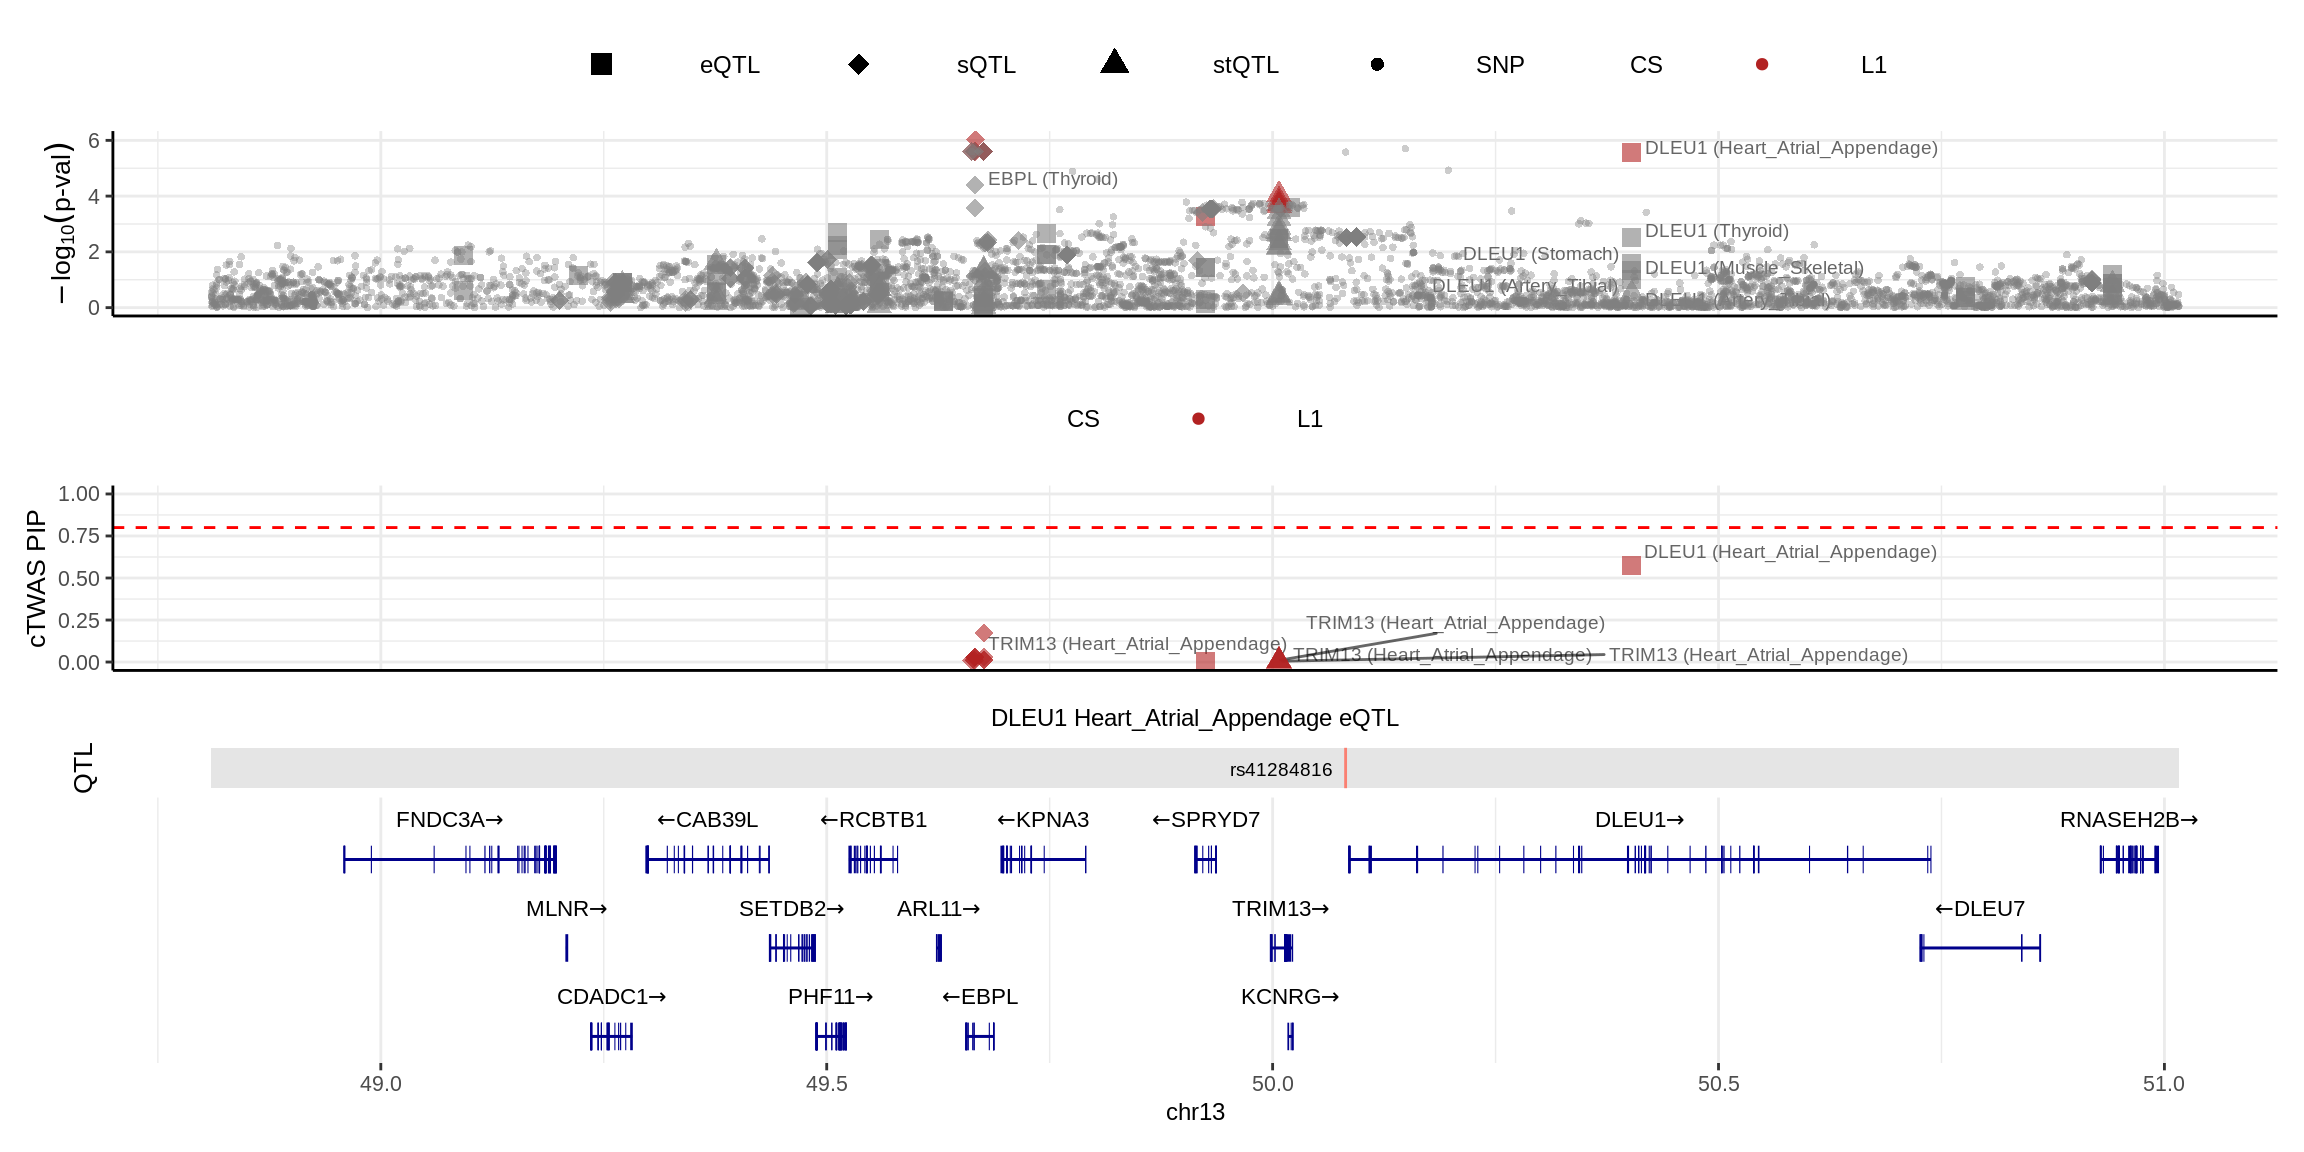
Exploring allelic heterogeneity
pip_per_cs <- compute_pip_per_cs(combined_pip_by_group_sig_multi, susie_alpha_res_multi)

sprintf("Number of genes having allelic heterogeneity = %s",length(unique(pip_per_cs$gene_name)))
[1] "Number of genes having allelic heterogeneity = 5"DT::datatable(pip_per_cs,caption = htmltools::tags$caption( style = 'caption-side: topleft; text-align = left; color:black;','PIP per CS'),options = list(pageLength = 5) )LDL-ukb-d-30780_irnt
Parameter
trait <- "LDL-ukb-d-30780_irnt"
gwas_n <- samplesize[trait]
tissue <- c("Liver","Spleen","Esophagus_Mucosa","Esophagus_Gastroesophageal_Junction","Skin_Not_Sun_Exposed_Suprapubic")

results_dir_multi <- paste0("/project/xinhe/xsun/multi_group_ctwas/11.multi_group_1008/results/",trait,"/")
ctwas_res_multi <- readRDS(paste0(results_dir_multi,trait,".ctwas.res.RDS"))

param_multi <- ctwas_res_multi$param
make_convergence_plots(param_multi, gwas_n, colors = colors)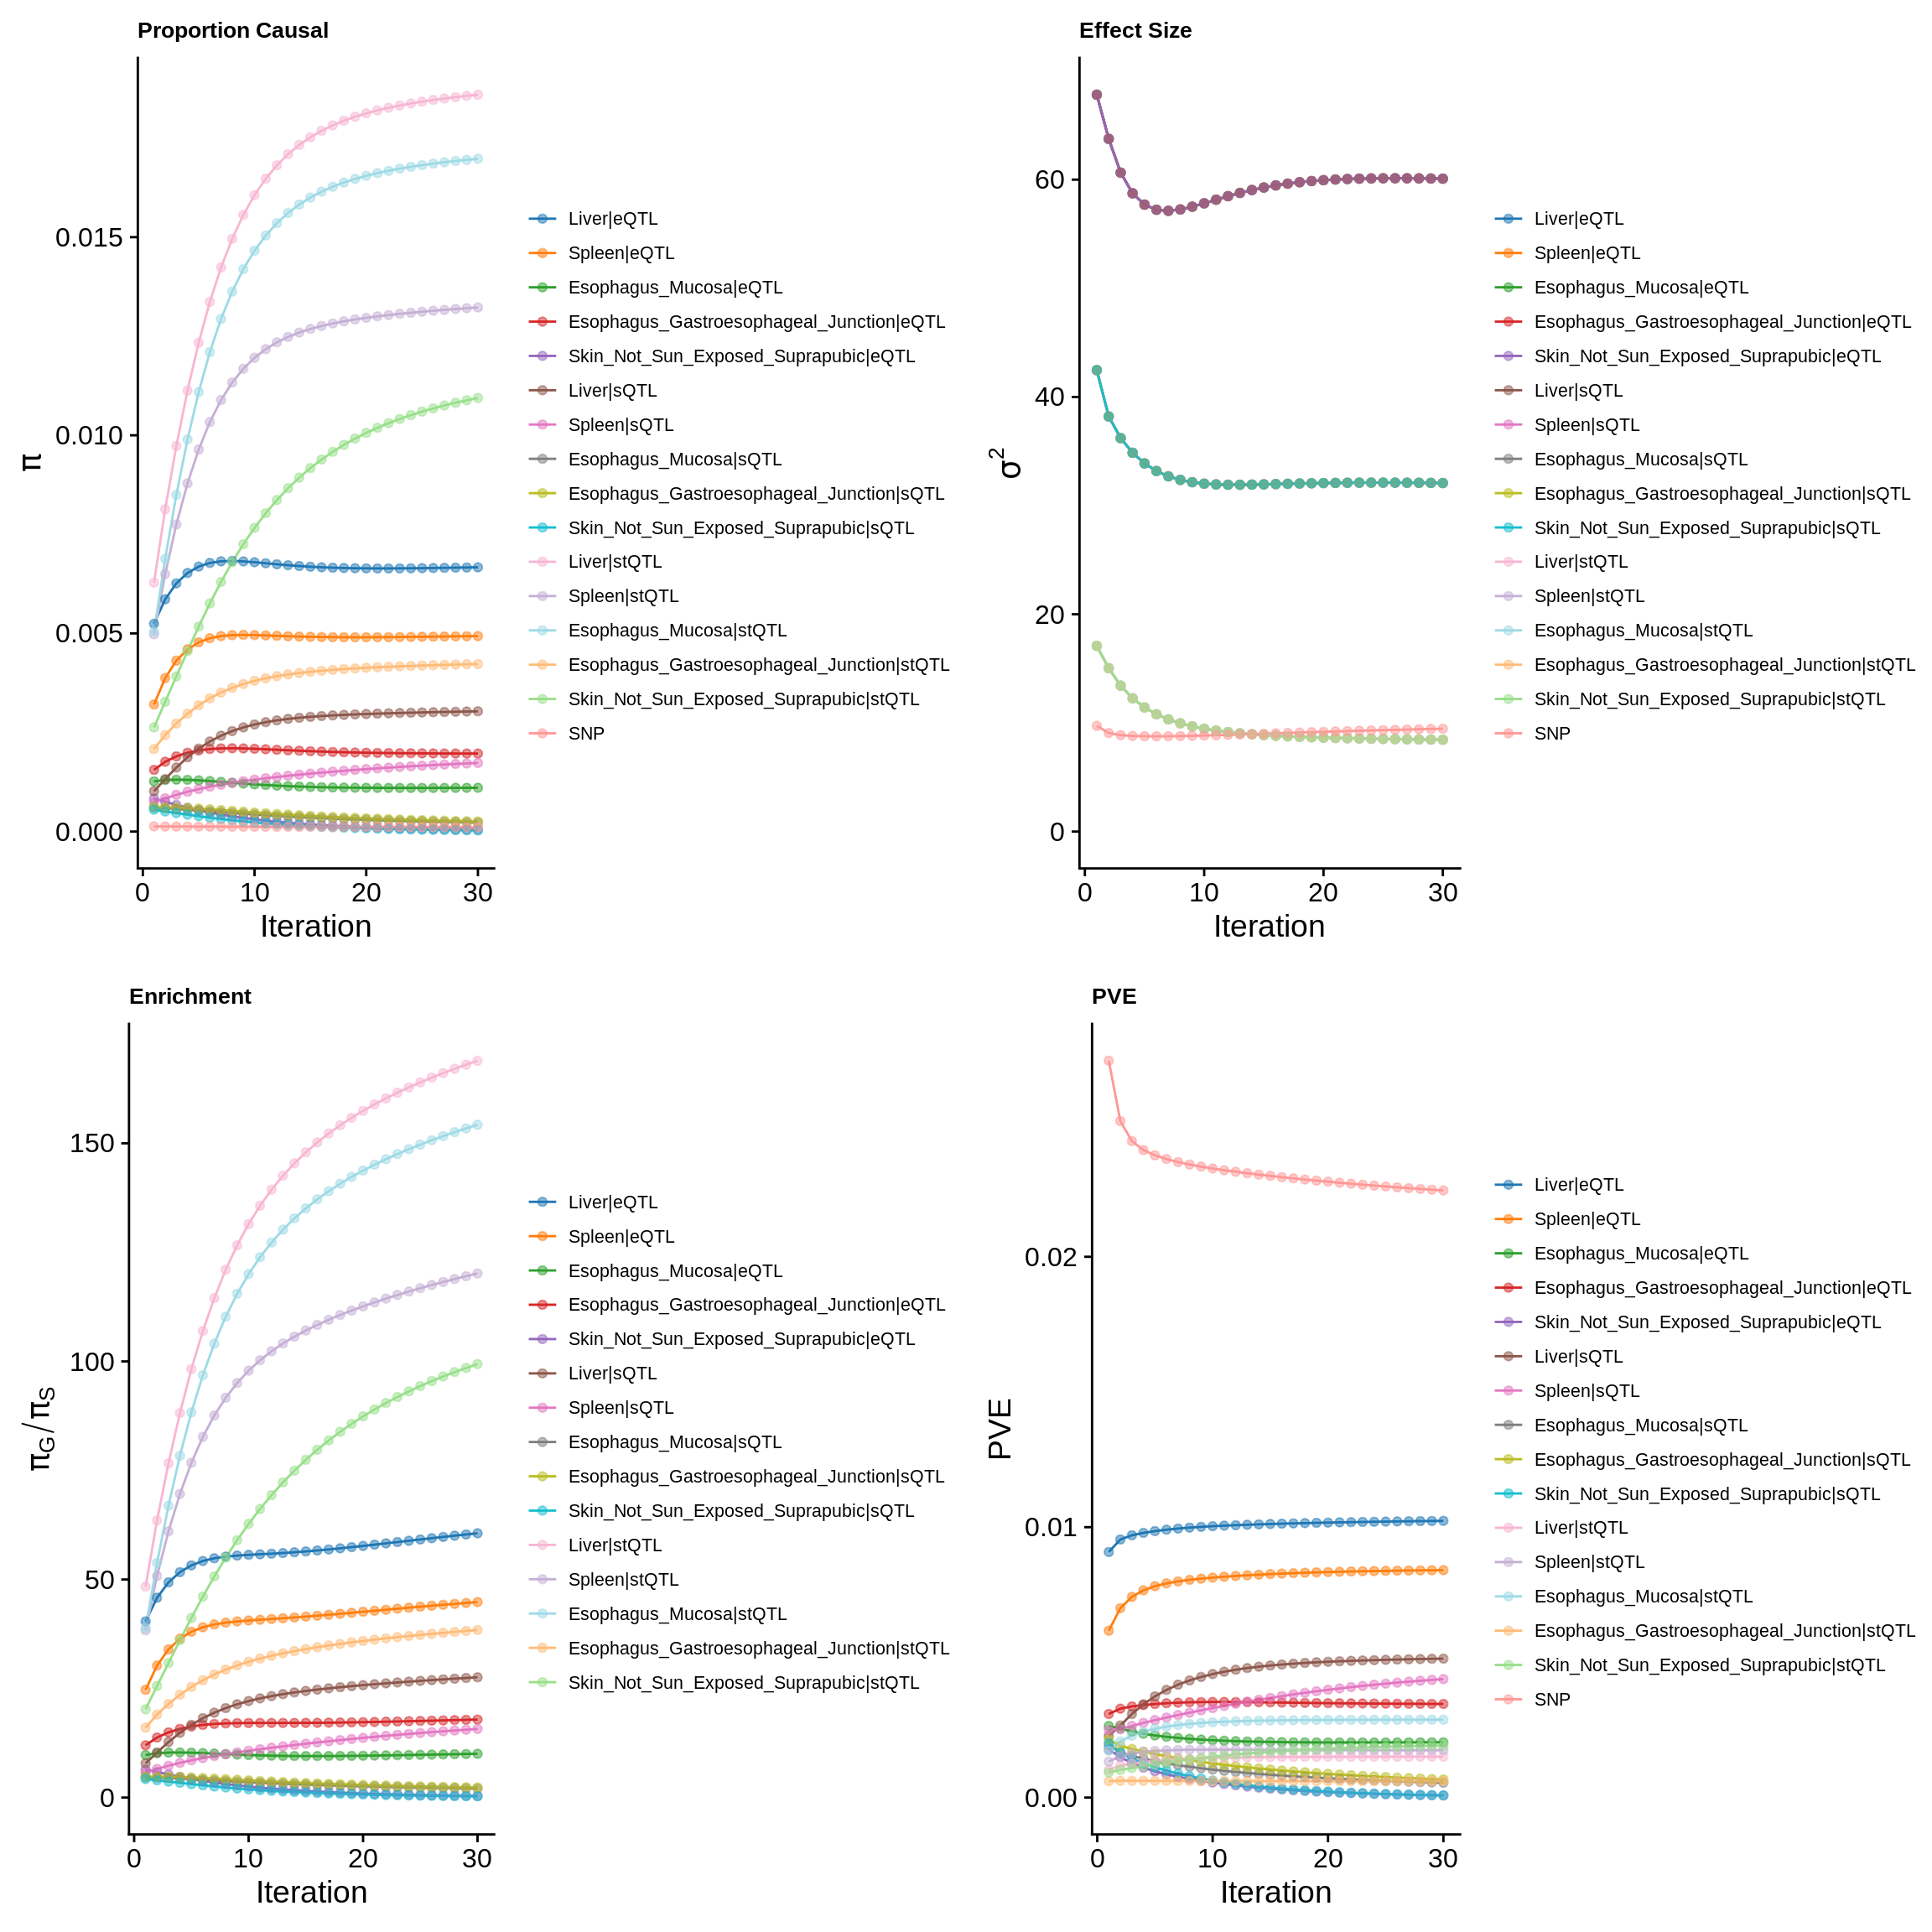
ctwas_parameters_multi <- summarize_param(param_multi, gwas_n)
pve_pie_by_type_multi <- plot_piechart(ctwas_parameters = ctwas_parameters_multi, colors = colors, by = "type")
pve_pie_by_context_multi <- plot_piechart(ctwas_parameters = ctwas_parameters_multi, colors = colors, by = "context")

gridExtra::grid.arrange(pve_pie_by_type_multi,pve_pie_by_context_multi, ncol = 2)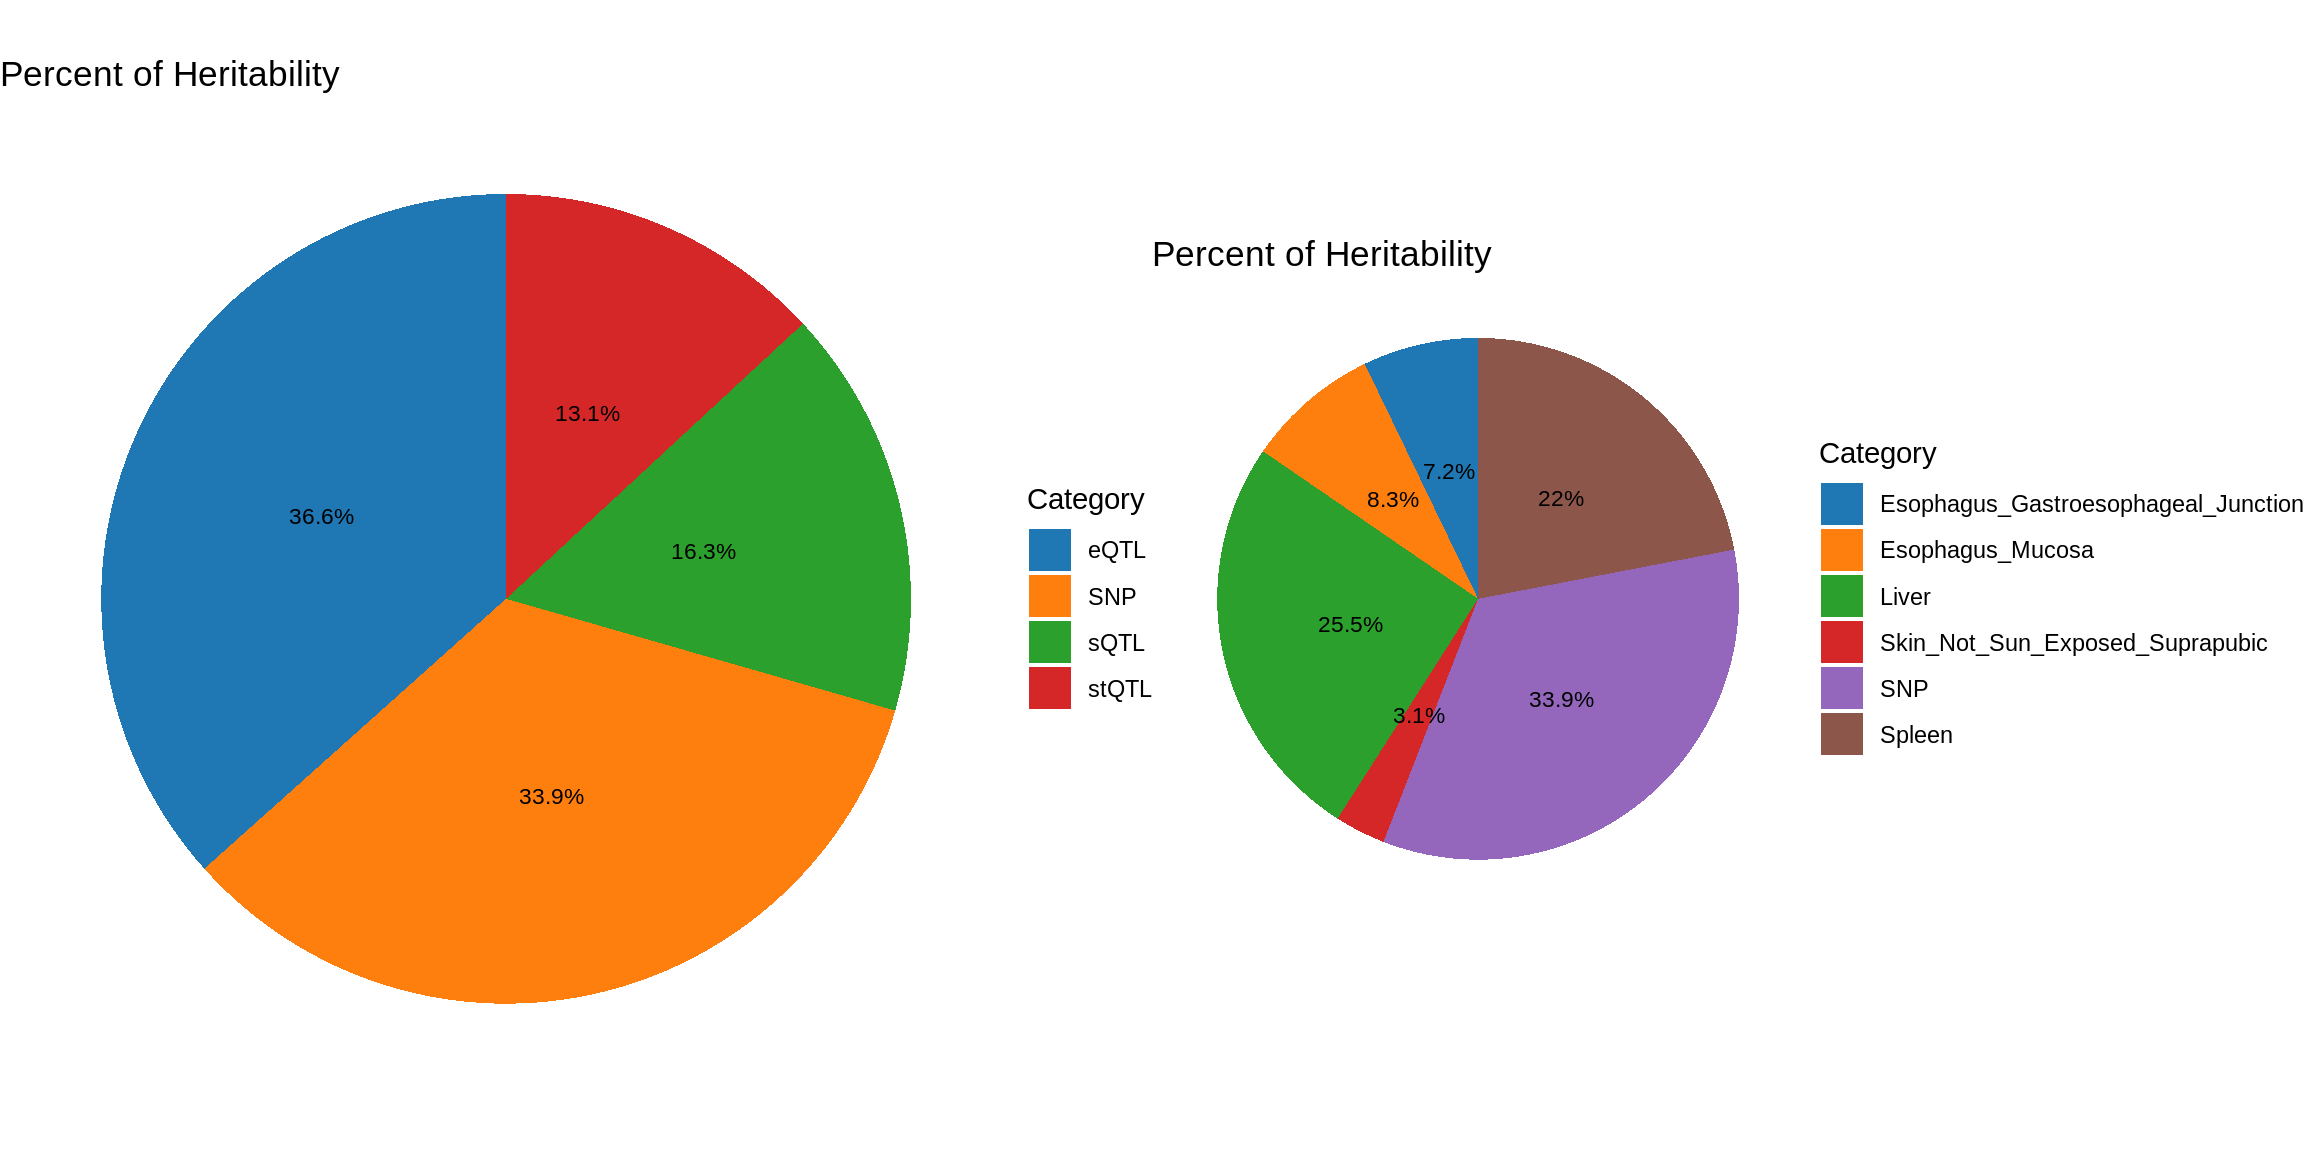
| Version | Author | Date |
|---|---|---|
| 4a84d72 | XSun | 2024-10-15 |
Postprocessing – LD mismatch
finemap_res_multi <- ctwas_res_multi$finemap_res
finemap_res_multi <- ctwas_res_multi$finemap_res

finemap_res_multi_gene <- finemap_res_multi[finemap_res_multi$type != "SNP",]

ggplot(data = finemap_res_multi_gene, aes(x= abs(z), y= susie_pip)) +
  geom_point() +
  ggtitle("Z scores vs PIP") +
  theme_minimal()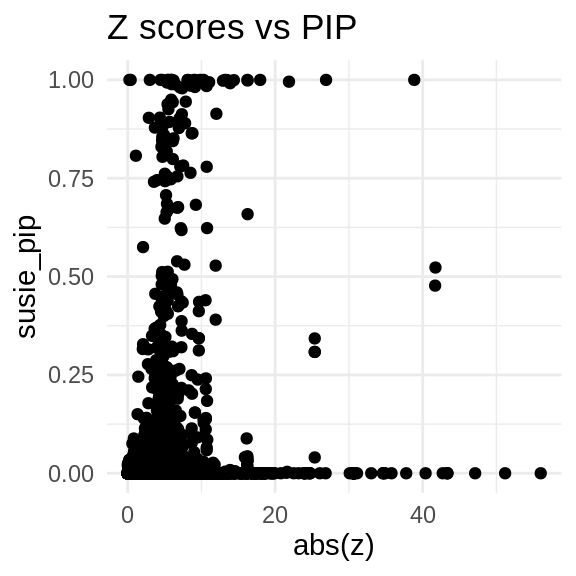
load(paste0("/project/xinhe/xsun/multi_group_ctwas/11.multi_group_1008/ld_mismatch/LD_mismatch_", trait,".rdata"))

sprintf("The number of problematic regions = %s", length(problematic_region_ids))
[1] "The number of problematic regions = 3"sprintf("The number of problematic genes = %s", length(problematic_genes))[1] "The number of problematic genes = 6"sprintf("The number of problematic snps = %s", length(res$problematic_snps))[1] "The number of problematic snps = 367"sprintf("The number of flipped snps = %s", length(res$flipped_snps))[1] "The number of flipped snps = 8"problematic_snps <- res$condz_stats[res$condz_stats$id %in% res$problematic_snps,]
DT::datatable(problematic_snps,caption = htmltools::tags$caption(style = 'caption-side: topleft; text-align = left; color:black;','Stats for problematic snps'),options = list(pageLength = 5) )finemap_origin_res_problematic_region <- finemap_res_multi[finemap_res_multi$id %in% problematic_genes,]
merge_origin_nold <- merge(finemap_origin_res_problematic_region,finemap_noLD_res_problematic_region, by = "id")
merge_origin_nold <- merge_origin_nold[,c("id","susie_pip.x","susie_pip.y")]
colnames(merge_origin_nold) <- c("id","susie_pip_origin","susie_pip_ld-mismatch-fixed")
DT::datatable(merge_origin_nold,caption = htmltools::tags$caption(style = 'caption-side: topleft; text-align = left; color:black;','Original PIP and fixed PIP for problematic genes'),options = list(pageLength = 5) )Fine-mapping (LD mis-match fixed)
susie_alpha_res_multi <- ctwas_res_multi$susie_alpha_res
rerun_finemap_res <- res$finemap_res
rerun_susie_alpha_res <- res$susie_alpha_res
res <- update_finemap_res(finemap_res_multi,
                          susie_alpha_res_multi,
                          rerun_finemap_res,
                          rerun_susie_alpha_res,
                          updated_region_ids = problematic_region_ids)

finemap_res_multi <- res$finemap_res
susie_alpha_res_multi <- res$susie_alpha_res

susie_alpha_res_multi <- anno_susie_alpha_res(susie_alpha_res_multi,
                                        mapping_table = mapping_two,
                                        map_by = "molecular_id",
                                        drop_unmapped = TRUE)
2024-11-26 14:48:41 INFO::Annotating susie alpha result ...
2024-11-26 14:48:42 INFO::Map molecular traits to genes
2024-11-26 14:48:42 INFO::Split PIPs for molecular traits mapped to multiple genescombined_pip_by_type_cs_multi <- combine_gene_pips(susie_alpha_res_multi,
group_by = "gene_name",
by = "type",
method = "combine_cs",
filter_cs = TRUE,
include_cs_id = T)
combined_pip_by_context_cs_multi <- combine_gene_pips(susie_alpha_res_multi,
group_by = "gene_name",
by = "context",
method = "combine_cs",
filter_cs = TRUE,
include_cs_id = T)
DT::datatable(combined_pip_by_type_cs_multi[combined_pip_by_type_cs_multi$combined_pip>0.8,],caption = htmltools::tags$caption( style = 'caption-side: topleft; text-align = left; color:black;','Combined PIP by omics'),options = list(pageLength = 5) )DT::datatable(combined_pip_by_context_cs_multi[combined_pip_by_context_cs_multi$combined_pip>0.8,],caption = htmltools::tags$caption( style = 'caption-side: topleft; text-align = left; color:black;','Combined PIP by tissue'),options = list(pageLength = 5) )combined_pip_by_group_multi <- combine_gene_pips(susie_alpha_res_multi,
group_by = "gene_name",
by = "group",
method = "combine_cs",
filter_cs = TRUE,
include_cs_id = F)
combined_pip_by_group_sig_multi <- combined_pip_by_group_multi[combined_pip_by_group_multi$combined_pip > 0.8,]
plot_heatmap(heatmap_data = combined_pip_by_group_sig_multi, main = "PIP partitions for genes with PIP>0.8")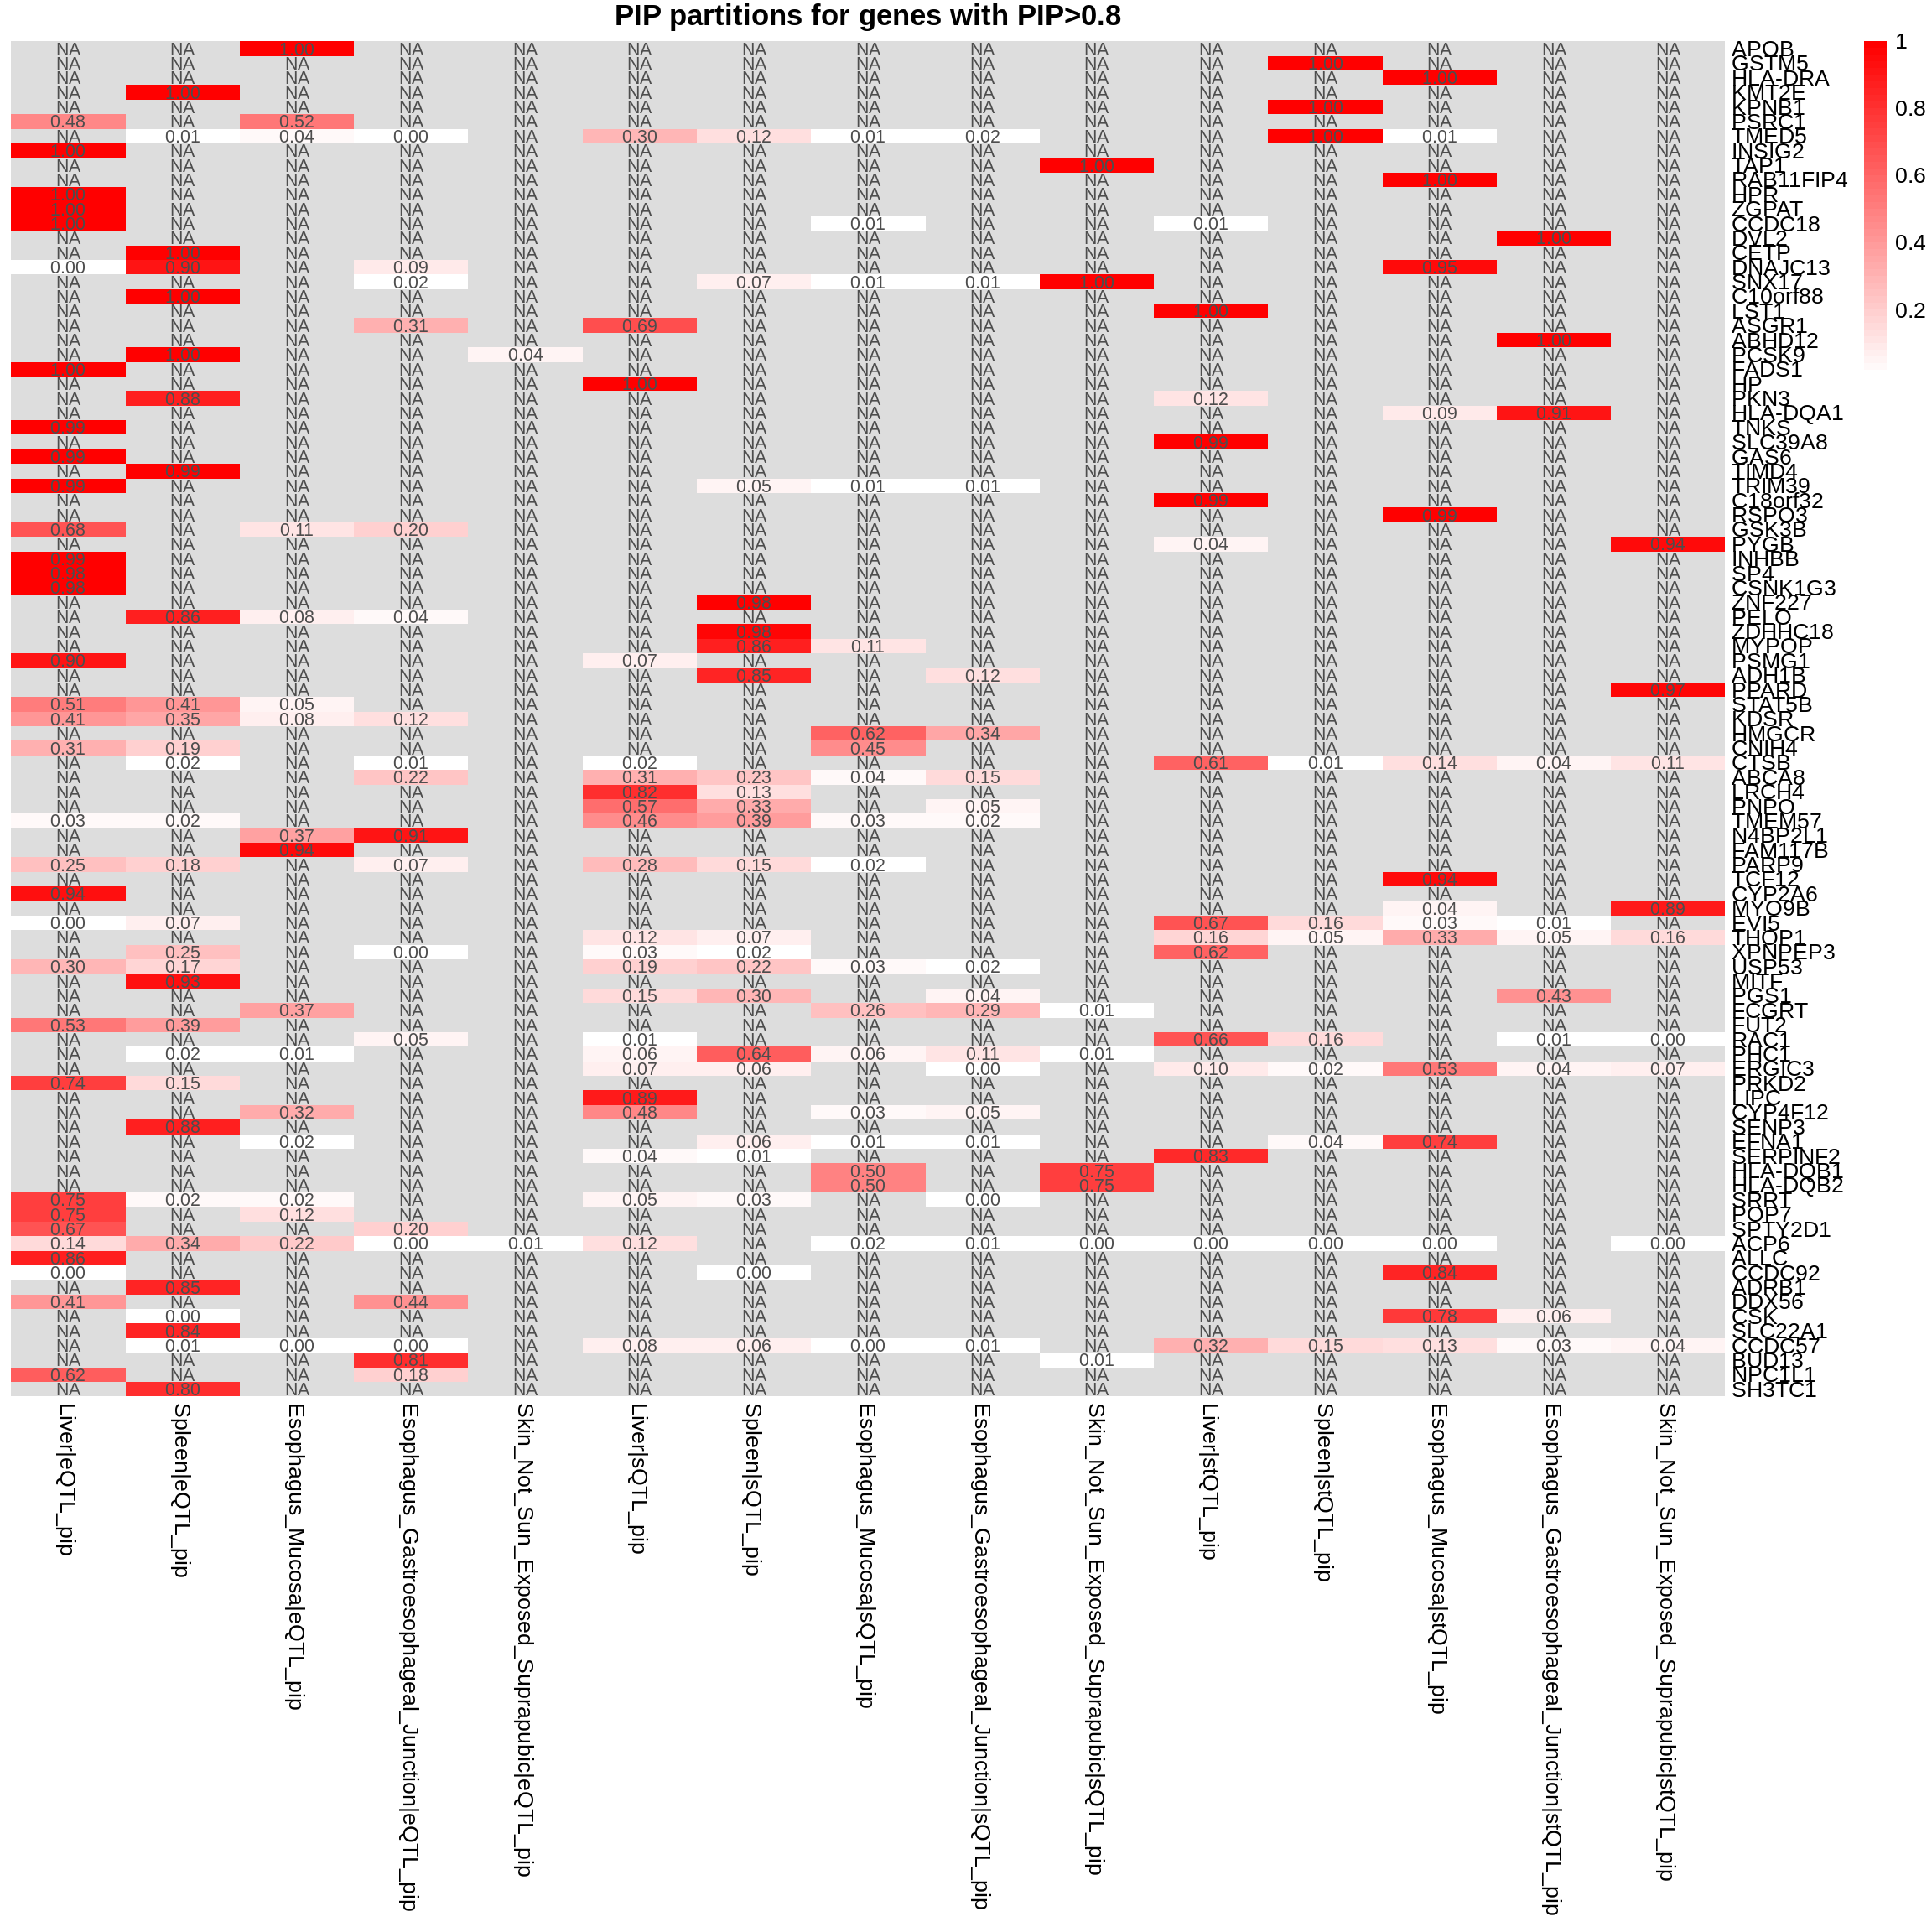
| Version | Author | Date |
|---|---|---|
| eb58424 | XSun | 2024-10-17 |
Comparing with single tissue + eQTL analysis
ctwas_res_single <- readRDS(paste0("/project/xinhe/xsun/multi_group_ctwas/10.single_tissue_1007/results/",trait,"/",tissue[1],"/",trait,"_",tissue[1], ".ctwas.res.RDS"))

susie_alpha_res_single <- ctwas_res_single$susie_alpha_res

susie_alpha_res_single <- anno_susie_alpha_res(susie_alpha_res_single,
                                        mapping_table = mapping_predictdb,
                                        map_by = "molecular_id",
                                        drop_unmapped = TRUE)
2024-11-26 14:48:55 INFO::Annotating susie alpha result ...
2024-11-26 14:48:55 INFO::Map molecular traits to genescombined_pip_by_type_single <- combine_gene_pips(susie_alpha_res_single,
group_by = "gene_name",
by = "type",
method = "combine_cs",
filter_cs = TRUE,
include_cs_id = F)
combined_pip_by_type_sig_single <- combined_pip_by_type_single[combined_pip_by_type_single$combined_pip > 0.8,]
combined_pip_by_type_sig_multi <- combined_pip_by_type_cs_multi[combined_pip_by_type_cs_multi$combined_pip > 0.8,]
sprintf("Number of genes with PIP > 0.8 -- Multi-group = %s", nrow(combined_pip_by_type_sig_multi))[1] "Number of genes with PIP > 0.8 -- Multi-group = 93"sprintf("Number of genes with PIP > 0.8 -- single eQTL = %s", nrow(combined_pip_by_type_sig_single))[1] "Number of genes with PIP > 0.8 -- single eQTL = 31"sprintf("Number of overlapped genes = %s", sum(combined_pip_by_type_sig_single$gene_name %in% combined_pip_by_type_sig_multi$gene_name))[1] "Number of overlapped genes = 28"genes_not_reported <- combined_pip_by_type_sig_single$gene_name[!combined_pip_by_type_sig_single$gene_name %in%combined_pip_by_type_sig_multi$gene_name]
DT::datatable(combined_pip_by_type_sig_single[combined_pip_by_type_sig_single$gene_name %in% genes_not_reported,],caption = htmltools::tags$caption( style = 'caption-side: topleft; text-align = left; color:black;','Genes not reported by multi-group analysis'),options = list(pageLength = 5) )DT::datatable(combined_pip_by_type_cs_multi[combined_pip_by_type_cs_multi$gene_name %in% genes_not_reported,],caption = htmltools::tags$caption( style = 'caption-side: topleft; text-align = left; color:black;','Genes not reported by multi-group analysis'),options = list(pageLength = 5) )gene_multi_unique_type <- combined_pip_by_group_sig_multi[!combined_pip_by_group_sig_multi$gene_name %in% combined_pip_by_type_sig_single$gene_name,]
plot_heatmap(heatmap_data = gene_multi_unique_type, main = "PIP partition for unique genes found by multi-group analysis")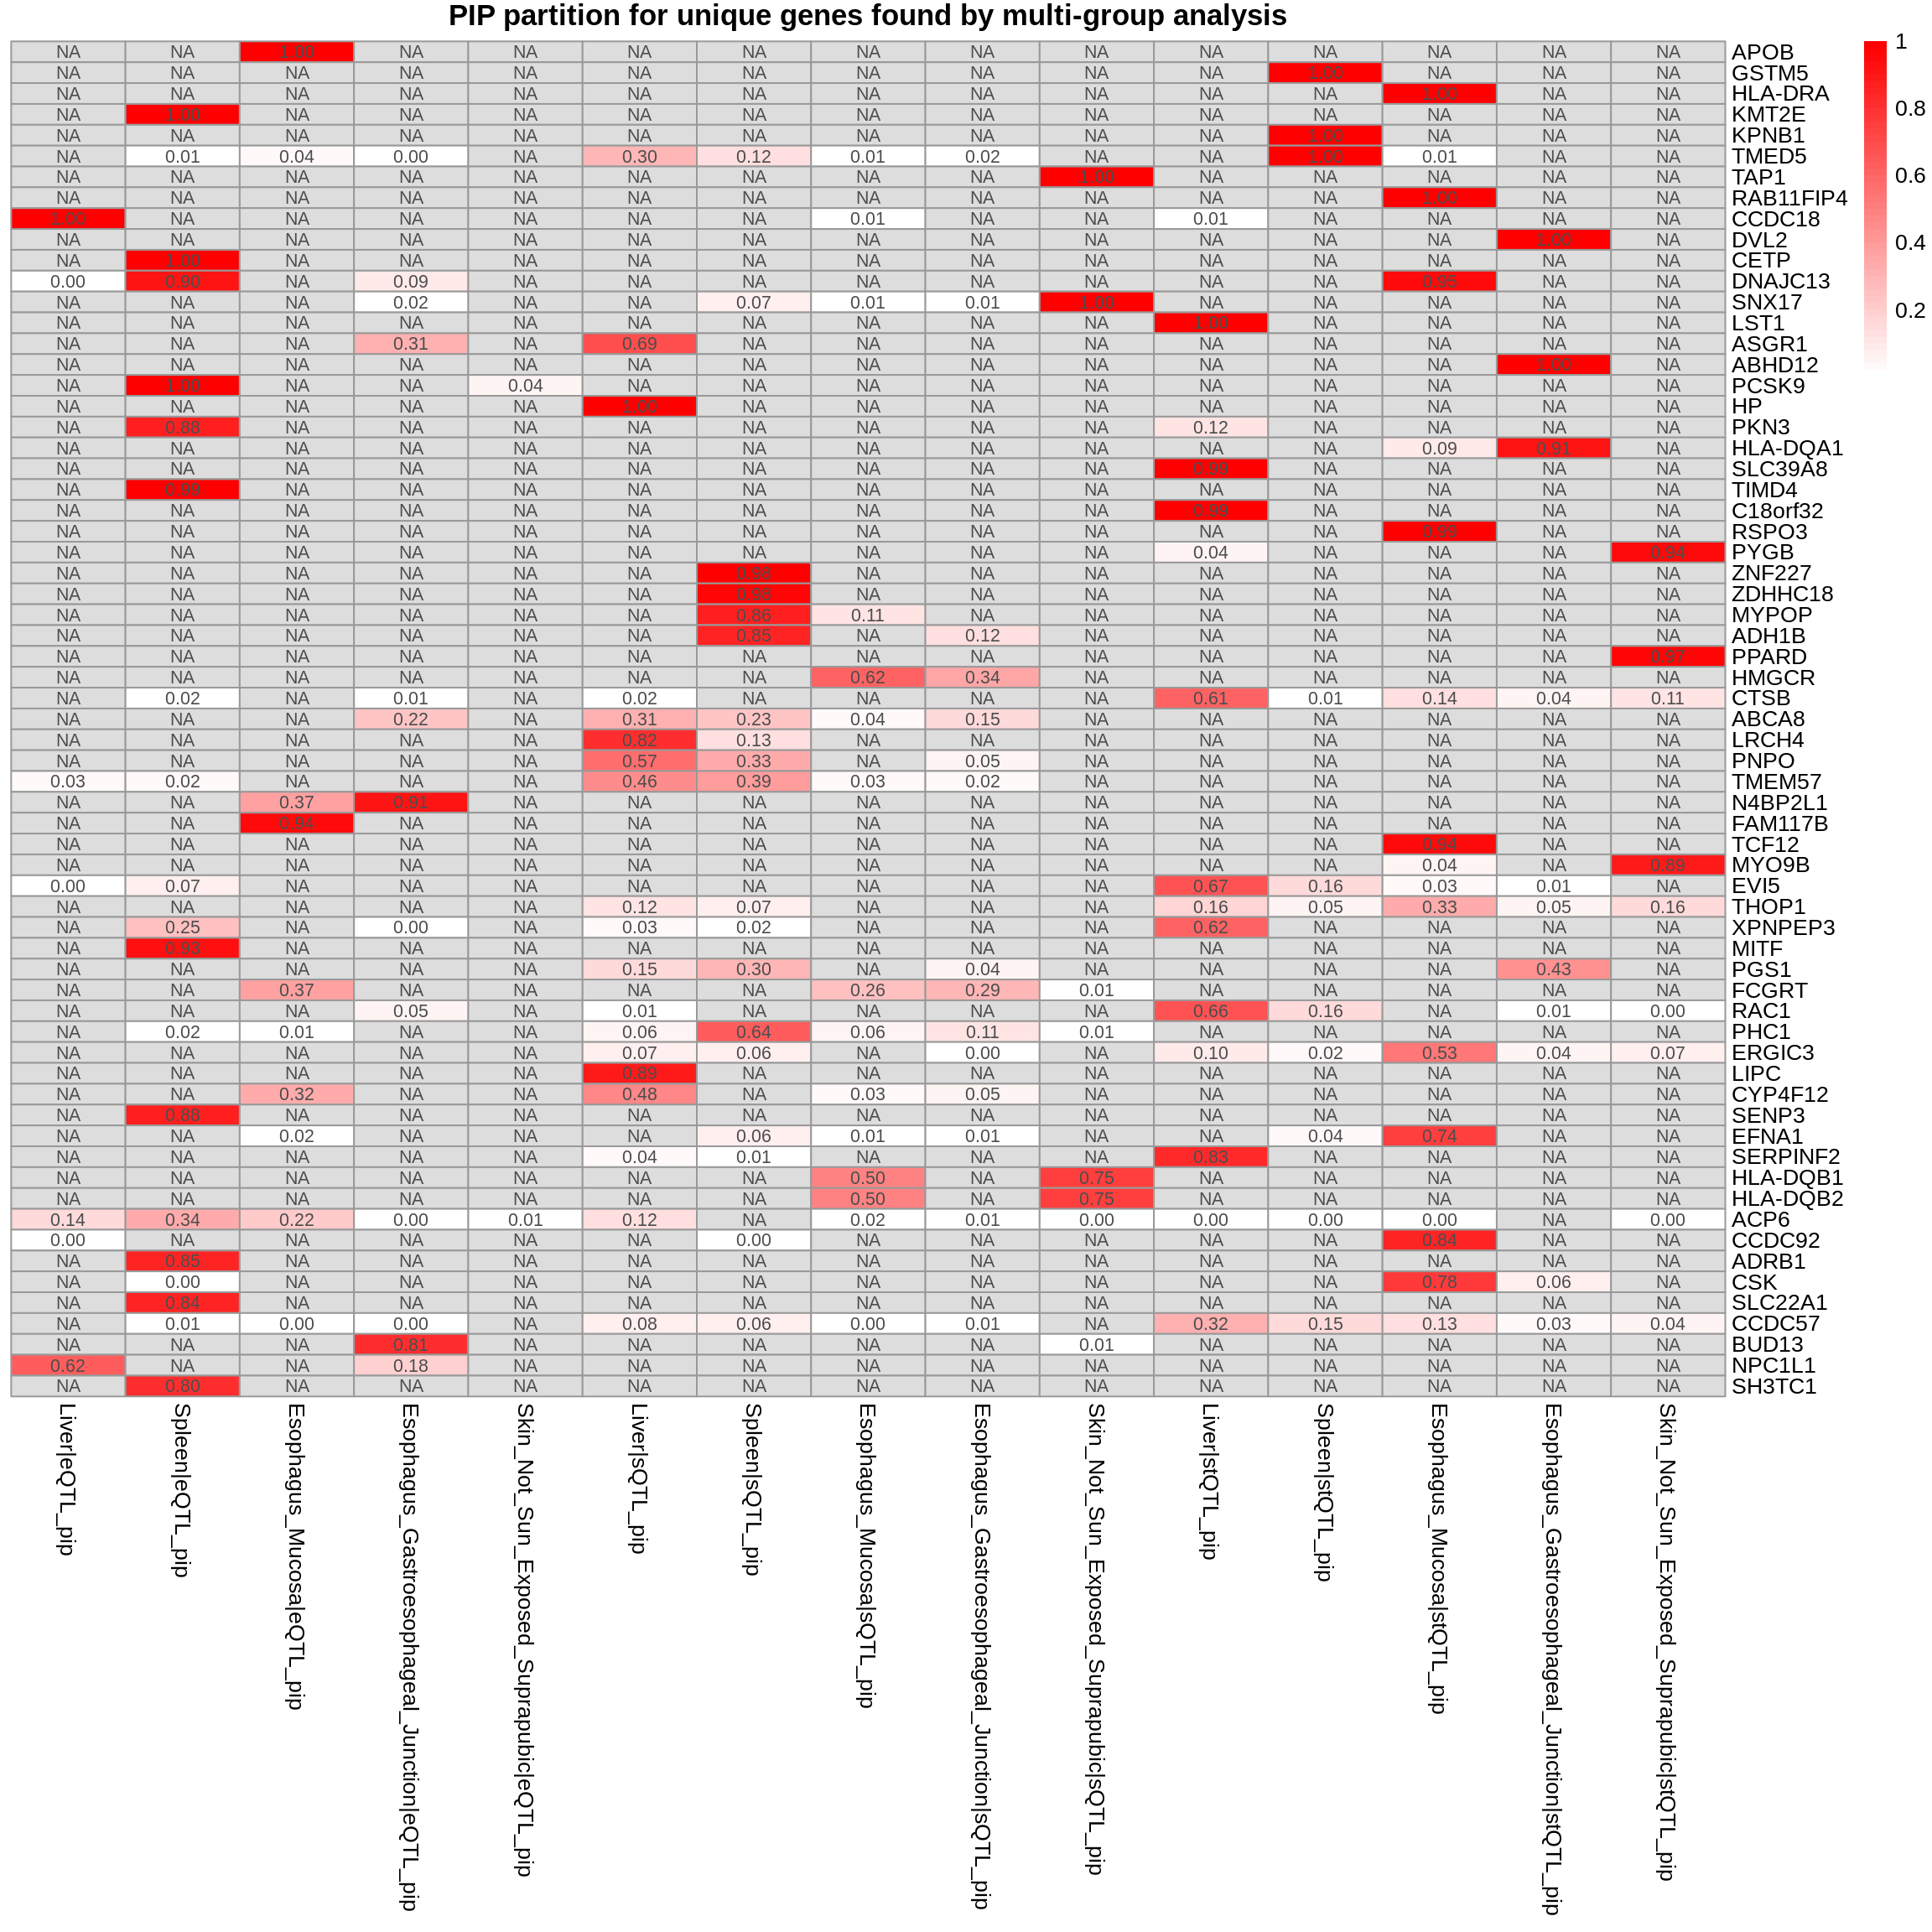
| Version | Author | Date |
|---|---|---|
| eb58424 | XSun | 2024-10-17 |
snp_map_single <- readRDS(paste0("/project/xinhe/xsun/multi_group_ctwas/10.single_tissue_1007/results/",trait,"/",tissue[1],"/",trait,"_",tissue[1], ".snp_map.RDS"))
weights_single <- readRDS(paste0("/project/xinhe/xsun/multi_group_ctwas/10.single_tissue_1007/results/",trait,"/",tissue[1],"/",trait,"_",tissue[1], ".preprocessed.weights.RDS"))

finemap_res_single <- ctwas_res_single$finemap_res
finemap_res_single$molecular_id <- get_molecular_ids(finemap_res_single)
finemap_res_single <- anno_finemap_res(finemap_res_single,
                                snp_map = snp_map_single,
                                mapping_table = mapping_two,
                                add_gene_annot = TRUE,
                                map_by = "molecular_id",
                                drop_unmapped = TRUE,
                                add_position = TRUE,
                                use_gene_pos = "mid")
2024-11-26 14:49:09 INFO::Annotating fine-mapping result ...
2024-11-26 14:49:09 INFO::Map molecular traits to genes
2024-11-26 14:49:12 INFO::Add gene positions
2024-11-26 14:49:13 INFO::Add SNP positionsmake_locusplot(finemap_res_single,
region_id = "1_22760390_23594100",
ens_db = ens_db,
weights = weights_single,
highlight_pip = 0.8,
filter_protein_coding_genes = TRUE,
filter_cs = TRUE,
color_pval_by = "cs",
color_pip_by = "cs")2024-11-26 14:49:19 INFO::Limit to protein coding genes
2024-11-26 14:49:19 INFO::focal id: ENSG00000088280.18|Liver_eQTL
2024-11-26 14:49:19 INFO::focal molecular trait: ASAP3 Liver eQTL
2024-11-26 14:49:19 INFO::Range of locus: chr1:22760290-23591317
2024-11-26 14:49:20 INFO::focal molecular trait QTL positions: 23484588,23484995
2024-11-26 14:49:20 INFO::Limit PIPs to credible sets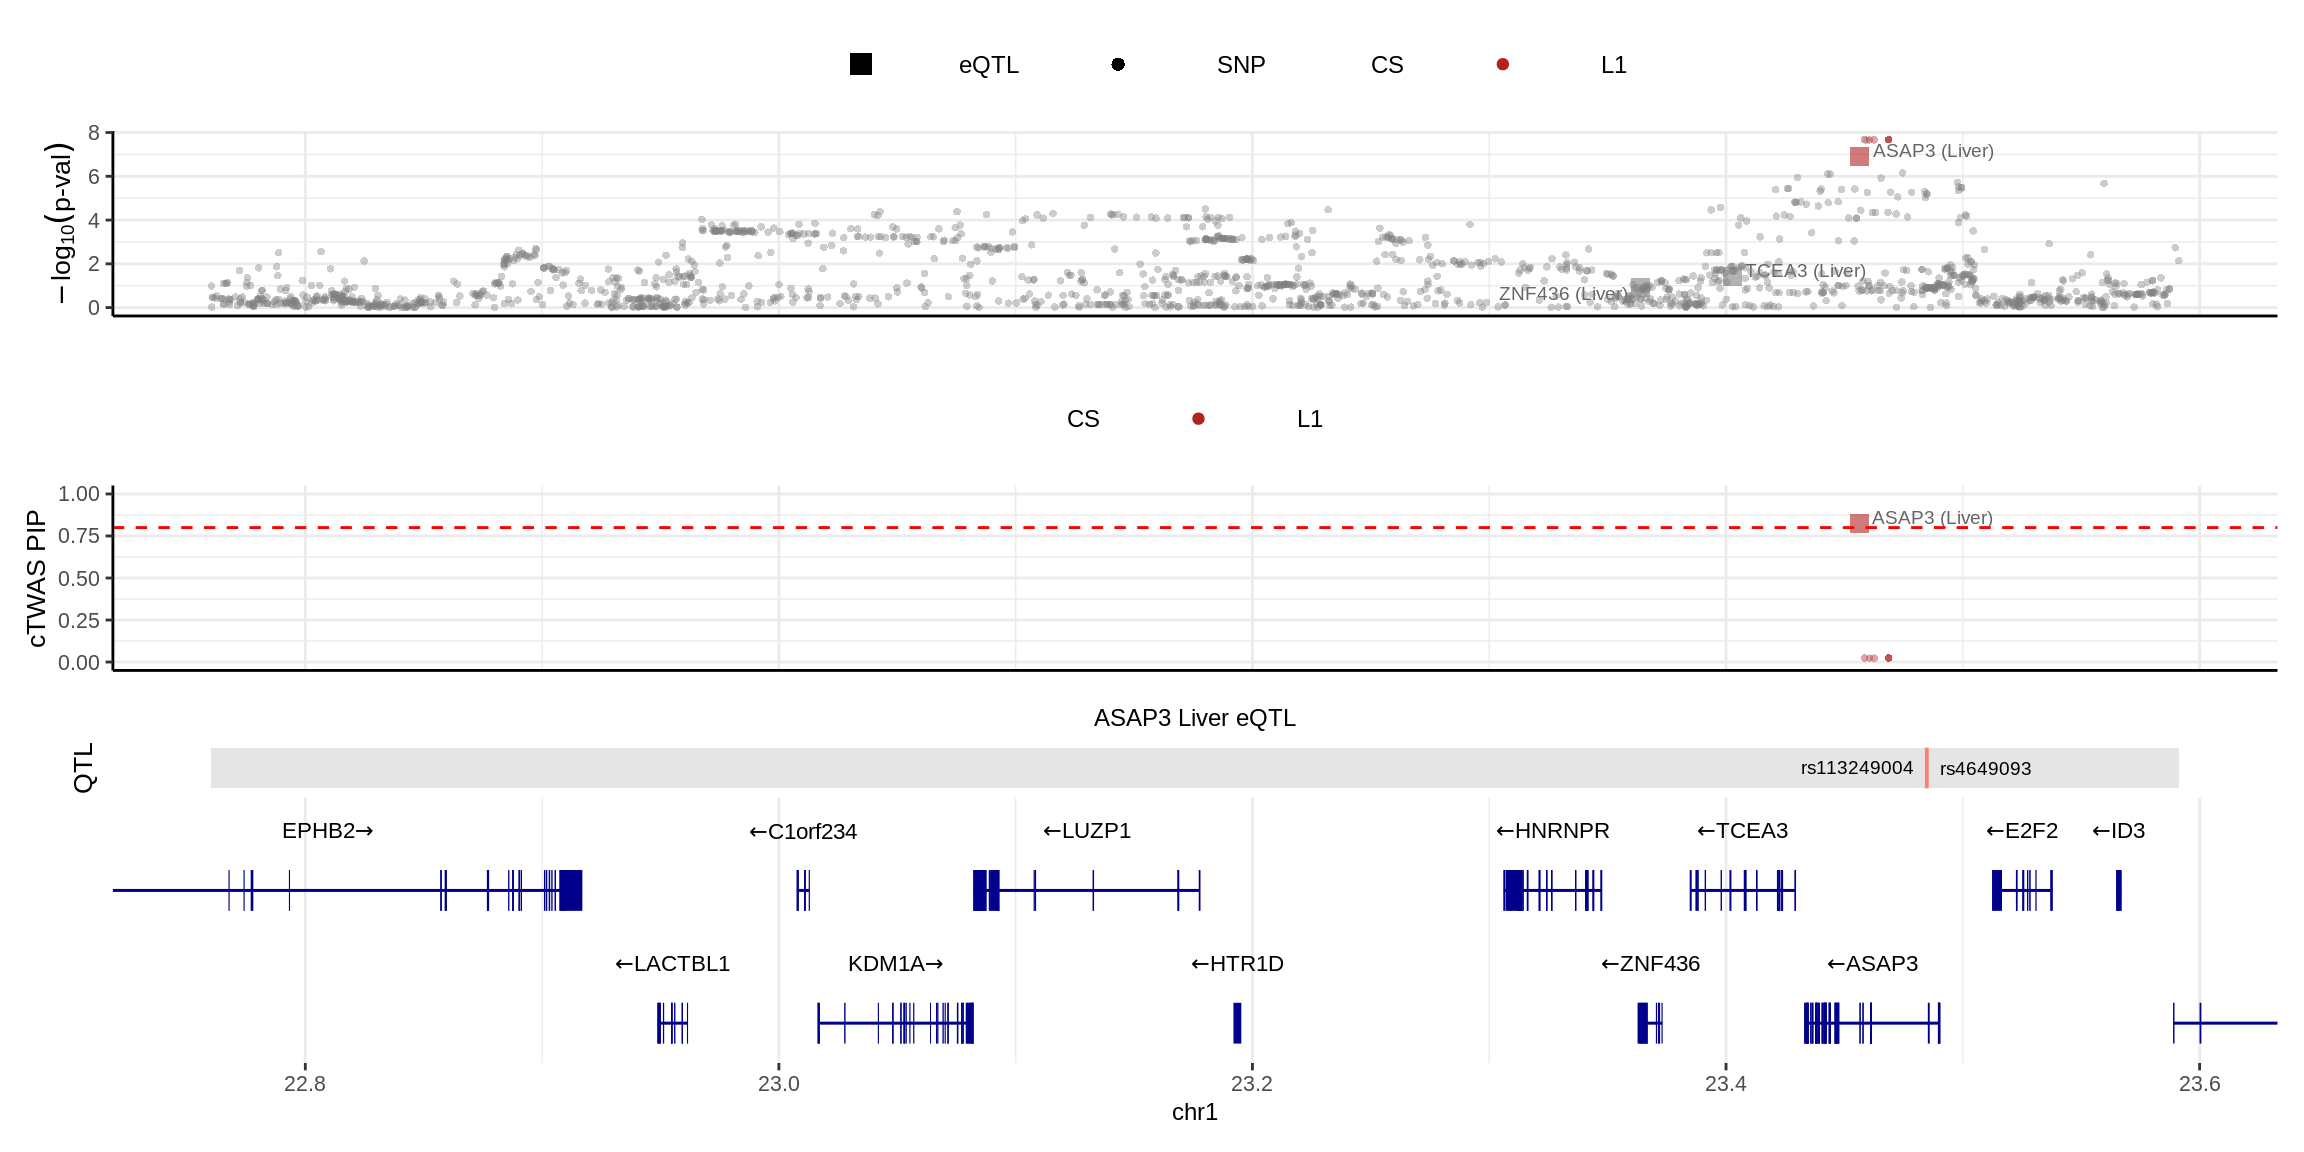
snp_map_multi <- readRDS(paste0(results_dir_multi,trait,".snp_map.RDS"))
weights_multi <- readRDS(paste0(results_dir_multi,trait,".preprocessed.weights.RDS"))

finemap_res_multi <- ctwas_res_multi$finemap_res
finemap_res_multi$molecular_id <- get_molecular_ids(finemap_res_multi)
finemap_res_multi <- anno_finemap_res(finemap_res_multi,
                                snp_map = snp_map_multi,
                                mapping_table = mapping_two,
                                add_gene_annot = TRUE,
                                map_by = "molecular_id",
                                drop_unmapped = TRUE,
                                add_position = TRUE,
                                use_gene_pos = "mid")
2024-11-26 14:49:37 INFO::Annotating fine-mapping result ...
2024-11-26 14:49:37 INFO::Map molecular traits to genes
2024-11-26 14:49:38 INFO::Split PIPs for molecular traits mapped to multiple genes
2024-11-26 14:49:45 INFO::Add gene positions
2024-11-26 14:49:45 INFO::Add SNP positionsmake_locusplot(finemap_res_multi,
region_id = "1_22760390_23594100",
ens_db = ens_db,
weights = weights_multi,
highlight_pip = 0.8,
filter_protein_coding_genes = TRUE,
filter_cs = TRUE,
color_pval_by = "cs",
color_pip_by = "cs")2024-11-26 14:49:49 INFO::Limit to protein coding genes
2024-11-26 14:49:49 INFO::focal id: ENSG00000088280.18|Liver_eQTL
2024-11-26 14:49:49 INFO::focal molecular trait: ASAP3 Liver eQTL
2024-11-26 14:49:49 INFO::Range of locus: chr1:22491404-23591317
2024-11-26 14:49:50 INFO::focal molecular trait QTL positions: 23484588,23484995
2024-11-26 14:49:50 INFO::Limit PIPs to credible sets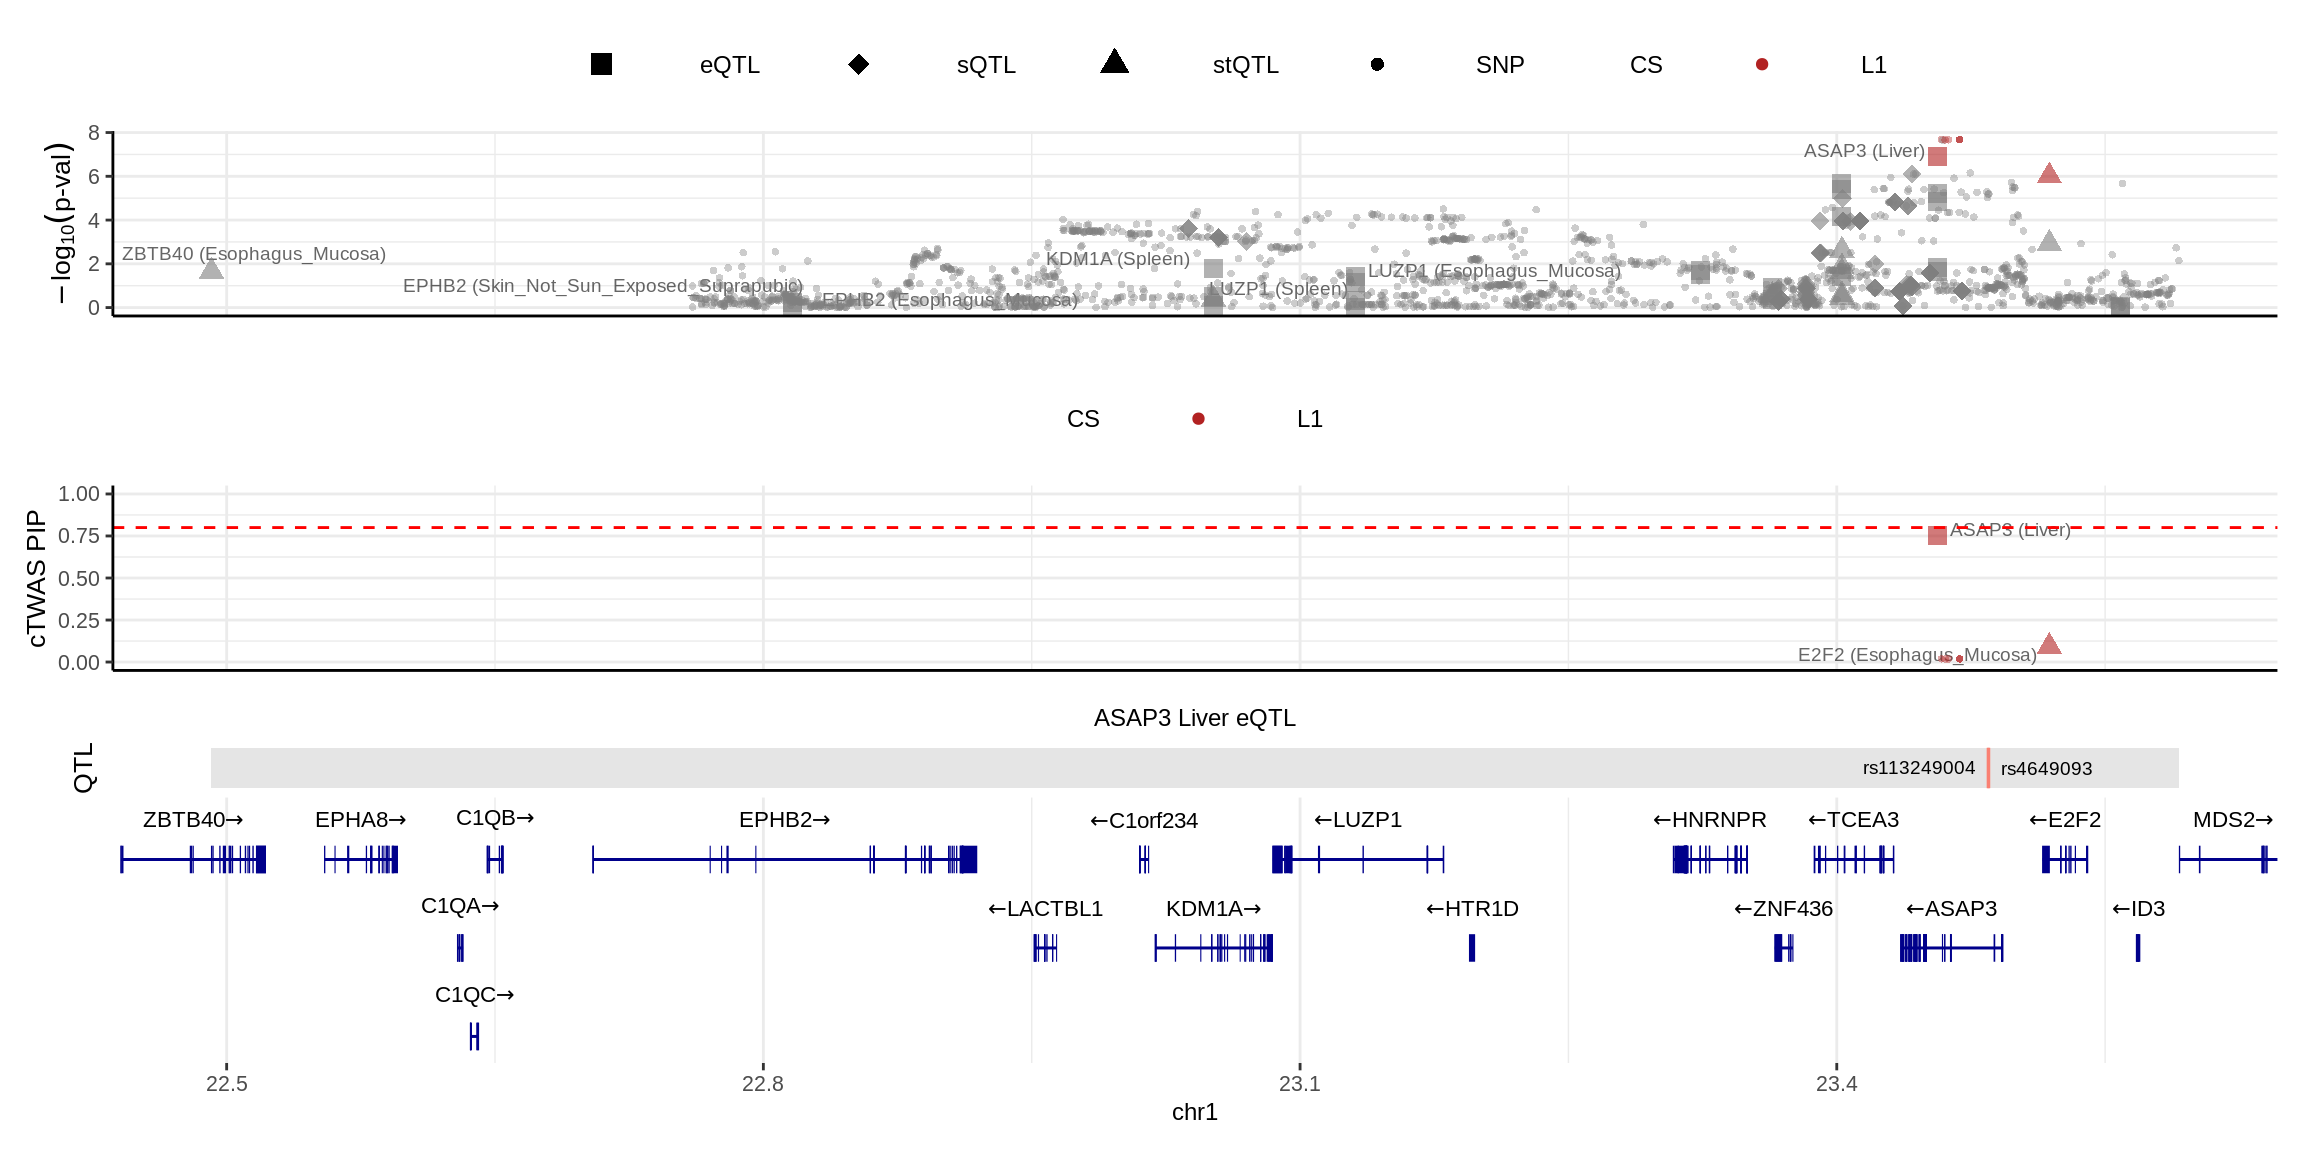
make_locusplot(finemap_res_single,
               region_id = "1_61456693_62989418",
               ens_db = ens_db,
               weights = weights_single,
               highlight_pip = 0.8,
               filter_protein_coding_genes = TRUE,
               filter_cs = TRUE,
               color_pval_by = "cs",
               color_pip_by = "cs")
2024-11-26 14:49:54 INFO::Limit to protein coding genes
2024-11-26 14:49:54 INFO::focal id: ENSG00000162607.12|Liver_eQTL
2024-11-26 14:49:54 INFO::focal molecular trait: USP1 Liver eQTL
2024-11-26 14:49:54 INFO::Range of locus: chr1:61459304-62989160
2024-11-26 14:49:55 INFO::focal molecular trait QTL positions: 62436136
2024-11-26 14:49:55 INFO::Limit PIPs to credible sets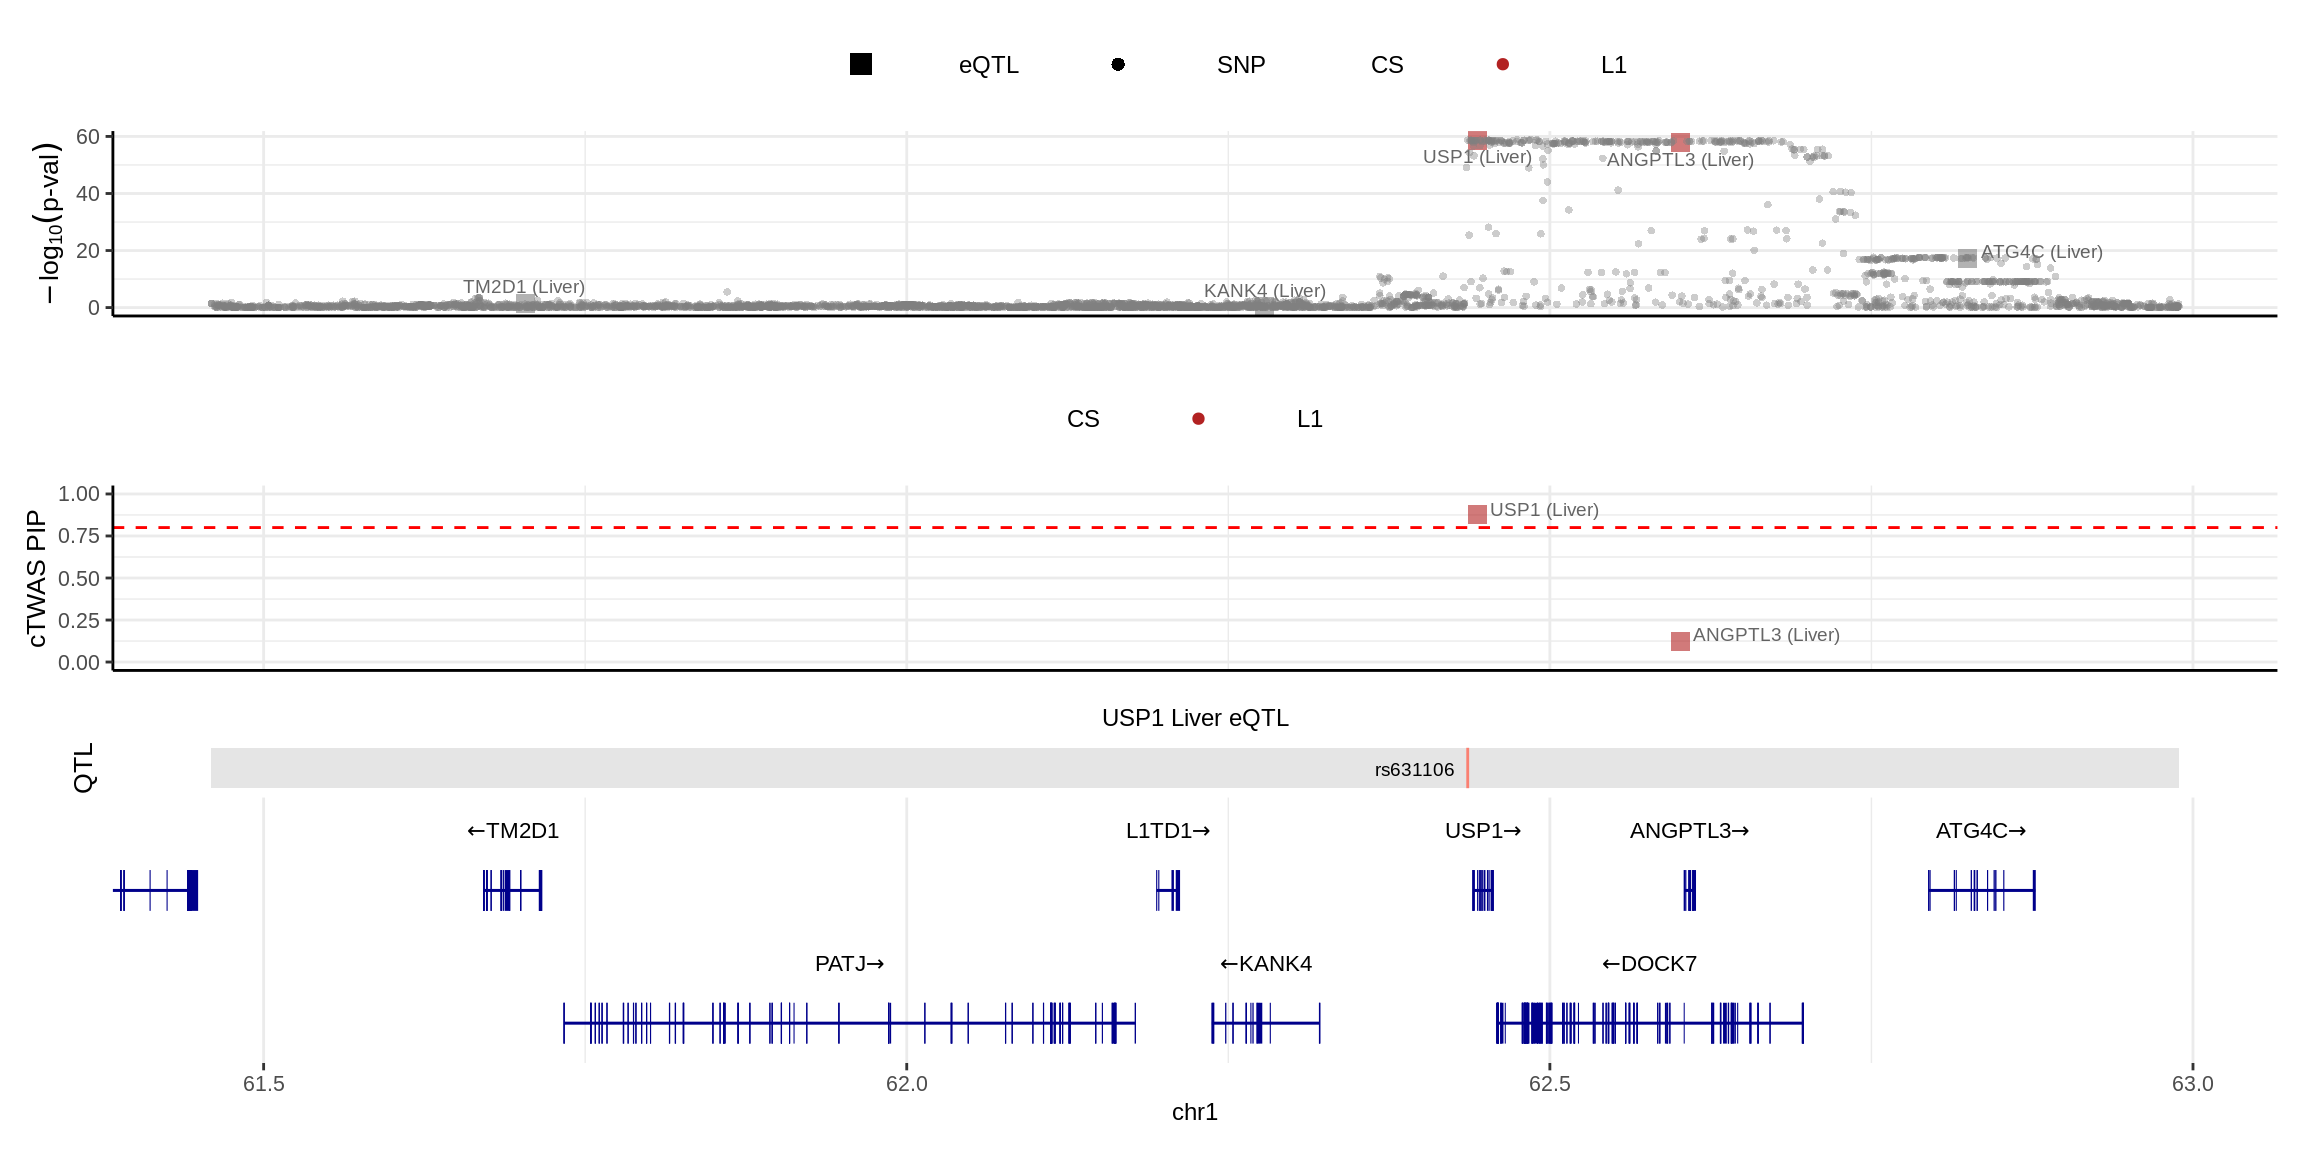
| Version | Author | Date |
|---|---|---|
| eb58424 | XSun | 2024-10-17 |
make_locusplot(finemap_res_multi,
               region_id = "1_61456693_62989418",
               ens_db = ens_db,
               weights = weights_multi,
               highlight_pip = 0.8,
               filter_protein_coding_genes = TRUE,
               filter_cs = TRUE,
               color_pval_by = "cs",
               color_pip_by = "cs")
2024-11-26 14:49:56 INFO::Limit to protein coding genes
2024-11-26 14:49:56 INFO::focal id: ENSG00000162607.12|Liver_eQTL
2024-11-26 14:49:56 INFO::focal molecular trait: USP1 Liver eQTL
2024-11-26 14:49:56 INFO::Range of locus: chr1:61459304-62989160
2024-11-26 14:49:57 INFO::focal molecular trait QTL positions: 62436136
2024-11-26 14:49:57 INFO::Limit PIPs to credible sets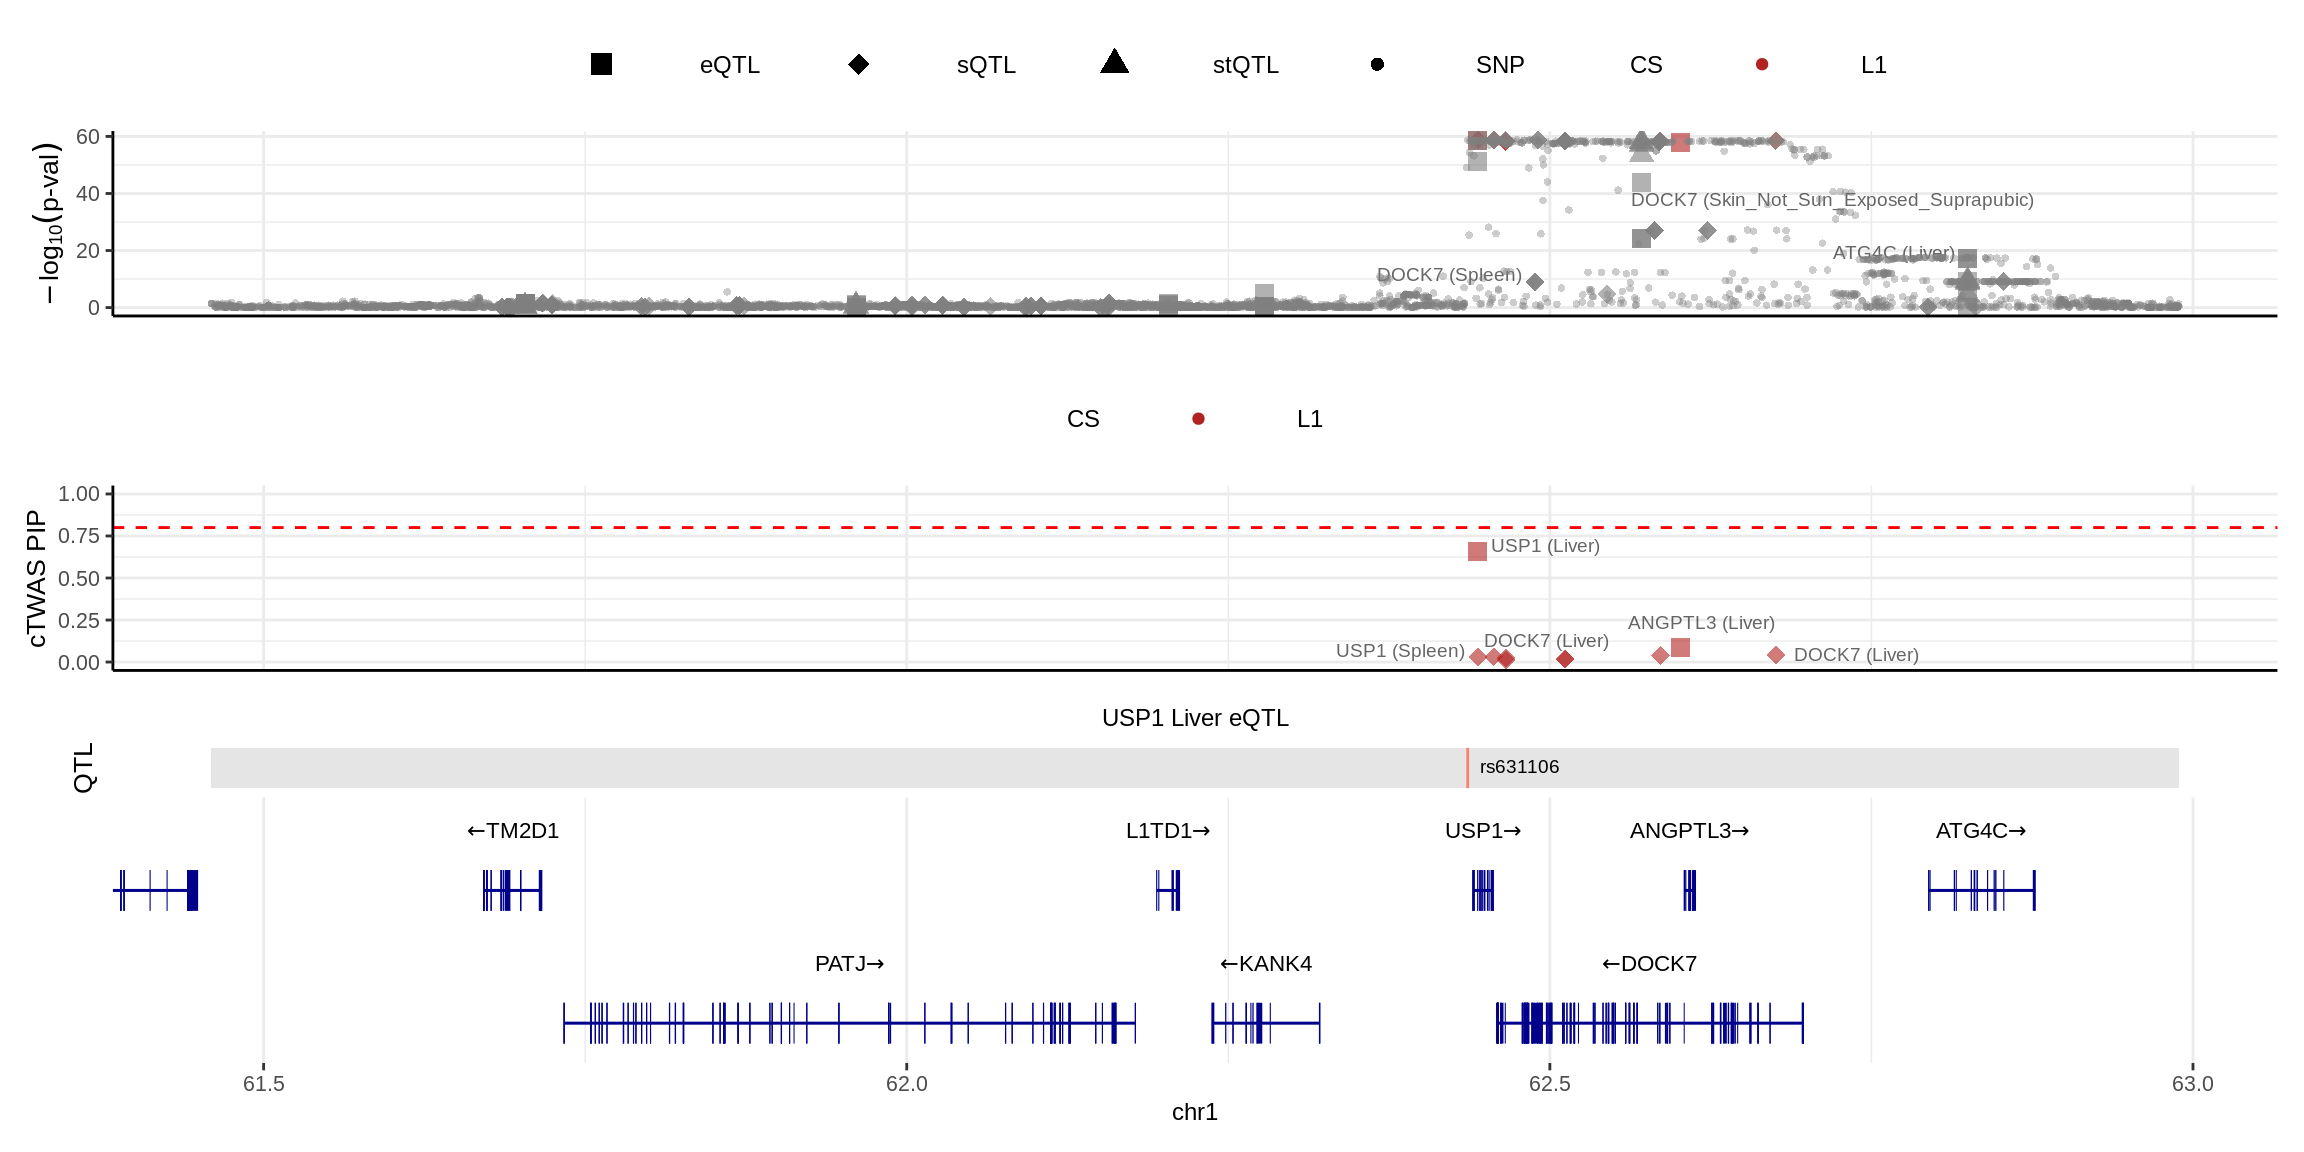
make_locusplot(finemap_res_single,
               region_id = "10_98908643_101189482",
               ens_db = ens_db,
               weights = weights_single,
               highlight_pip = 0.8,
               filter_protein_coding_genes = TRUE,
               filter_cs = TRUE,
               color_pval_by = "cs",
               color_pip_by = "cs")
2024-11-26 14:49:59 INFO::Limit to protein coding genes
2024-11-26 14:49:59 INFO::focal id: ENSG00000095485.16|Liver_eQTL
2024-11-26 14:49:59 INFO::focal molecular trait: CWF19L1 Liver eQTL
2024-11-26 14:49:59 INFO::Range of locus: chr10:98908543-101189277
2024-11-26 14:49:59 INFO::focal molecular trait QTL positions: 100267231,100267650
2024-11-26 14:49:59 INFO::Limit PIPs to credible sets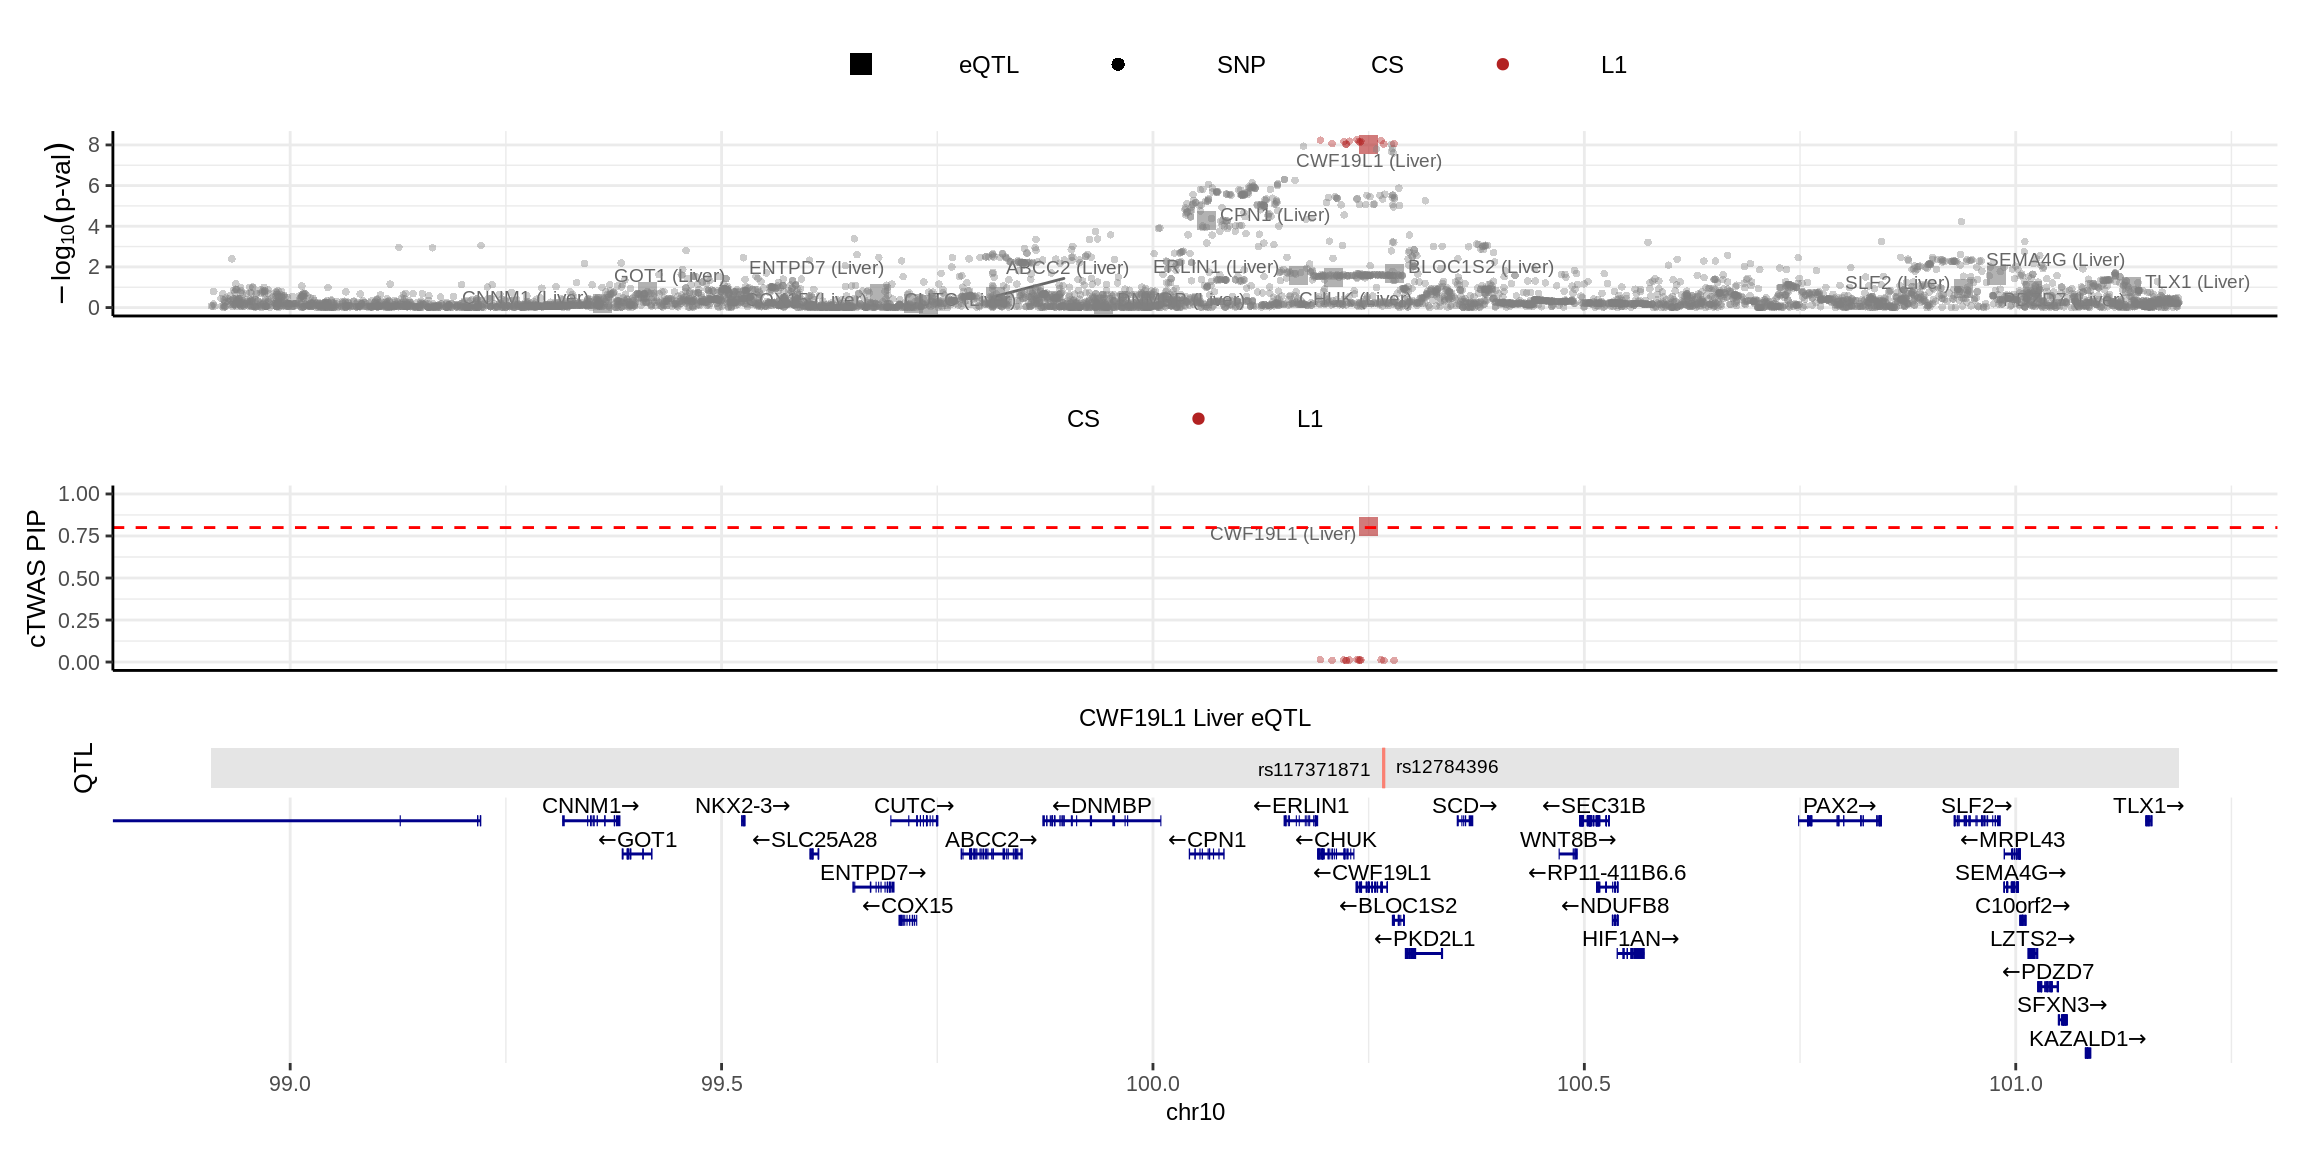
make_locusplot(finemap_res_multi,
               region_id = "10_98908643_101189482",
               ens_db = ens_db,
               weights = weights_multi,
               highlight_pip = 0.8,
               filter_protein_coding_genes = TRUE,
               filter_cs = TRUE,
               color_pval_by = "cs",
               color_pip_by = "cs")
2024-11-26 14:50:01 INFO::Limit to protein coding genes
2024-11-26 14:50:01 INFO::focal id: ENSG00000095485.16|Spleen_eQTL
2024-11-26 14:50:01 INFO::focal molecular trait: CWF19L1 Spleen eQTL
2024-11-26 14:50:01 INFO::Range of locus: chr10:98846370-101189277
2024-11-26 14:50:02 INFO::focal molecular trait QTL positions: 100267650,100268161
2024-11-26 14:50:02 INFO::Limit PIPs to credible sets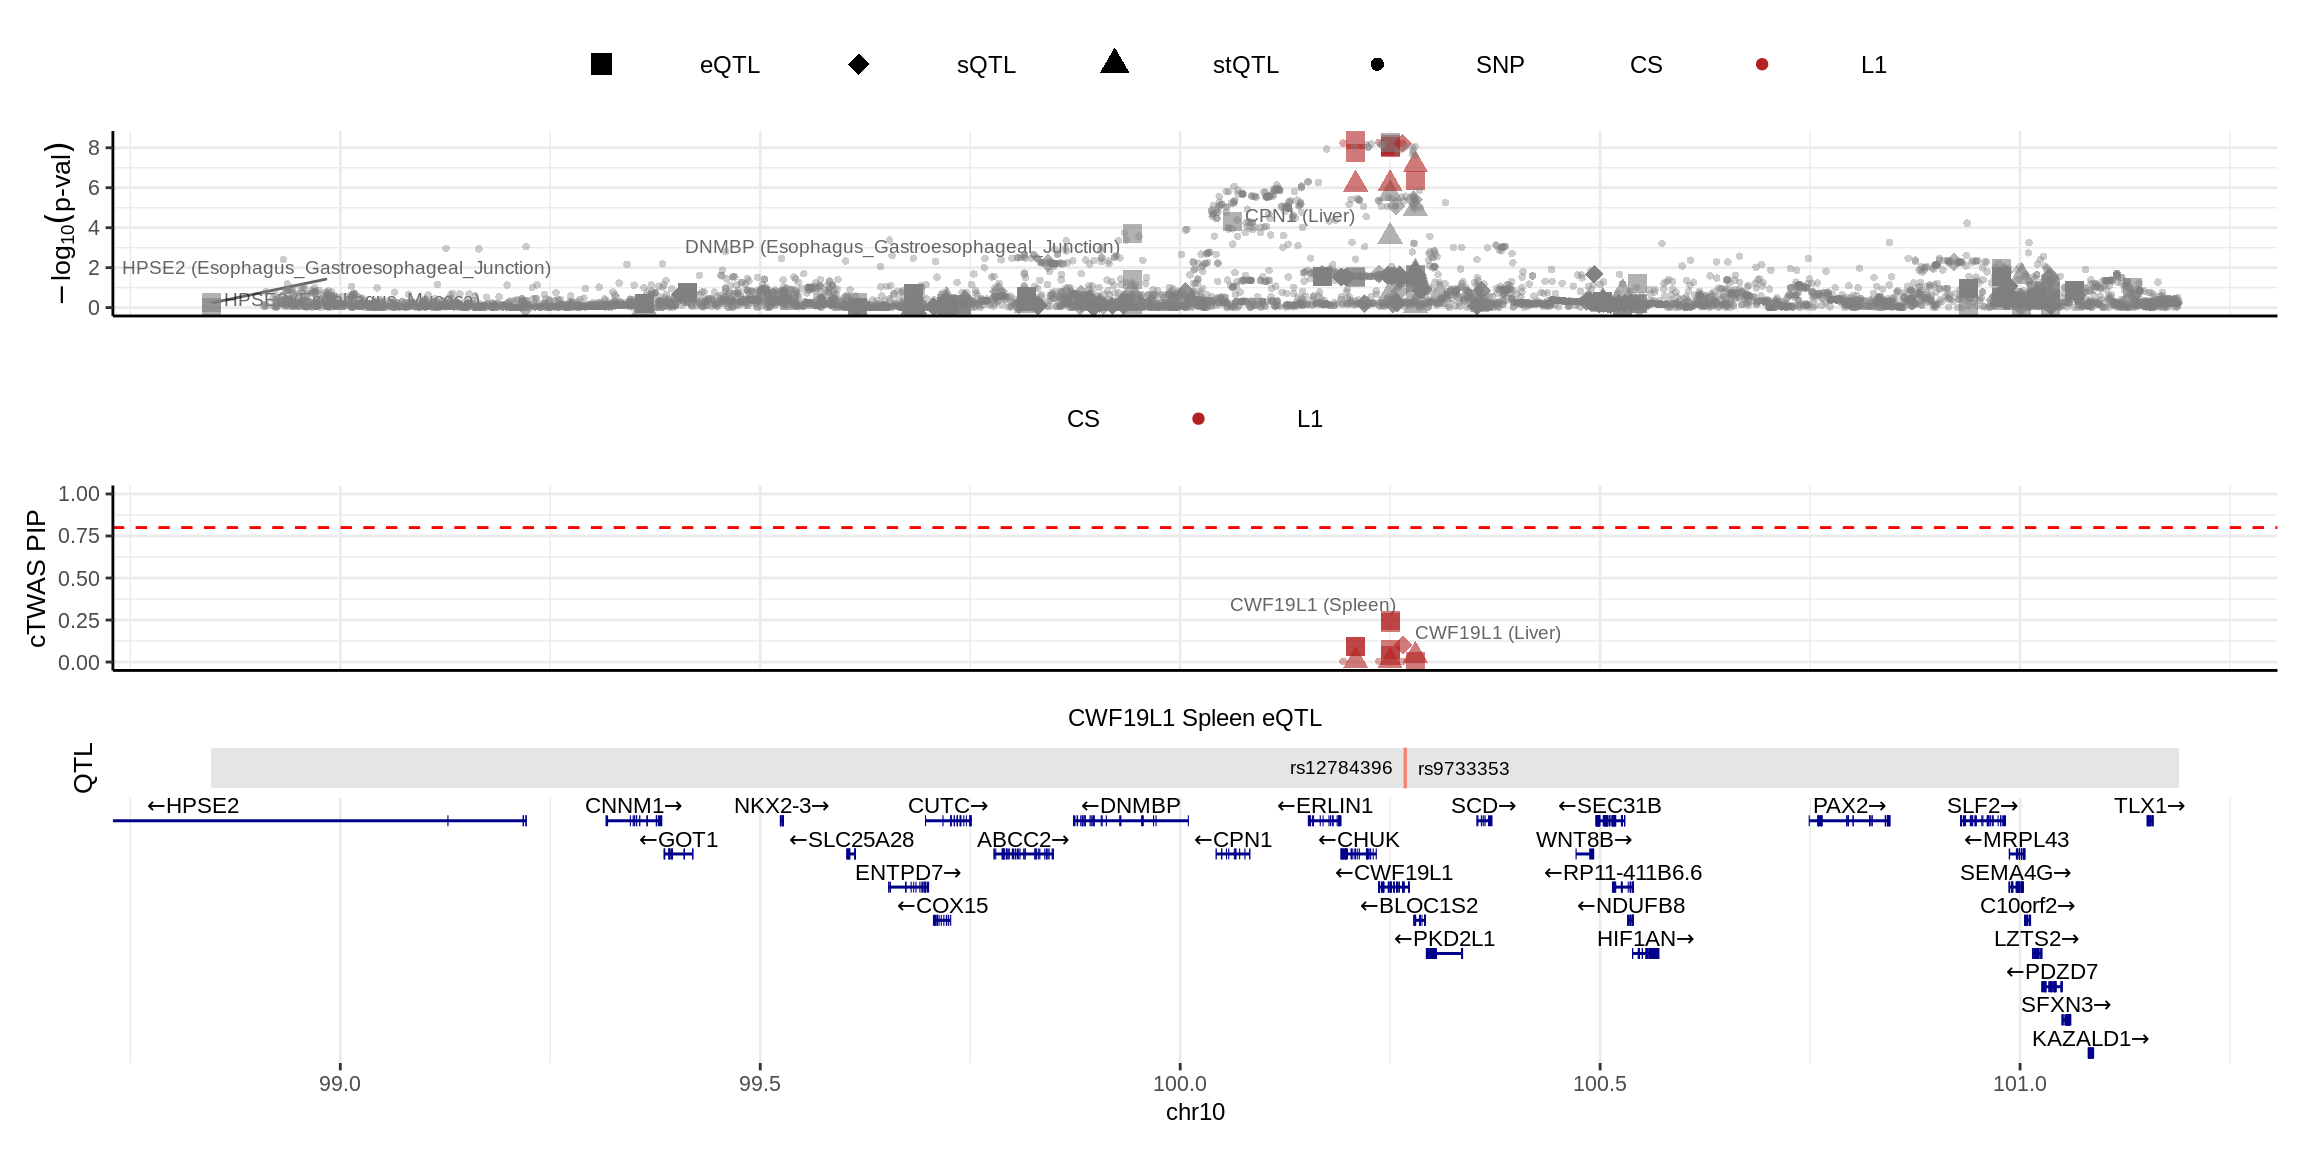
Exploring allelic heterogeneity
pip_per_cs <- compute_pip_per_cs(combined_pip_by_group_sig_multi, susie_alpha_res_multi)

DT::datatable(pip_per_cs,caption = htmltools::tags$caption( style = 'caption-side: topleft; text-align = left; color:black;','PIP per CS'),options = list(pageLength = 5) )
IBD-ebi-a-GCST004131
Parameter
trait <- "IBD-ebi-a-GCST004131"
gwas_n <- samplesize[trait]
tissue <- c("Whole_Blood","Adipose_Subcutaneous","Cells_Cultured_fibroblasts","Spleen","Testis")


results_dir_multi <- paste0("/project/xinhe/xsun/multi_group_ctwas/11.multi_group_1008/results/",trait,"/")
ctwas_res_multi <- readRDS(paste0(results_dir_multi,trait,".ctwas.res.RDS"))

param_multi <- ctwas_res_multi$param
make_convergence_plots(param_multi, gwas_n, colors = colors)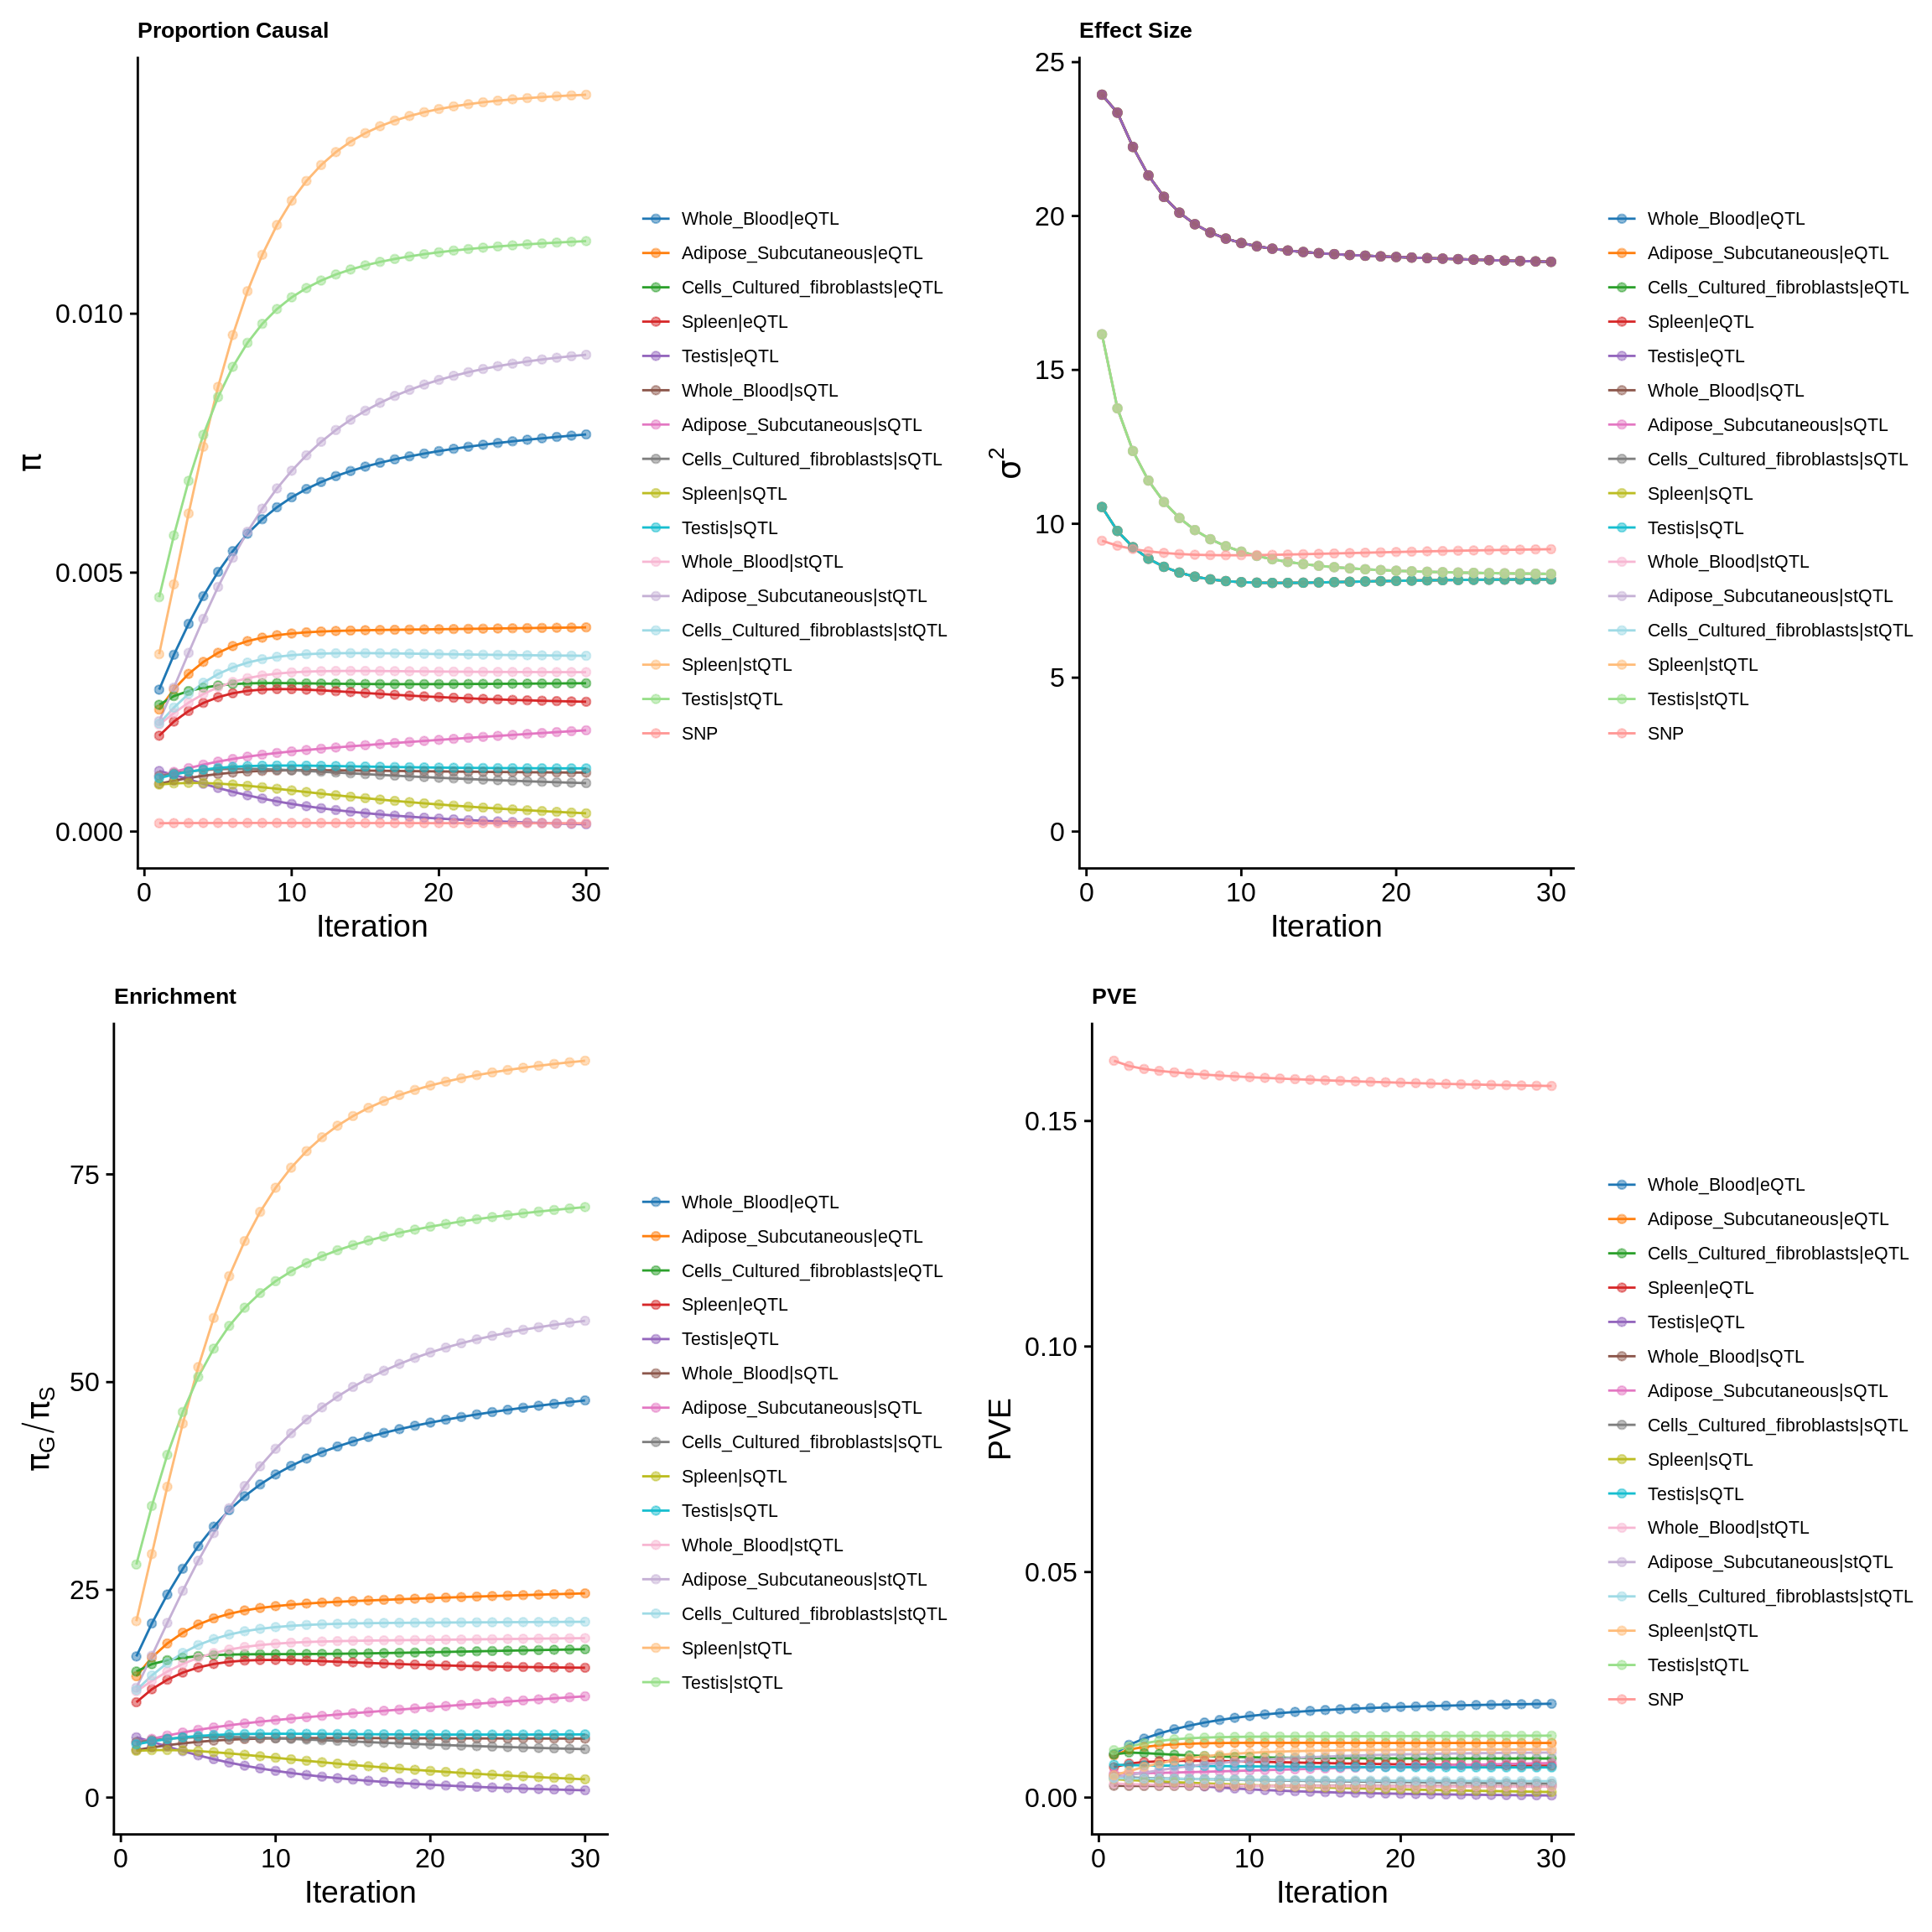
ctwas_parameters_multi <- summarize_param(param_multi, gwas_n)
pve_pie_by_type_multi <- plot_piechart(ctwas_parameters = ctwas_parameters_multi, colors = colors, by = "type")
pve_pie_by_context_multi <- plot_piechart(ctwas_parameters = ctwas_parameters_multi, colors = colors, by = "context")

gridExtra::grid.arrange(pve_pie_by_type_multi,pve_pie_by_context_multi, ncol = 2)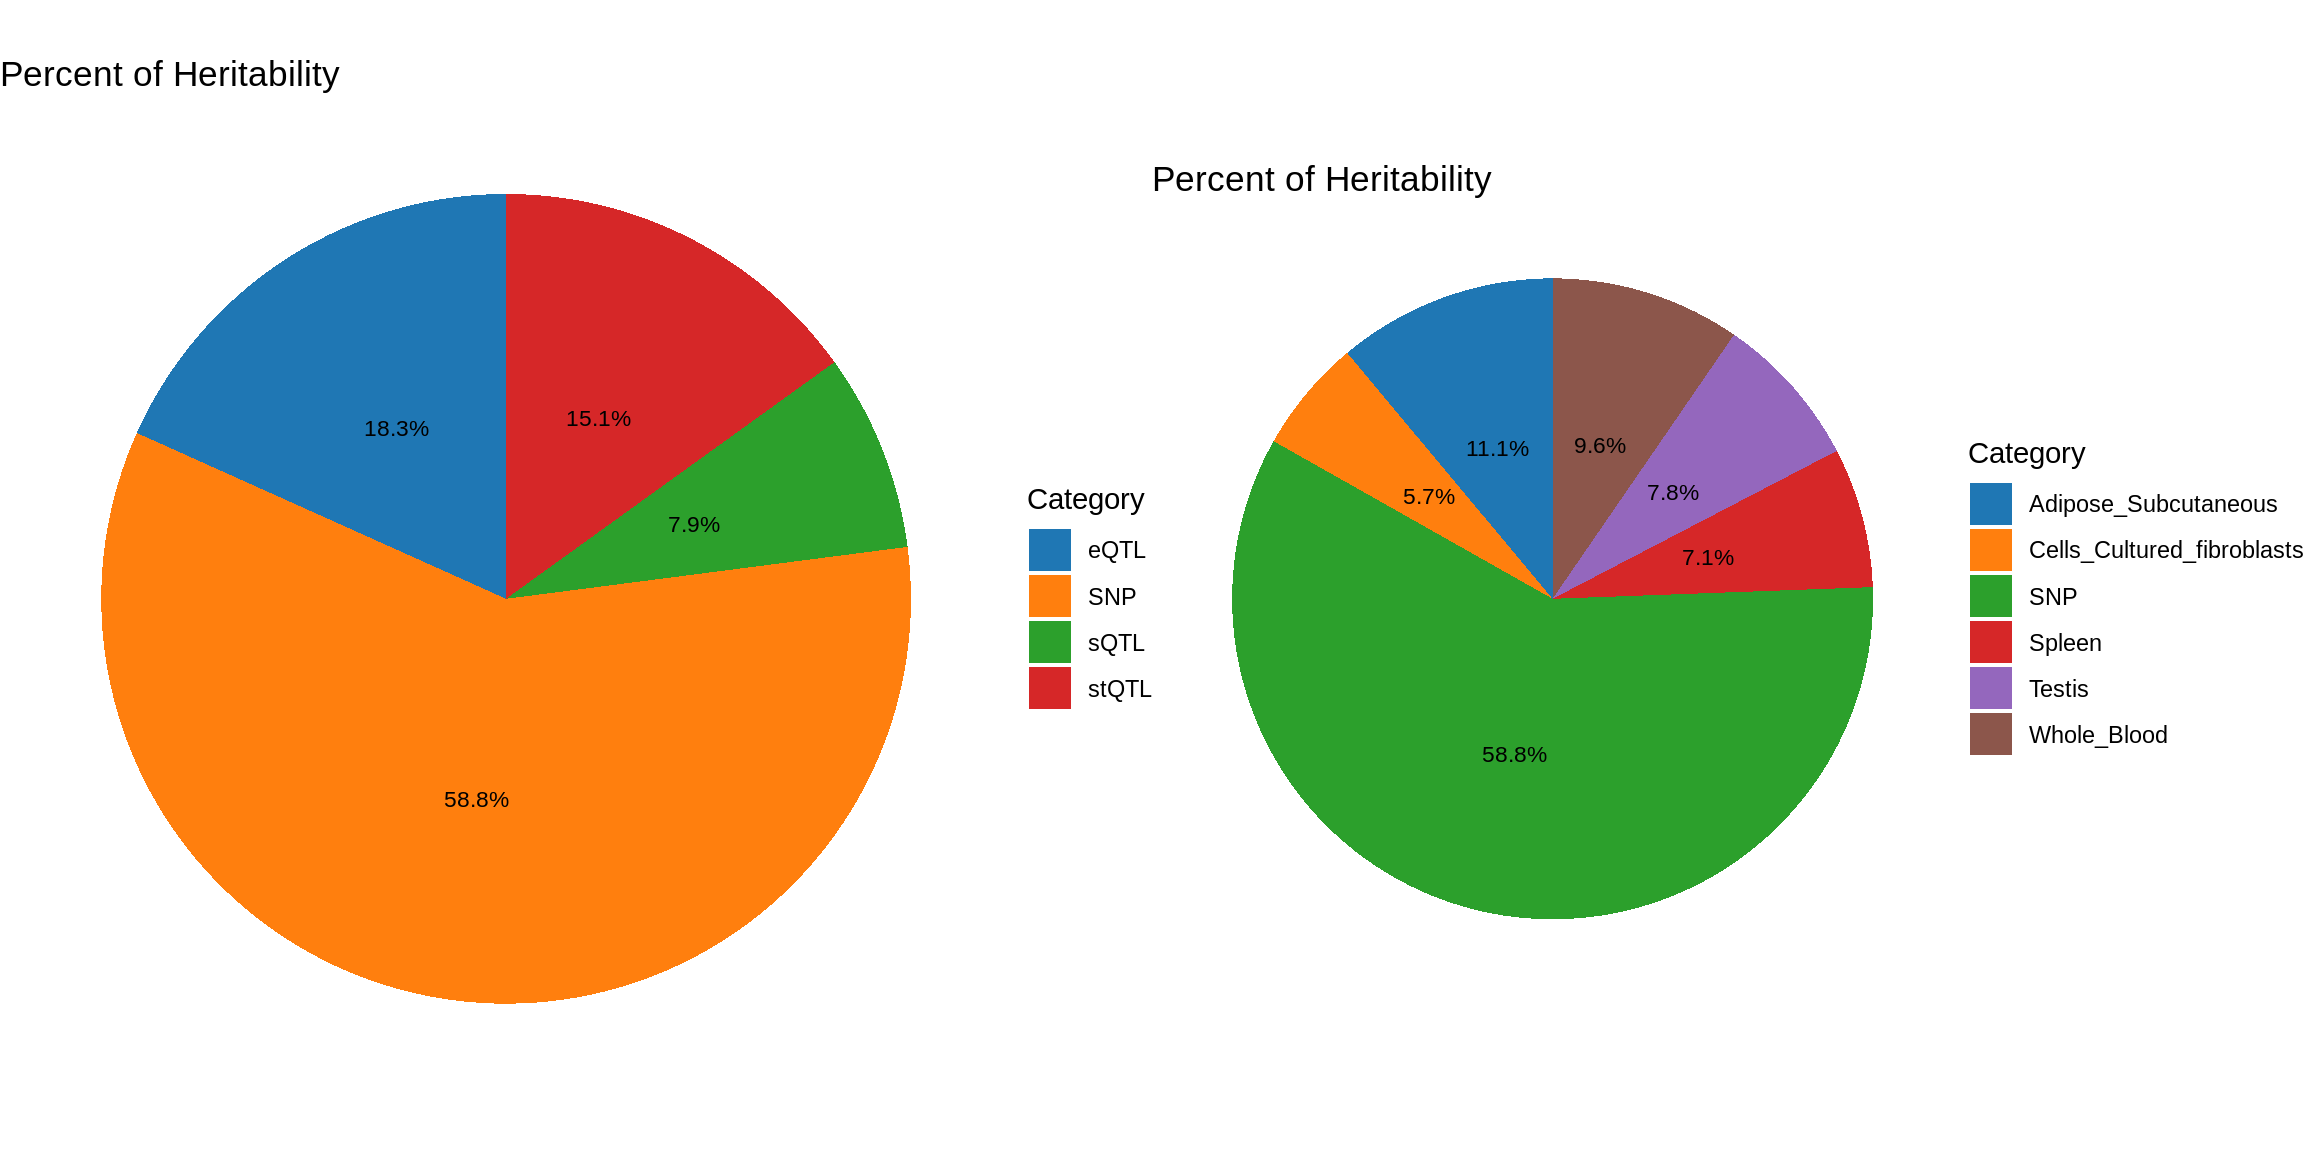
| Version | Author | Date |
|---|---|---|
| eb58424 | XSun | 2024-10-17 |
Postprocessing – LD mismatch
finemap_res_multi <- ctwas_res_multi$finemap_res
finemap_res_multi <- ctwas_res_multi$finemap_res

finemap_res_multi_gene <- finemap_res_multi[finemap_res_multi$type != "SNP",]

ggplot(data = finemap_res_multi_gene, aes(x= abs(z), y= susie_pip)) +
  geom_point() +
  ggtitle("Z scores vs PIP") +
  theme_minimal()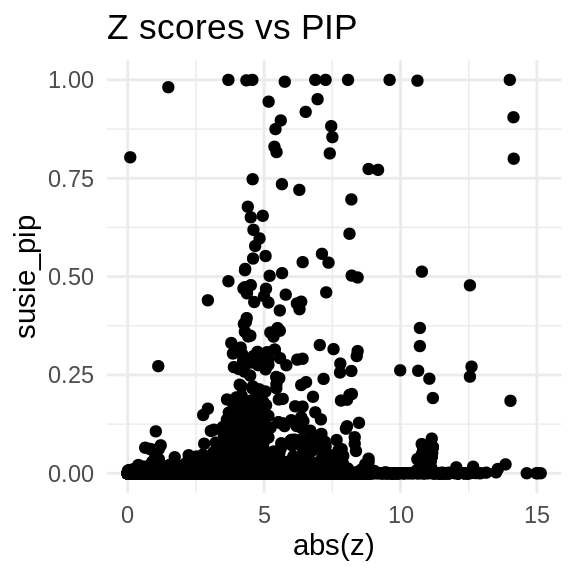
load(paste0("/project/xinhe/xsun/multi_group_ctwas/11.multi_group_1008/ld_mismatch/LD_mismatch_", trait,".rdata"))

sprintf("The number of problematic regions = %s", length(problematic_region_ids))
[1] "The number of problematic regions = 3"sprintf("The number of problematic genes = %s", length(problematic_genes))[1] "The number of problematic genes = 3"sprintf("The number of problematic snps = %s", length(res$problematic_snps))[1] "The number of problematic snps = 395"sprintf("The number of flipped snps = %s", length(res$flipped_snps))[1] "The number of flipped snps = 3"problematic_snps <- res$condz_stats[res$condz_stats$id %in% res$problematic_snps,]
DT::datatable(problematic_snps,caption = htmltools::tags$caption(style = 'caption-side: topleft; text-align = left; color:black;','Stats for problematic snps'),options = list(pageLength = 5) )finemap_origin_res_problematic_region <- finemap_res_multi[finemap_res_multi$id %in% problematic_genes,]
merge_origin_nold <- merge(finemap_origin_res_problematic_region,finemap_noLD_res_problematic_region, by = "id")
merge_origin_nold <- merge_origin_nold[,c("id","susie_pip.x","susie_pip.y")]
colnames(merge_origin_nold) <- c("id","susie_pip_origin","susie_pip_ld-mismatch-fixed")
DT::datatable(merge_origin_nold,caption = htmltools::tags$caption(style = 'caption-side: topleft; text-align = left; color:black;','Original PIP and fixed PIP for problematic genes'),options = list(pageLength = 5) )Fine-mapping (LD mis-match fixed)
susie_alpha_res_multi <- ctwas_res_multi$susie_alpha_res
rerun_finemap_res <- res$finemap_res
rerun_susie_alpha_res <- res$susie_alpha_res
res <- update_finemap_res(finemap_res_multi,
                          susie_alpha_res_multi,
                          rerun_finemap_res,
                          rerun_susie_alpha_res,
                          updated_region_ids = problematic_region_ids)

finemap_res_multi <- res$finemap_res
susie_alpha_res_multi <- res$susie_alpha_res

susie_alpha_res_multi <- anno_susie_alpha_res(susie_alpha_res_multi,
                                        mapping_table = mapping_two,
                                        map_by = "molecular_id",
                                        drop_unmapped = TRUE)
2024-11-26 14:50:25 INFO::Annotating susie alpha result ...
2024-11-26 14:50:25 INFO::Map molecular traits to genes
2024-11-26 14:50:26 INFO::Split PIPs for molecular traits mapped to multiple genescombined_pip_by_type_cs_multi <- combine_gene_pips(susie_alpha_res_multi,
group_by = "gene_name",
by = "type",
method = "combine_cs",
filter_cs = TRUE,
include_cs_id = T)
combined_pip_by_context_cs_multi <- combine_gene_pips(susie_alpha_res_multi,
group_by = "gene_name",
by = "context",
method = "combine_cs",
filter_cs = TRUE,
include_cs_id = T)
DT::datatable(combined_pip_by_type_cs_multi[combined_pip_by_type_cs_multi$combined_pip>0.8,],caption = htmltools::tags$caption( style = 'caption-side: topleft; text-align = left; color:black;','Combined PIP by omics'),options = list(pageLength = 5) )DT::datatable(combined_pip_by_context_cs_multi[combined_pip_by_context_cs_multi$combined_pip>0.8,],caption = htmltools::tags$caption( style = 'caption-side: topleft; text-align = left; color:black;','Combined PIP by tissue'),options = list(pageLength = 5) )combined_pip_by_group_multi <- combine_gene_pips(susie_alpha_res_multi,
group_by = "gene_name",
by = "group",
method = "combine_cs",
filter_cs = TRUE,
include_cs_id = F)
combined_pip_by_group_sig_multi <- combined_pip_by_group_multi[combined_pip_by_group_multi$combined_pip > 0.8,]
plot_heatmap(heatmap_data = combined_pip_by_group_sig_multi, main = "PIP partitions for genes with PIP>0.8")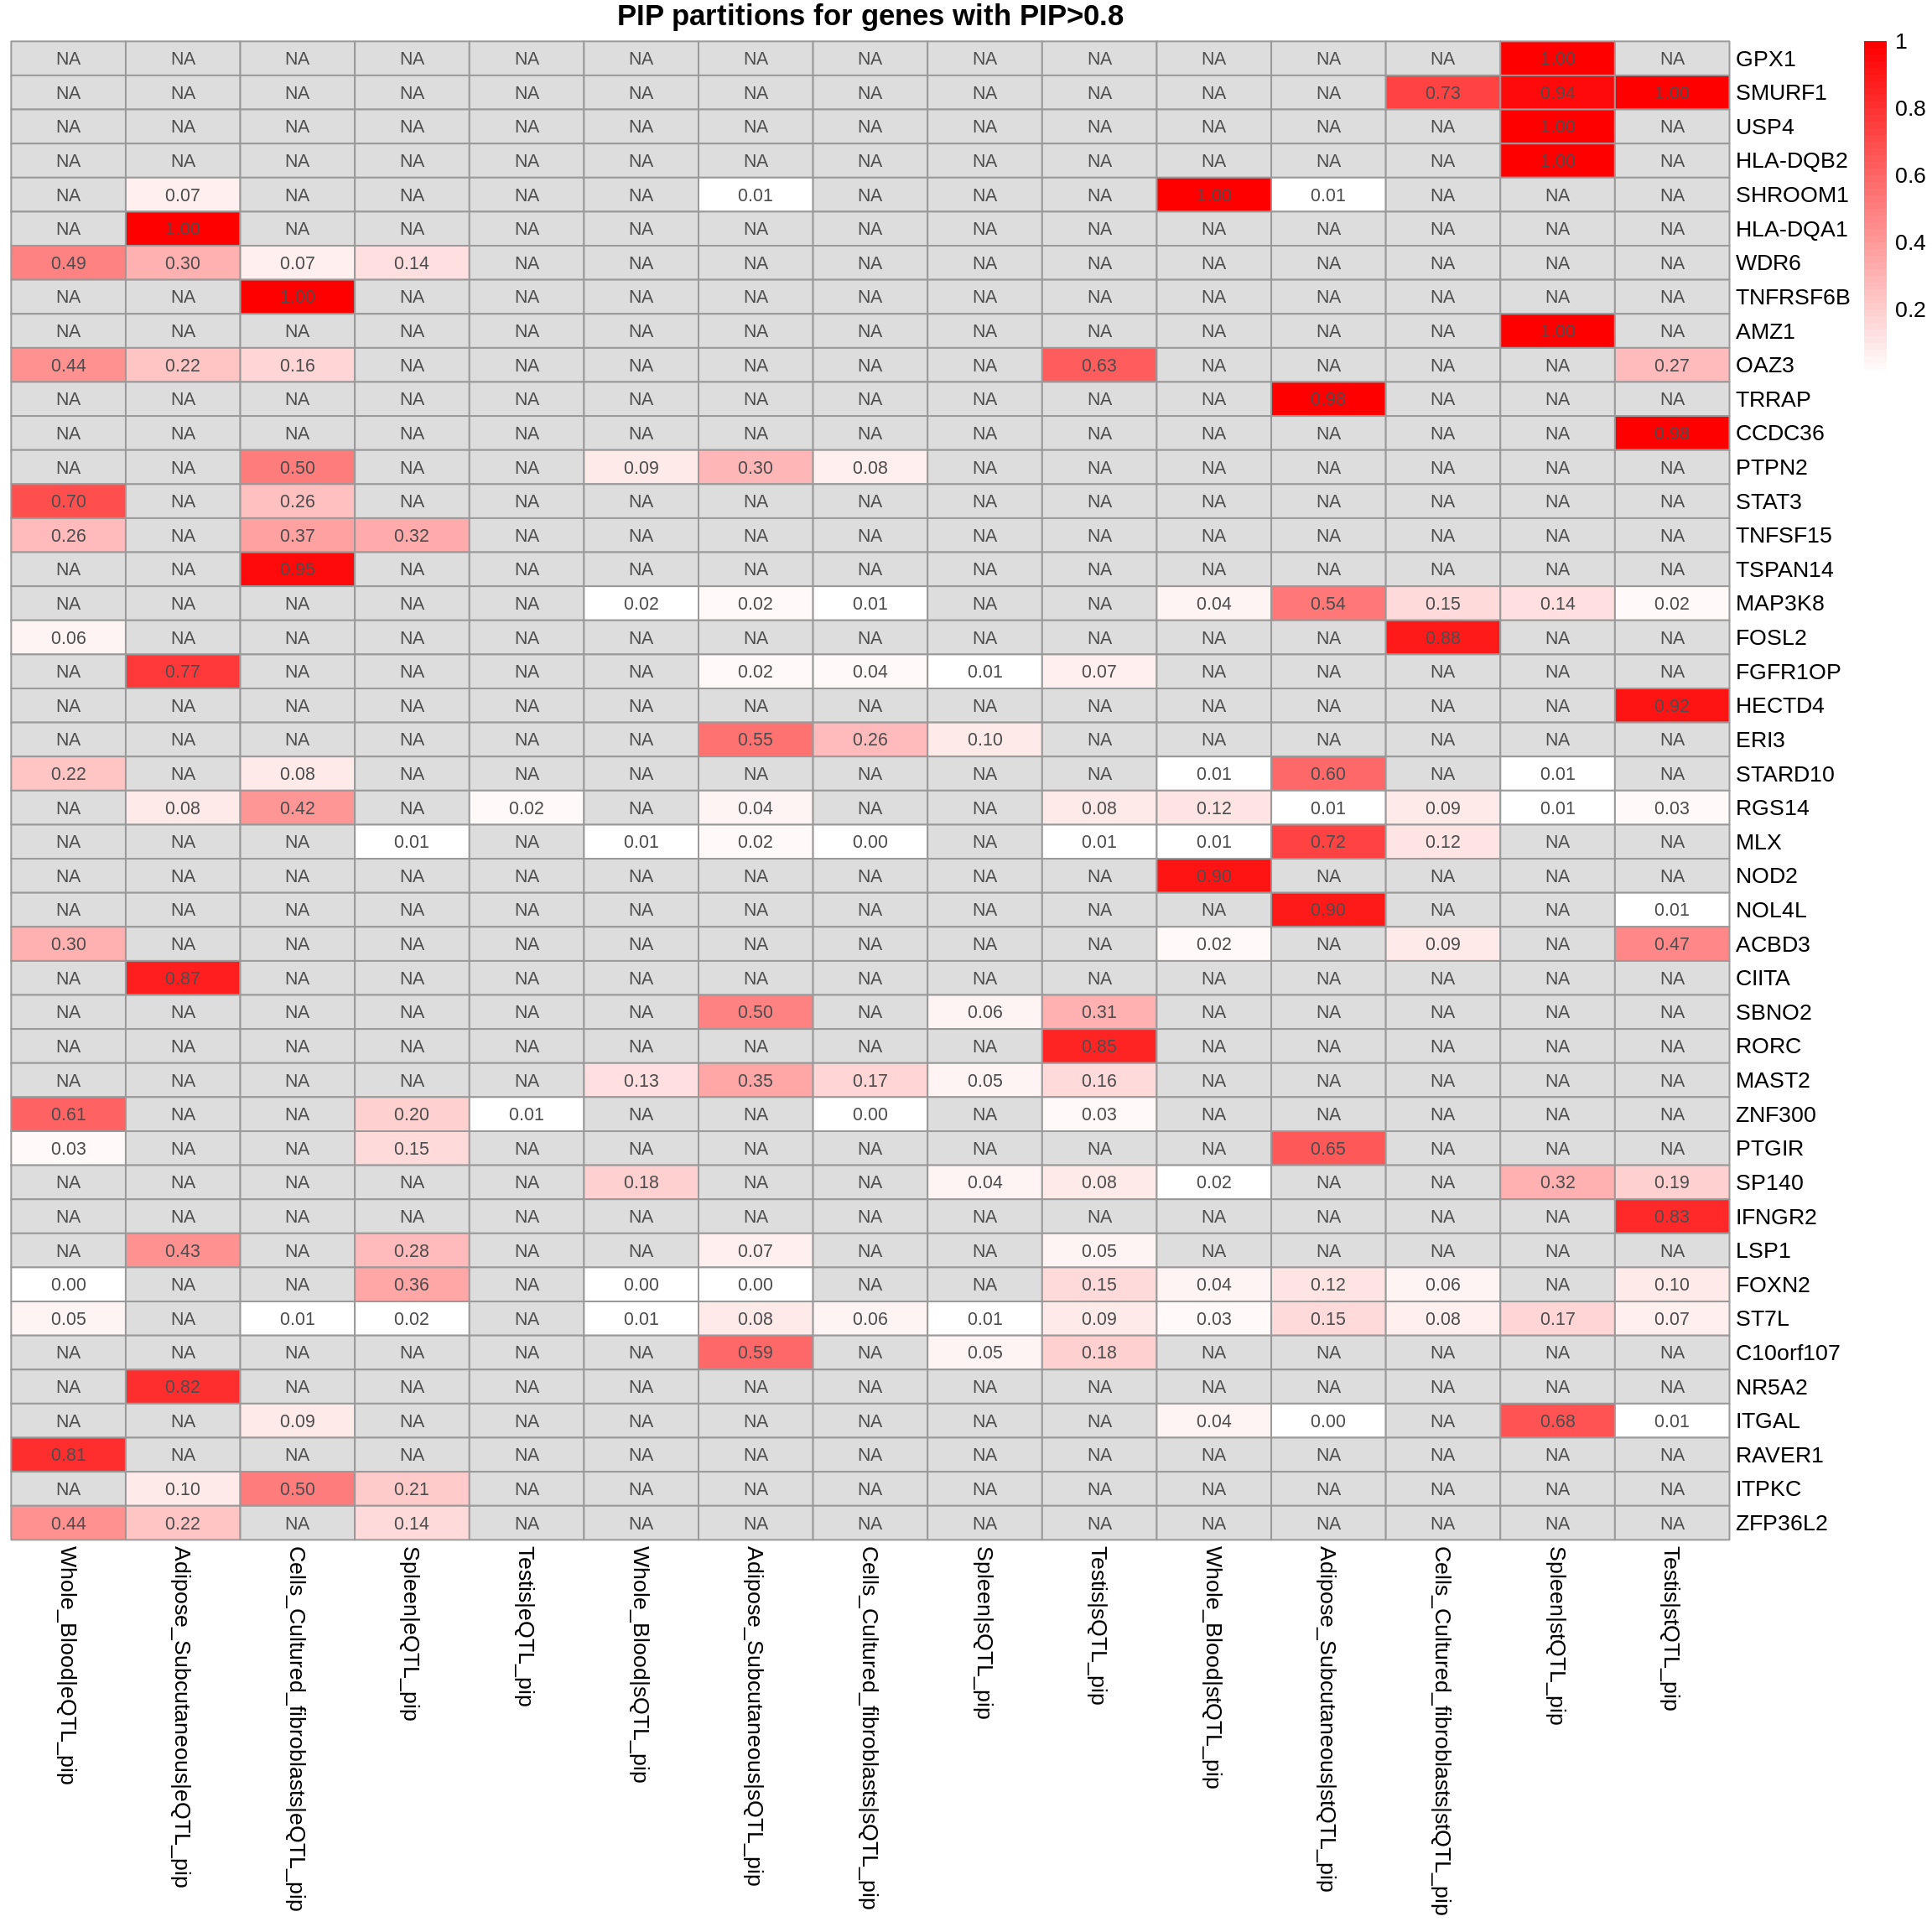
| Version | Author | Date |
|---|---|---|
| eb58424 | XSun | 2024-10-17 |
Comparing with single tissue + eQTL analysis
ctwas_res_single <- readRDS(paste0("/project/xinhe/xsun/multi_group_ctwas/10.single_tissue_1007/results/",trait,"/",tissue[1],"/",trait,"_",tissue[1], ".ctwas.res.RDS"))

susie_alpha_res_single <- ctwas_res_single$susie_alpha_res

susie_alpha_res_single <- anno_susie_alpha_res(susie_alpha_res_single,
                                        mapping_table = mapping_predictdb,
                                        map_by = "molecular_id",
                                        drop_unmapped = TRUE)
2024-11-26 14:50:36 INFO::Annotating susie alpha result ...
2024-11-26 14:50:36 INFO::Map molecular traits to genescombined_pip_by_type_single <- combine_gene_pips(susie_alpha_res_single,
group_by = "gene_name",
by = "type",
method = "combine_cs",
filter_cs = TRUE,
include_cs_id = F)
combined_pip_by_type_sig_single <- combined_pip_by_type_single[combined_pip_by_type_single$combined_pip > 0.8,]
combined_pip_by_type_sig_multi <- combined_pip_by_type_cs_multi[combined_pip_by_type_cs_multi$combined_pip > 0.8,]
sprintf("Number of genes with PIP > 0.8 -- Multi-group = %s", nrow(combined_pip_by_type_sig_multi))[1] "Number of genes with PIP > 0.8 -- Multi-group = 44"sprintf("Number of genes with PIP > 0.8 -- single eQTL = %s", nrow(combined_pip_by_type_sig_single))[1] "Number of genes with PIP > 0.8 -- single eQTL = 11"sprintf("Number of overlapped genes = %s", sum(combined_pip_by_type_sig_single$gene_name %in% combined_pip_by_type_sig_multi$gene_name))[1] "Number of overlapped genes = 6"genes_not_reported <- combined_pip_by_type_sig_single$gene_name[!combined_pip_by_type_sig_single$gene_name %in%combined_pip_by_type_sig_multi$gene_name]
DT::datatable(combined_pip_by_type_sig_single[combined_pip_by_type_sig_single$gene_name %in% genes_not_reported,],caption = htmltools::tags$caption( style = 'caption-side: topleft; text-align = left; color:black;','Genes not reported by multi-group analysis'),options = list(pageLength = 5) )DT::datatable(combined_pip_by_type_cs_multi[combined_pip_by_type_cs_multi$gene_name %in% genes_not_reported,],caption = htmltools::tags$caption( style = 'caption-side: topleft; text-align = left; color:black;','Genes not reported by multi-group analysis'),options = list(pageLength = 5) )gene_multi_unique_type <- combined_pip_by_group_sig_multi[!combined_pip_by_group_sig_multi$gene_name %in% combined_pip_by_type_sig_single$gene_name,]
plot_heatmap(heatmap_data = gene_multi_unique_type, main = "PIP partition for unique genes found by multi-group analysis")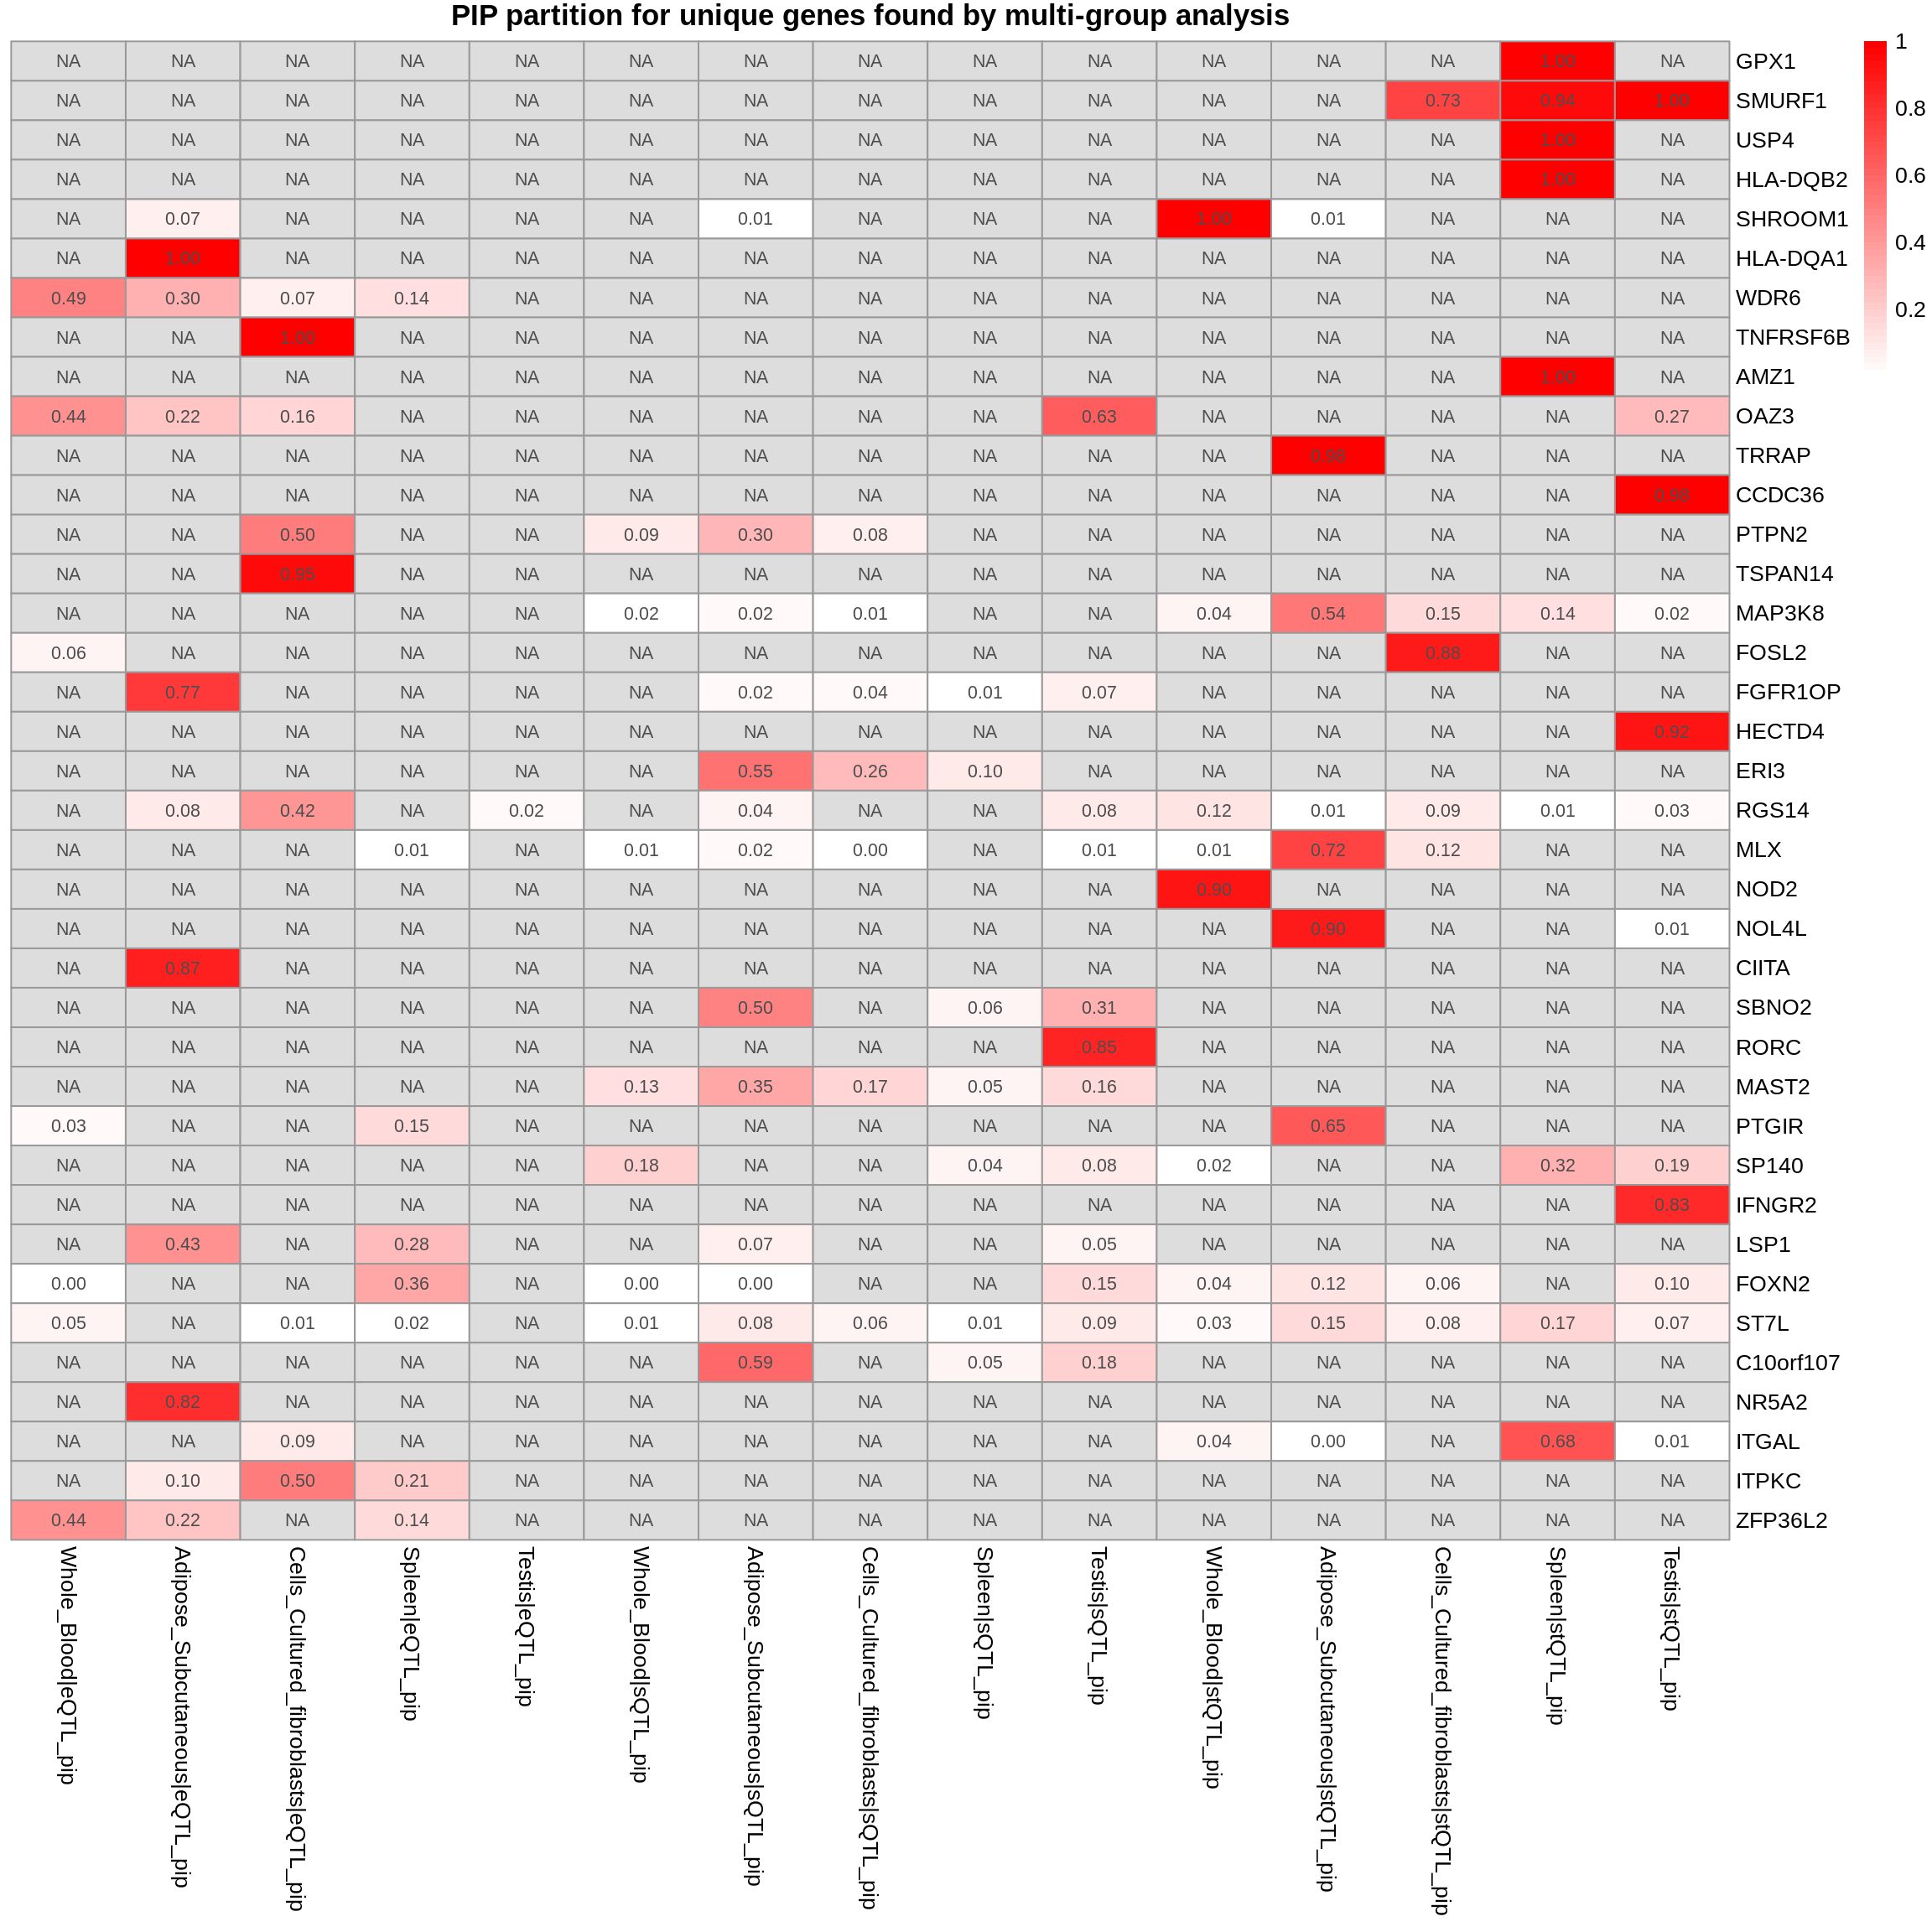
Exploring allelic heterogeneity
pip_per_cs <- compute_pip_per_cs(combined_pip_by_group_sig_multi, susie_alpha_res_multi)

DT::datatable(pip_per_cs,caption = htmltools::tags$caption( style = 'caption-side: topleft; text-align = left; color:black;','PIP per CS'),options = list(pageLength = 5) )
SBP-ukb-a-360
Parameter
trait <- "SBP-ukb-a-360"
gwas_n <- samplesize[trait]
tissue <- c("Artery_Tibial","Heart_Atrial_Appendage","Adipose_Subcutaneous","Brain_Cortex","Skin_Sun_Exposed_Lower_leg")


results_dir_multi <- paste0("/project/xinhe/xsun/multi_group_ctwas/11.multi_group_1008/results/",trait,"/")
ctwas_res_multi <- readRDS(paste0(results_dir_multi,trait,".ctwas.res.RDS"))

param_multi <- ctwas_res_multi$param
make_convergence_plots(param_multi, gwas_n, colors = colors)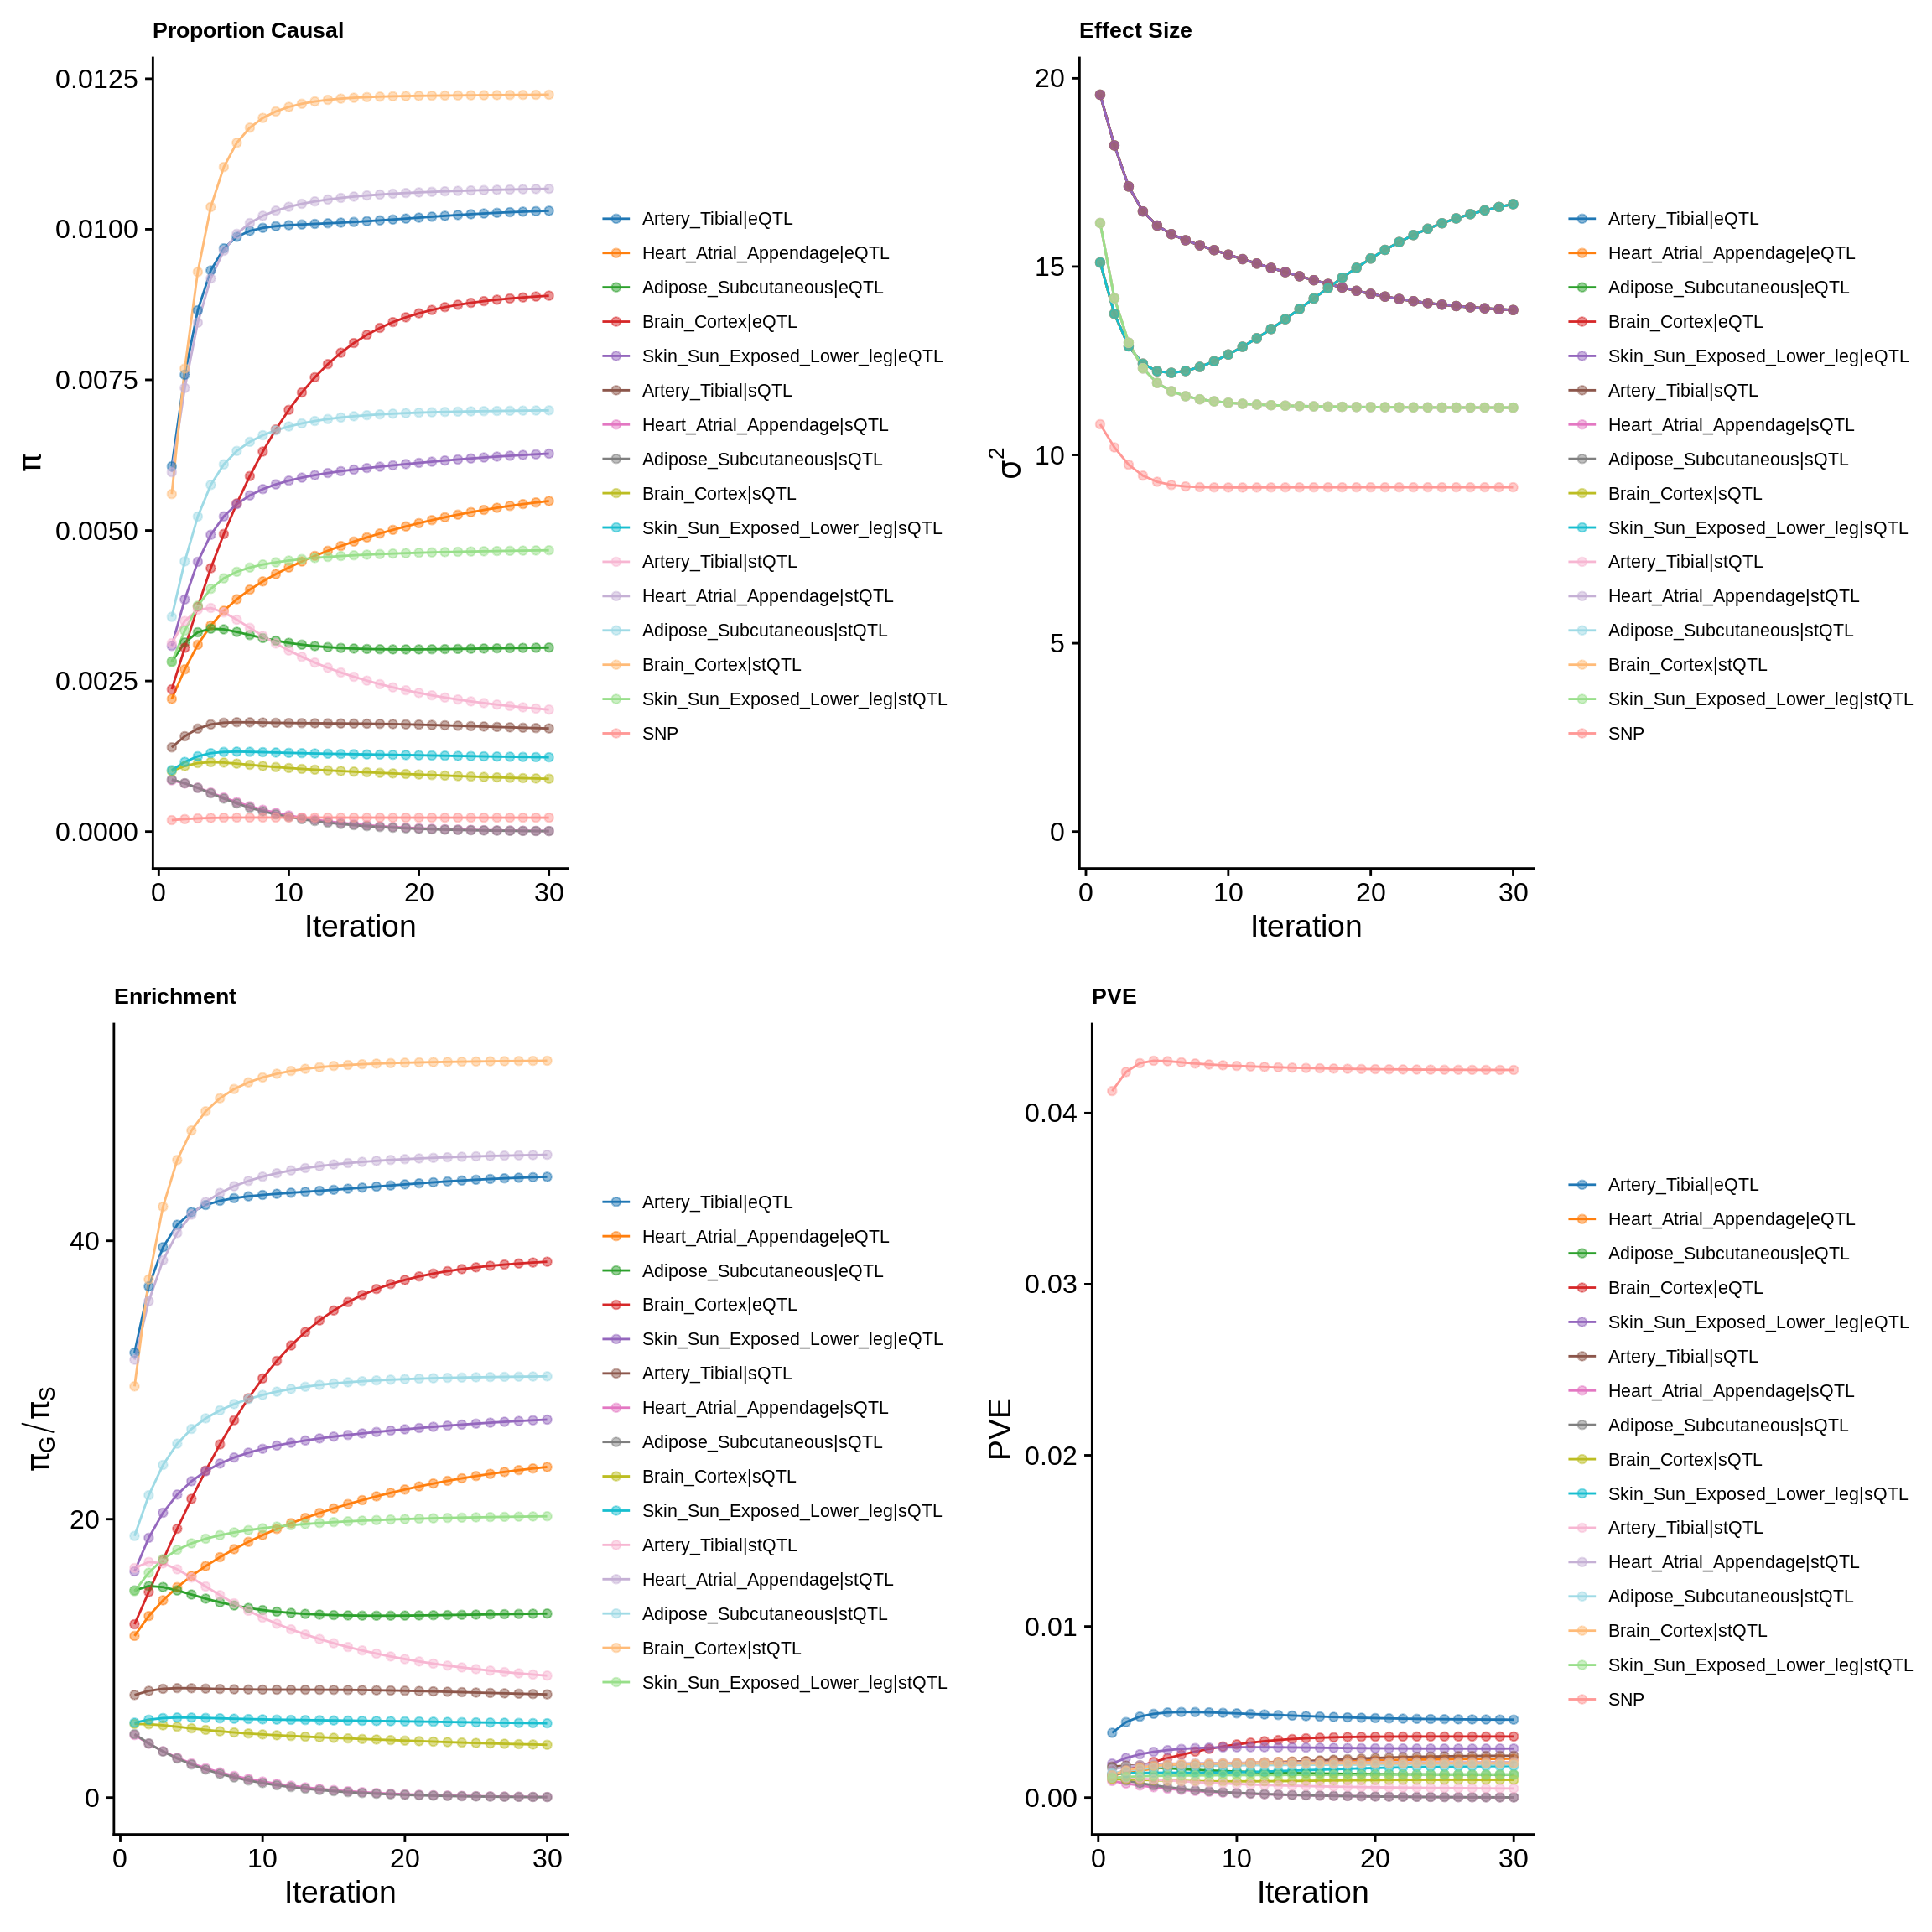
| Version | Author | Date |
|---|---|---|
| eb58424 | XSun | 2024-10-17 |
ctwas_parameters_multi <- summarize_param(param_multi, gwas_n)
pve_pie_by_type_multi <- plot_piechart(ctwas_parameters = ctwas_parameters_multi, colors = colors, by = "type")
pve_pie_by_context_multi <- plot_piechart(ctwas_parameters = ctwas_parameters_multi, colors = colors, by = "context")

gridExtra::grid.arrange(pve_pie_by_type_multi,pve_pie_by_context_multi, ncol = 2)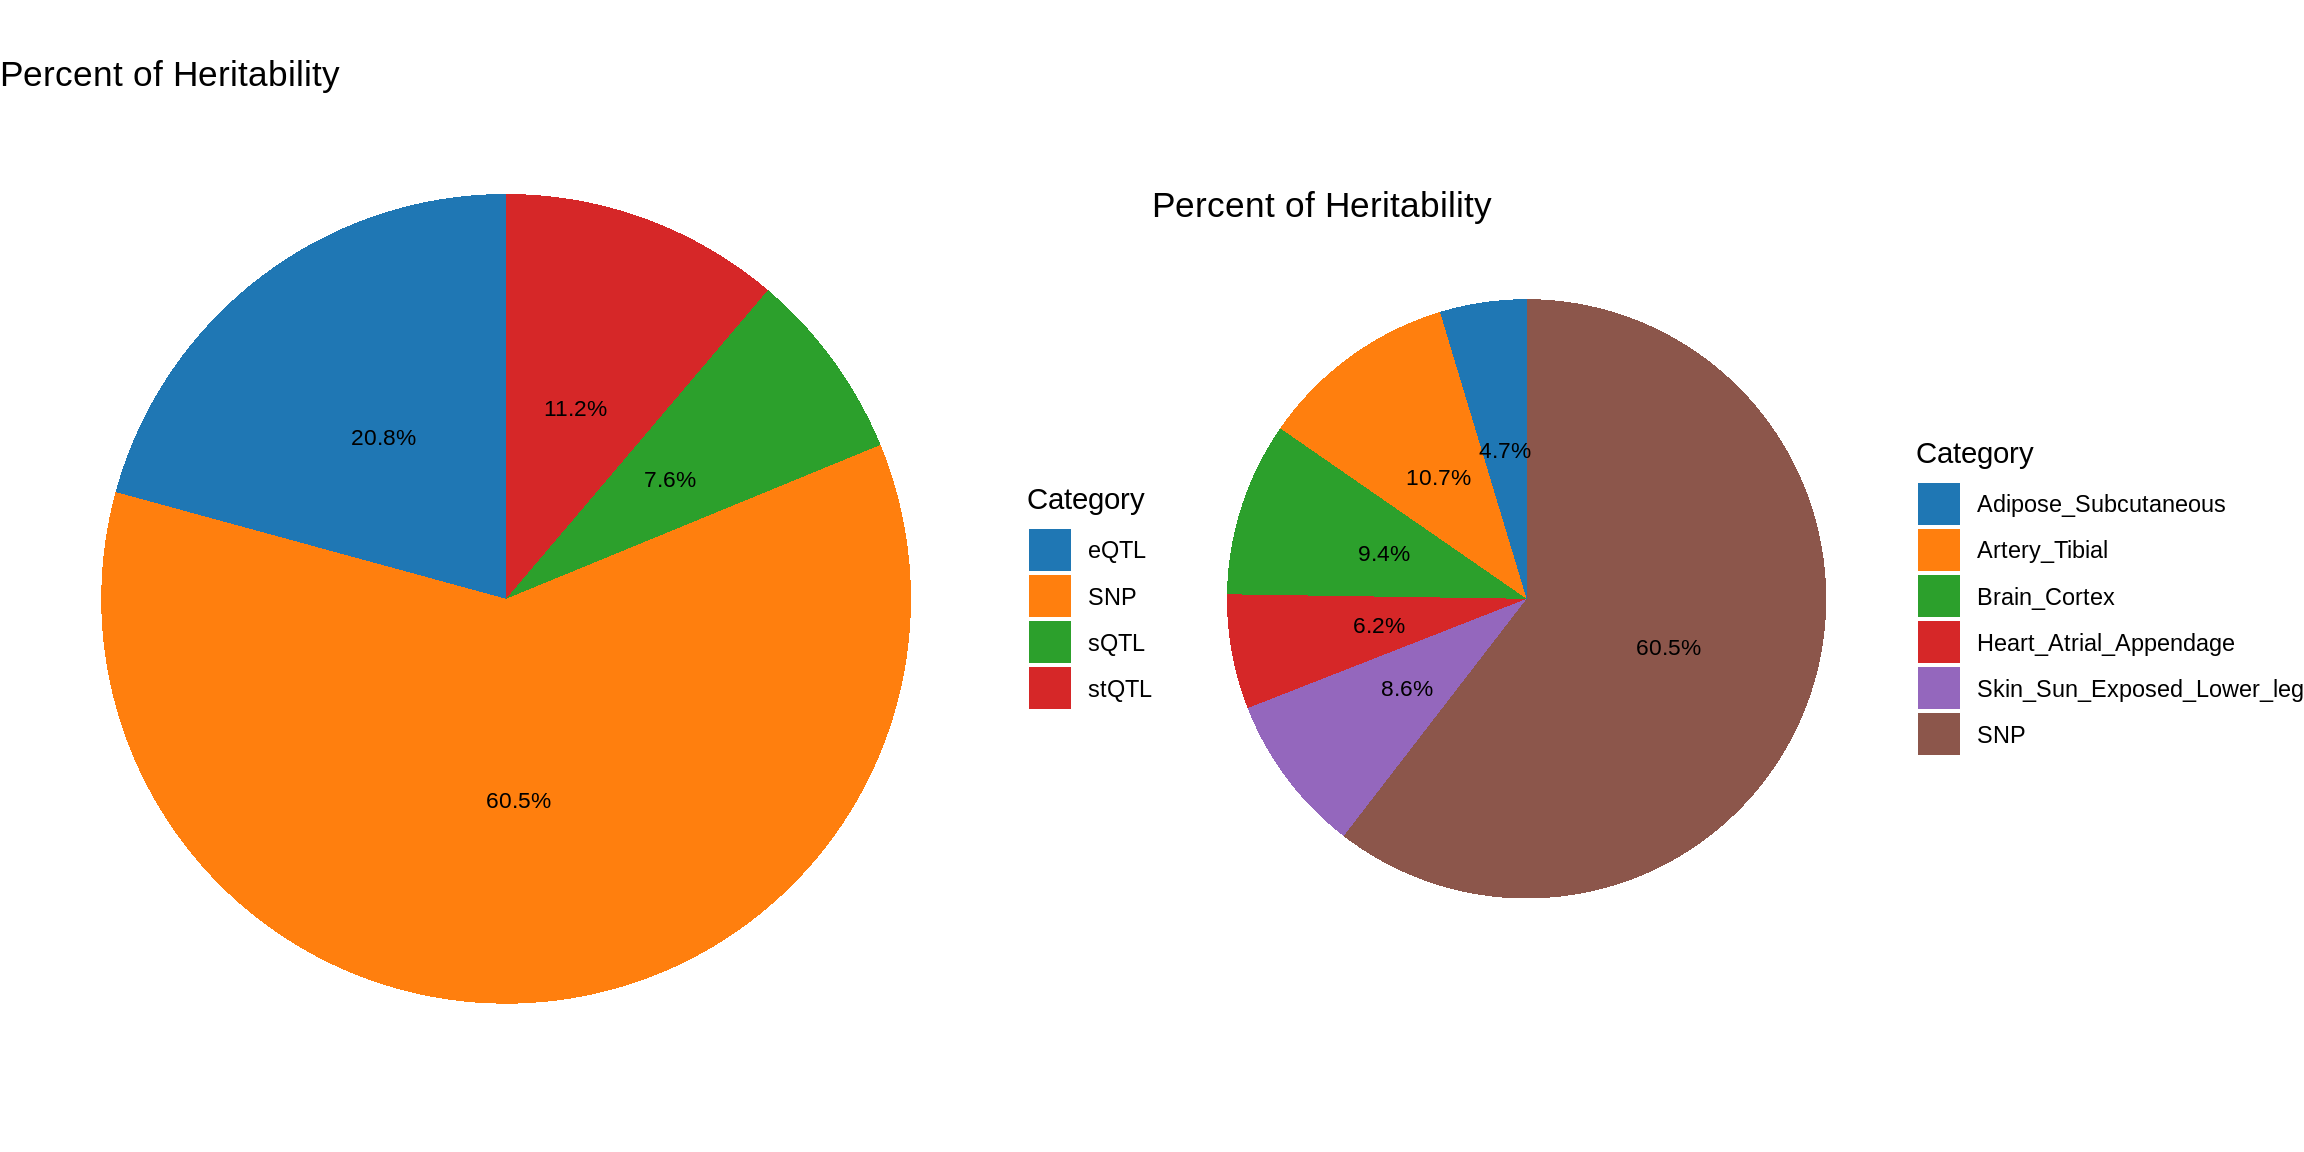
Postprocessing – LD mismatch
finemap_res_multi <- ctwas_res_multi$finemap_res
finemap_res_multi <- ctwas_res_multi$finemap_res

finemap_res_multi_gene <- finemap_res_multi[finemap_res_multi$type != "SNP",]

ggplot(data = finemap_res_multi_gene, aes(x= abs(z), y= susie_pip)) +
  geom_point() +
  ggtitle("Z scores vs PIP") +
  theme_minimal()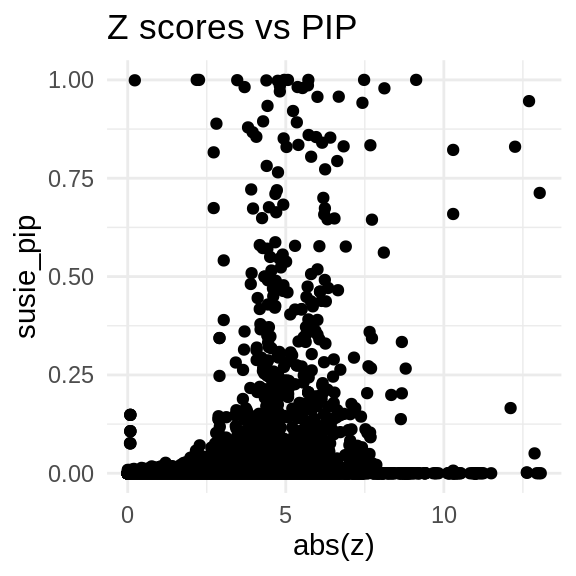
| Version | Author | Date |
|---|---|---|
| 4a84d72 | XSun | 2024-10-15 |
load(paste0("/project/xinhe/xsun/multi_group_ctwas/11.multi_group_1008/ld_mismatch/LD_mismatch_", trait,".rdata"))

sprintf("The number of problematic regions = %s", length(problematic_region_ids))
[1] "The number of problematic regions = 5"sprintf("The number of problematic genes = %s", length(problematic_genes))[1] "The number of problematic genes = 12"sprintf("The number of problematic snps = %s", length(res$problematic_snps))[1] "The number of problematic snps = 822"sprintf("The number of flipped snps = %s", length(res$flipped_snps))[1] "The number of flipped snps = 165"problematic_snps <- res$condz_stats[res$condz_stats$id %in% res$problematic_snps,]
DT::datatable(problematic_snps,caption = htmltools::tags$caption(style = 'caption-side: topleft; text-align = left; color:black;','Stats for problematic snps'),options = list(pageLength = 5) )finemap_origin_res_problematic_region <- finemap_res_multi[finemap_res_multi$id %in% problematic_genes,]
merge_origin_nold <- merge(finemap_origin_res_problematic_region,finemap_noLD_res_problematic_region, by = "id")
merge_origin_nold <- merge_origin_nold[,c("id","susie_pip.x","susie_pip.y")]
colnames(merge_origin_nold) <- c("id","susie_pip_origin","susie_pip_ld-mismatch-fixed")
DT::datatable(merge_origin_nold,caption = htmltools::tags$caption(style = 'caption-side: topleft; text-align = left; color:black;','Original PIP and fixed PIP for problematic genes'),options = list(pageLength = 5) )Fine-mapping (LD mis-match fixed)
susie_alpha_res_multi <- ctwas_res_multi$susie_alpha_res
rerun_finemap_res <- res$finemap_res
rerun_susie_alpha_res <- res$susie_alpha_res
res <- update_finemap_res(finemap_res_multi,
                          susie_alpha_res_multi,
                          rerun_finemap_res,
                          rerun_susie_alpha_res,
                          updated_region_ids = problematic_region_ids)

finemap_res_multi <- res$finemap_res
susie_alpha_res_multi <- res$susie_alpha_res

susie_alpha_res_multi <- anno_susie_alpha_res(susie_alpha_res_multi,
                                        mapping_table = mapping_two,
                                        map_by = "molecular_id",
                                        drop_unmapped = TRUE)
2024-11-26 14:51:00 INFO::Annotating susie alpha result ...
2024-11-26 14:51:00 INFO::Map molecular traits to genes
2024-11-26 14:51:00 INFO::Split PIPs for molecular traits mapped to multiple genescombined_pip_by_type_cs_multi <- combine_gene_pips(susie_alpha_res_multi,
group_by = "gene_name",
by = "type",
method = "combine_cs",
filter_cs = TRUE,
include_cs_id = T)
combined_pip_by_context_cs_multi <- combine_gene_pips(susie_alpha_res_multi,
group_by = "gene_name",
by = "context",
method = "combine_cs",
filter_cs = TRUE,
include_cs_id = T)
DT::datatable(combined_pip_by_type_cs_multi[combined_pip_by_type_cs_multi$combined_pip>0.8,],caption = htmltools::tags$caption( style = 'caption-side: topleft; text-align = left; color:black;','Combined PIP by omics'),options = list(pageLength = 5) )DT::datatable(combined_pip_by_context_cs_multi[combined_pip_by_context_cs_multi$combined_pip>0.8,],caption = htmltools::tags$caption( style = 'caption-side: topleft; text-align = left; color:black;','Combined PIP by tissue'),options = list(pageLength = 5) )combined_pip_by_group_multi <- combine_gene_pips(susie_alpha_res_multi,
group_by = "gene_name",
by = "group",
method = "combine_cs",
filter_cs = TRUE,
include_cs_id = F)
combined_pip_by_group_sig_multi <- combined_pip_by_group_multi[combined_pip_by_group_multi$combined_pip > 0.8,]
plot_heatmap(heatmap_data = combined_pip_by_group_sig_multi, main = "PIP partitions for genes with PIP>0.8")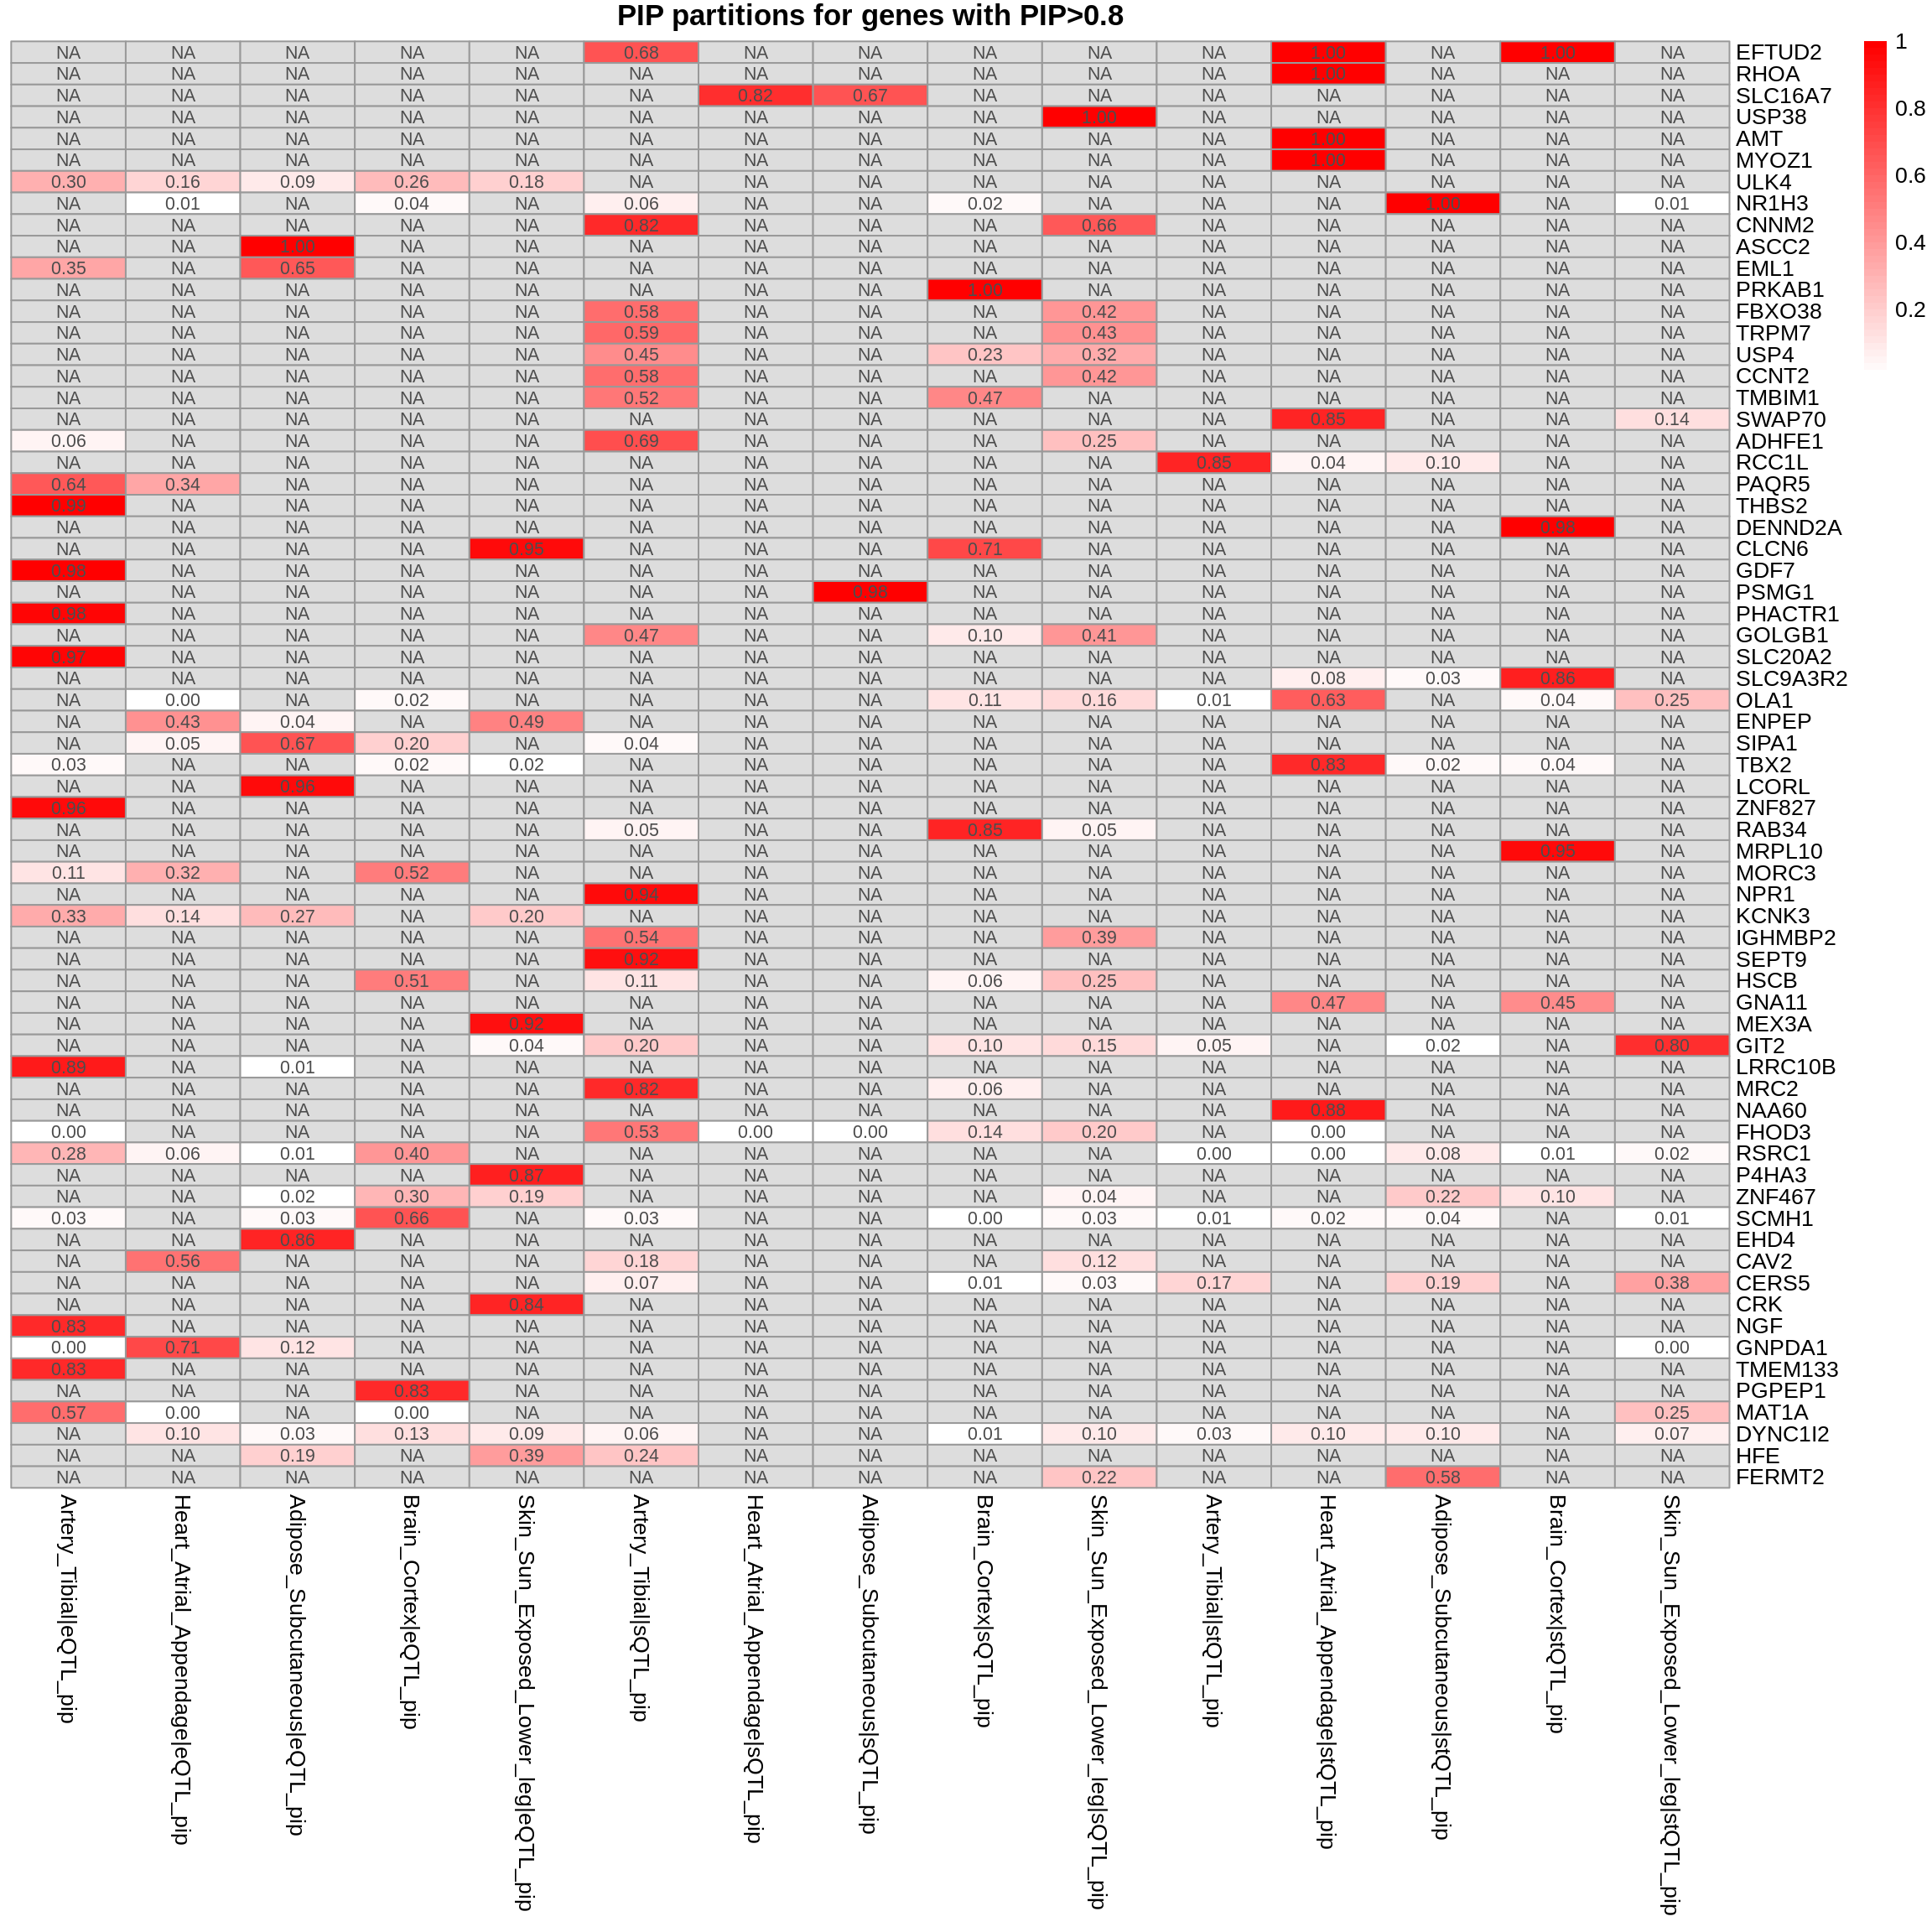
Comparing with single tissue + eQTL analysis
ctwas_res_single <- readRDS(paste0("/project/xinhe/xsun/multi_group_ctwas/10.single_tissue_1007/results/",trait,"/",tissue[1],"/",trait,"_",tissue[1], ".ctwas.res.RDS"))

susie_alpha_res_single <- ctwas_res_single$susie_alpha_res

susie_alpha_res_single <- anno_susie_alpha_res(susie_alpha_res_single,
                                        mapping_table = mapping_predictdb,
                                        map_by = "molecular_id",
                                        drop_unmapped = TRUE)
2024-11-26 14:51:16 INFO::Annotating susie alpha result ...
2024-11-26 14:51:16 INFO::Map molecular traits to genescombined_pip_by_type_single <- combine_gene_pips(susie_alpha_res_single,
group_by = "gene_name",
by = "type",
method = "combine_cs",
filter_cs = TRUE,
include_cs_id = F)
combined_pip_by_type_sig_single <- combined_pip_by_type_single[combined_pip_by_type_single$combined_pip > 0.8,]
combined_pip_by_type_sig_multi <- combined_pip_by_type_cs_multi[combined_pip_by_type_cs_multi$combined_pip > 0.8,]
sprintf("Number of genes with PIP > 0.8 -- Multi-group = %s", nrow(combined_pip_by_type_sig_multi))[1] "Number of genes with PIP > 0.8 -- Multi-group = 67"sprintf("Number of genes with PIP > 0.8 -- single eQTL = %s", nrow(combined_pip_by_type_sig_single))[1] "Number of genes with PIP > 0.8 -- single eQTL = 29"sprintf("Number of overlapped genes = %s", sum(combined_pip_by_type_sig_single$gene_name %in% combined_pip_by_type_sig_multi$gene_name))[1] "Number of overlapped genes = 18"genes_not_reported <- combined_pip_by_type_sig_single$gene_name[!combined_pip_by_type_sig_single$gene_name %in%combined_pip_by_type_sig_multi$gene_name]
DT::datatable(combined_pip_by_type_sig_single[combined_pip_by_type_sig_single$gene_name %in% genes_not_reported,],caption = htmltools::tags$caption( style = 'caption-side: topleft; text-align = left; color:black;','Genes not reported by multi-group analysis'),options = list(pageLength = 5) )DT::datatable(combined_pip_by_type_cs_multi[combined_pip_by_type_cs_multi$gene_name %in% genes_not_reported,],caption = htmltools::tags$caption( style = 'caption-side: topleft; text-align = left; color:black;','Genes not reported by multi-group analysis'),options = list(pageLength = 5) )gene_multi_unique_type <- combined_pip_by_group_sig_multi[!combined_pip_by_group_sig_multi$gene_name %in% combined_pip_by_type_sig_single$gene_name,]
plot_heatmap(heatmap_data = gene_multi_unique_type, main = "PIP partition for unique genes found by multi-group analysis")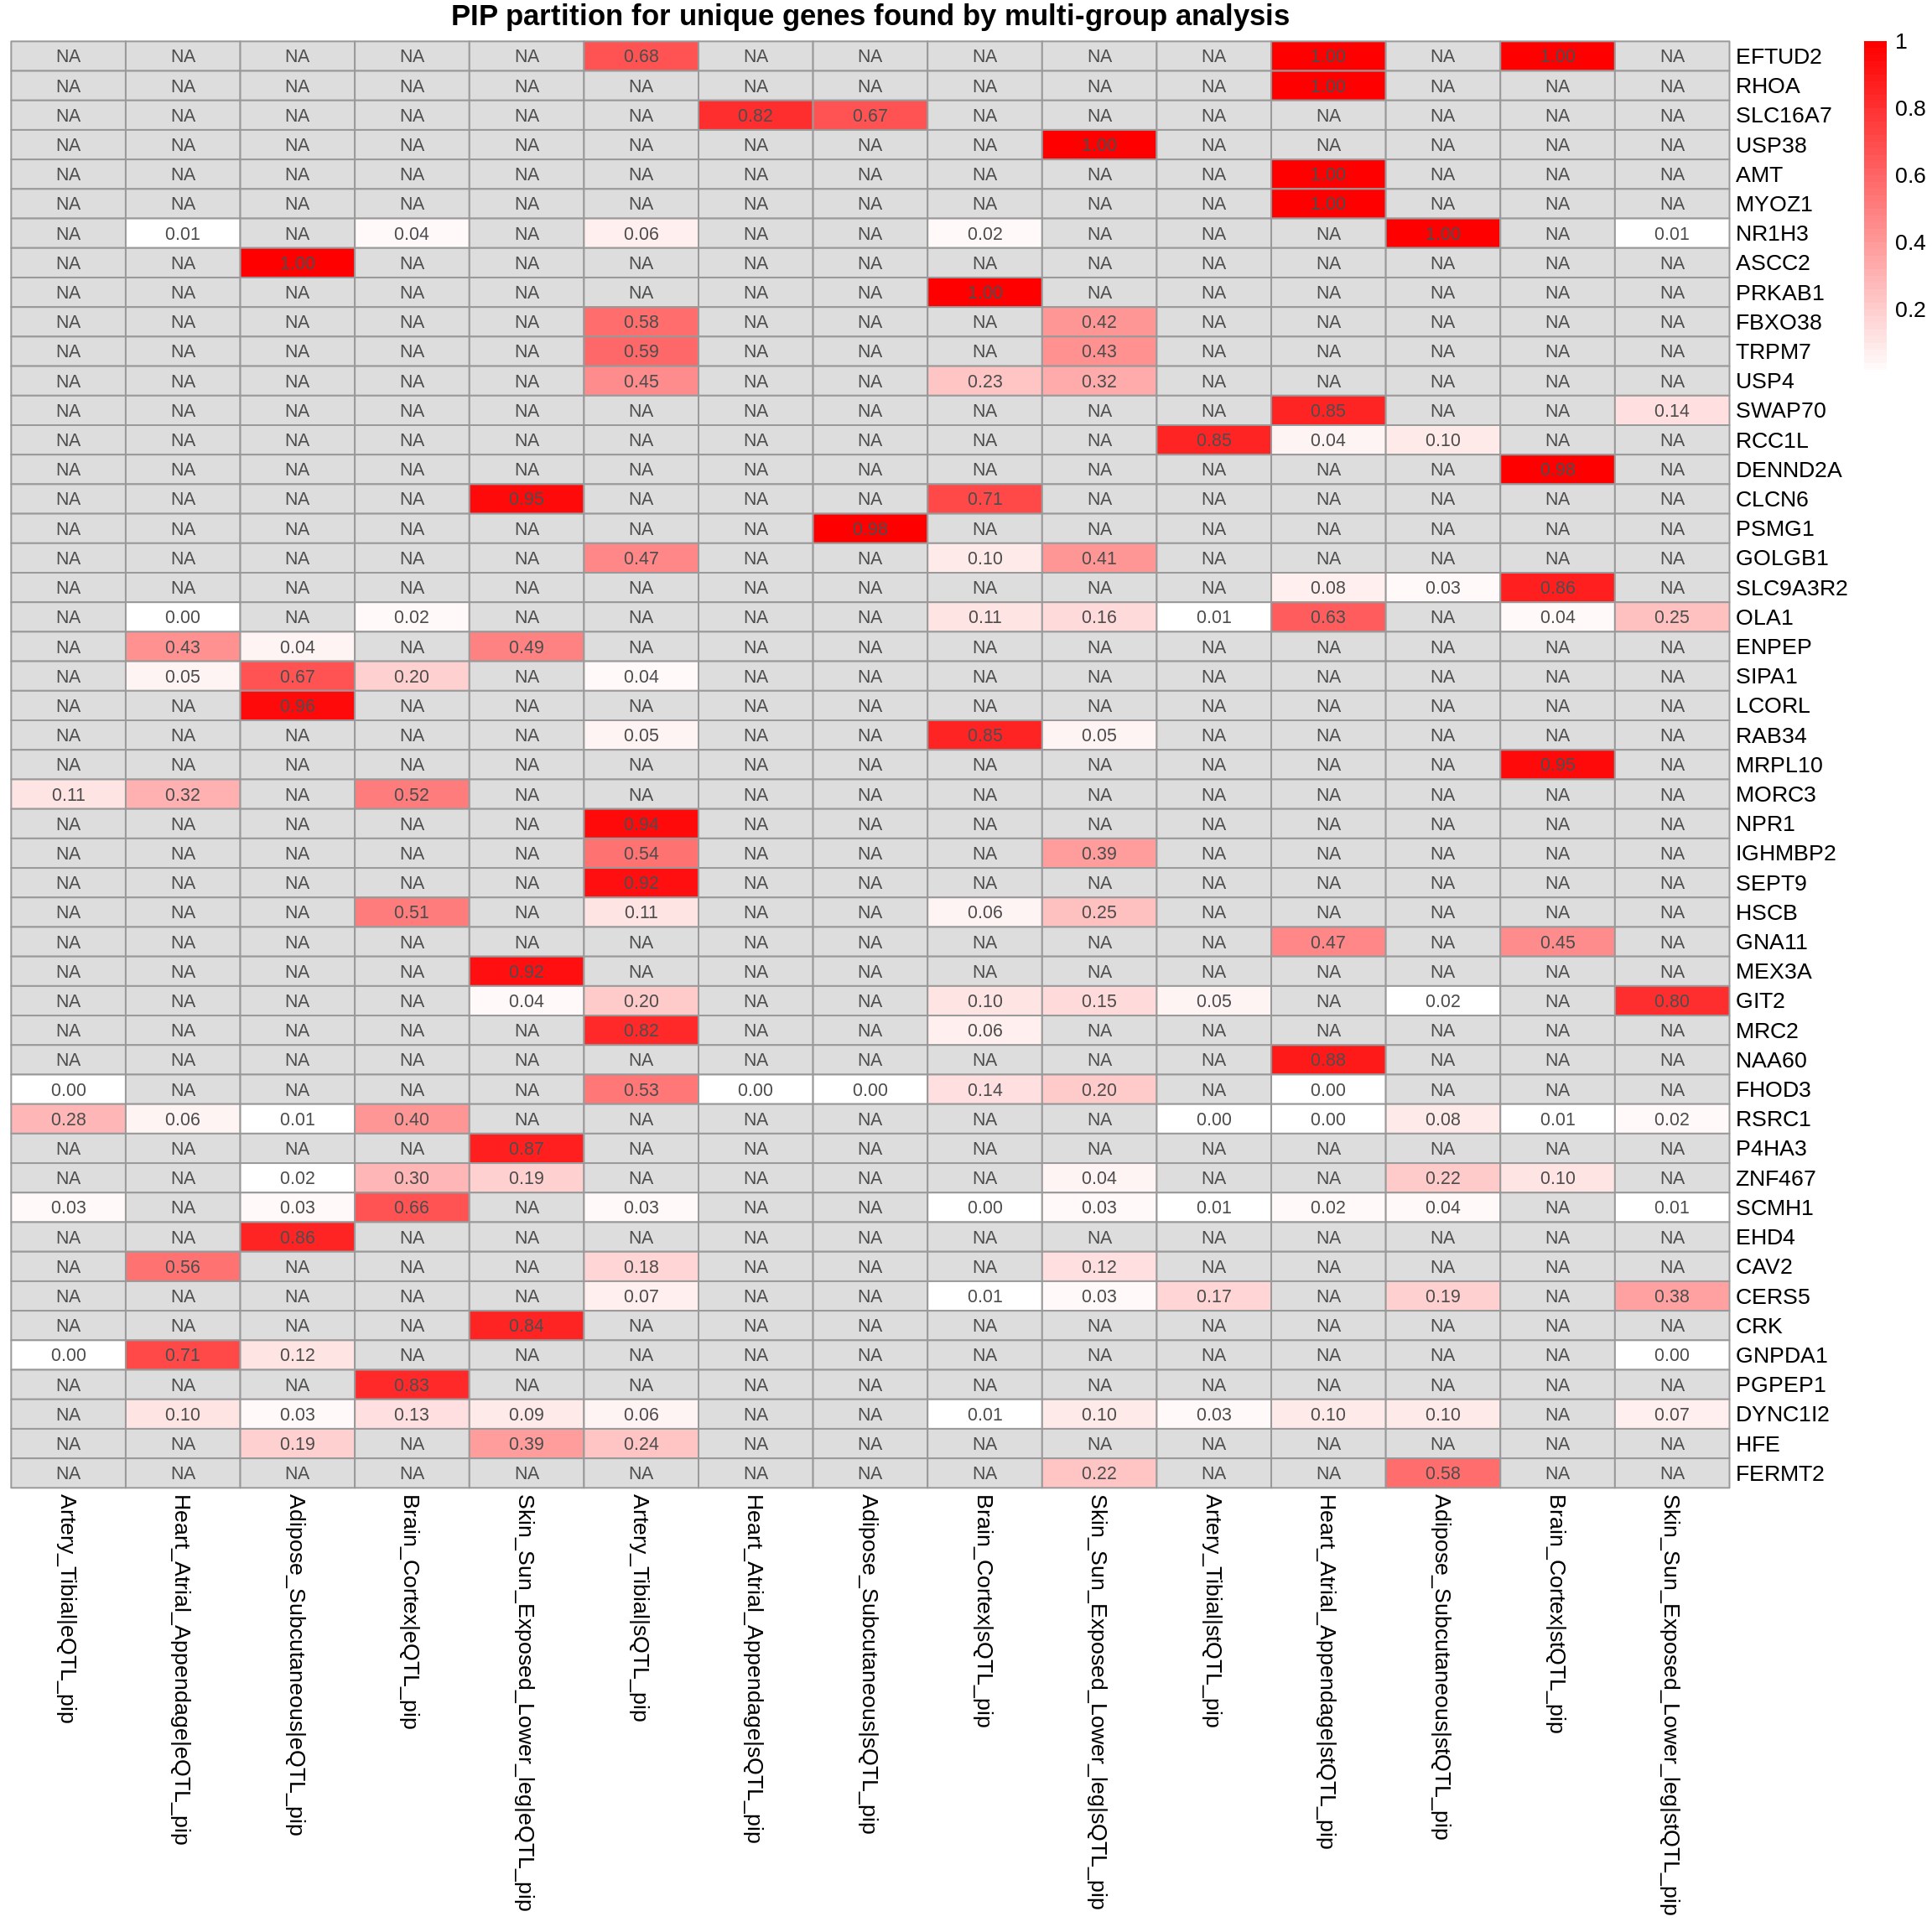
| Version | Author | Date |
|---|---|---|
| eb58424 | XSun | 2024-10-17 |
Exploring allelic heterogeneity
pip_per_cs <- compute_pip_per_cs(combined_pip_by_group_sig_multi, susie_alpha_res_multi)

DT::datatable(pip_per_cs,caption = htmltools::tags$caption( style = 'caption-side: topleft; text-align = left; color:black;','PIP per CS'),options = list(pageLength = 5) )
SCZ-ieu-b-5102
Parameter
trait <- "SCZ-ieu-b-5102"
gwas_n <- samplesize[trait]
tissue <- c("Brain_Hippocampus","Adrenal_Gland","Brain_Spinal_cord_cervical_c-1","Spleen","Heart_Left_Ventricle")


results_dir_multi <- paste0("/project/xinhe/xsun/multi_group_ctwas/11.multi_group_1008/results/",trait,"/")
ctwas_res_multi <- readRDS(paste0(results_dir_multi,trait,".ctwas.res.RDS"))

param_multi <- ctwas_res_multi$param
make_convergence_plots(param_multi, gwas_n, colors = colors)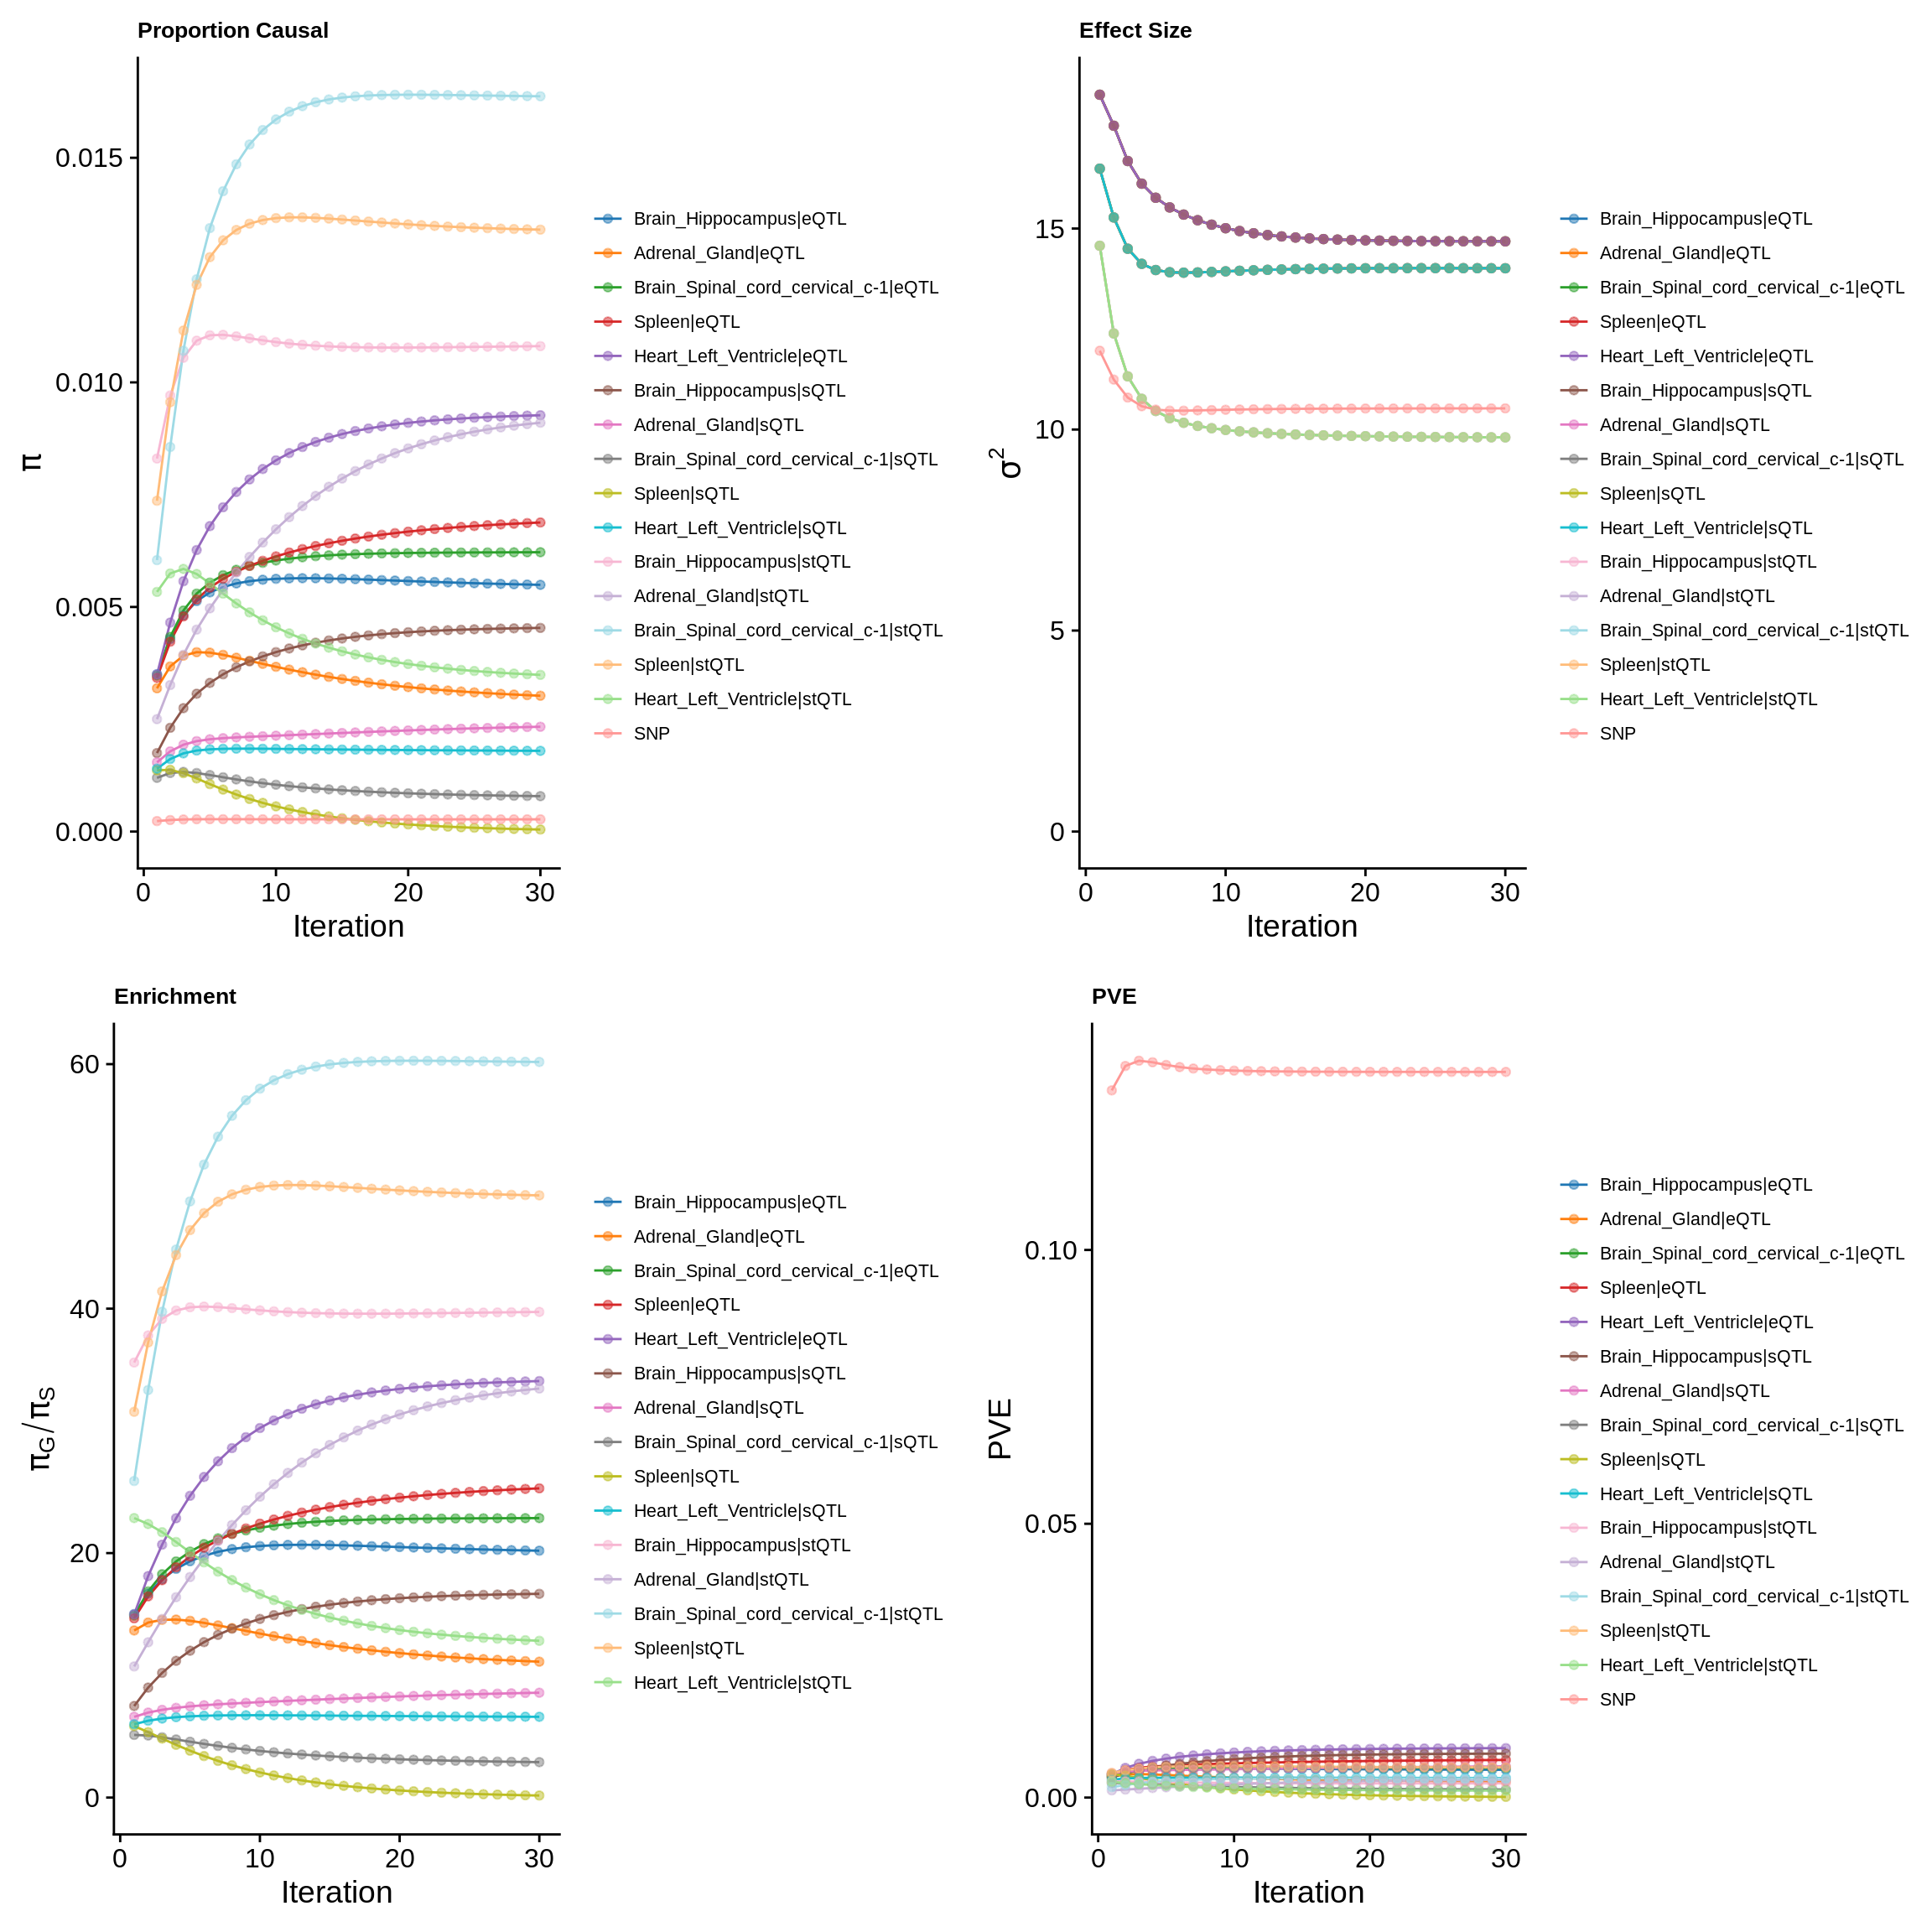
ctwas_parameters_multi <- summarize_param(param_multi, gwas_n)
pve_pie_by_type_multi <- plot_piechart(ctwas_parameters = ctwas_parameters_multi, colors = colors, by = "type")
pve_pie_by_context_multi <- plot_piechart(ctwas_parameters = ctwas_parameters_multi, colors = colors, by = "context")

gridExtra::grid.arrange(pve_pie_by_type_multi,pve_pie_by_context_multi, ncol = 2)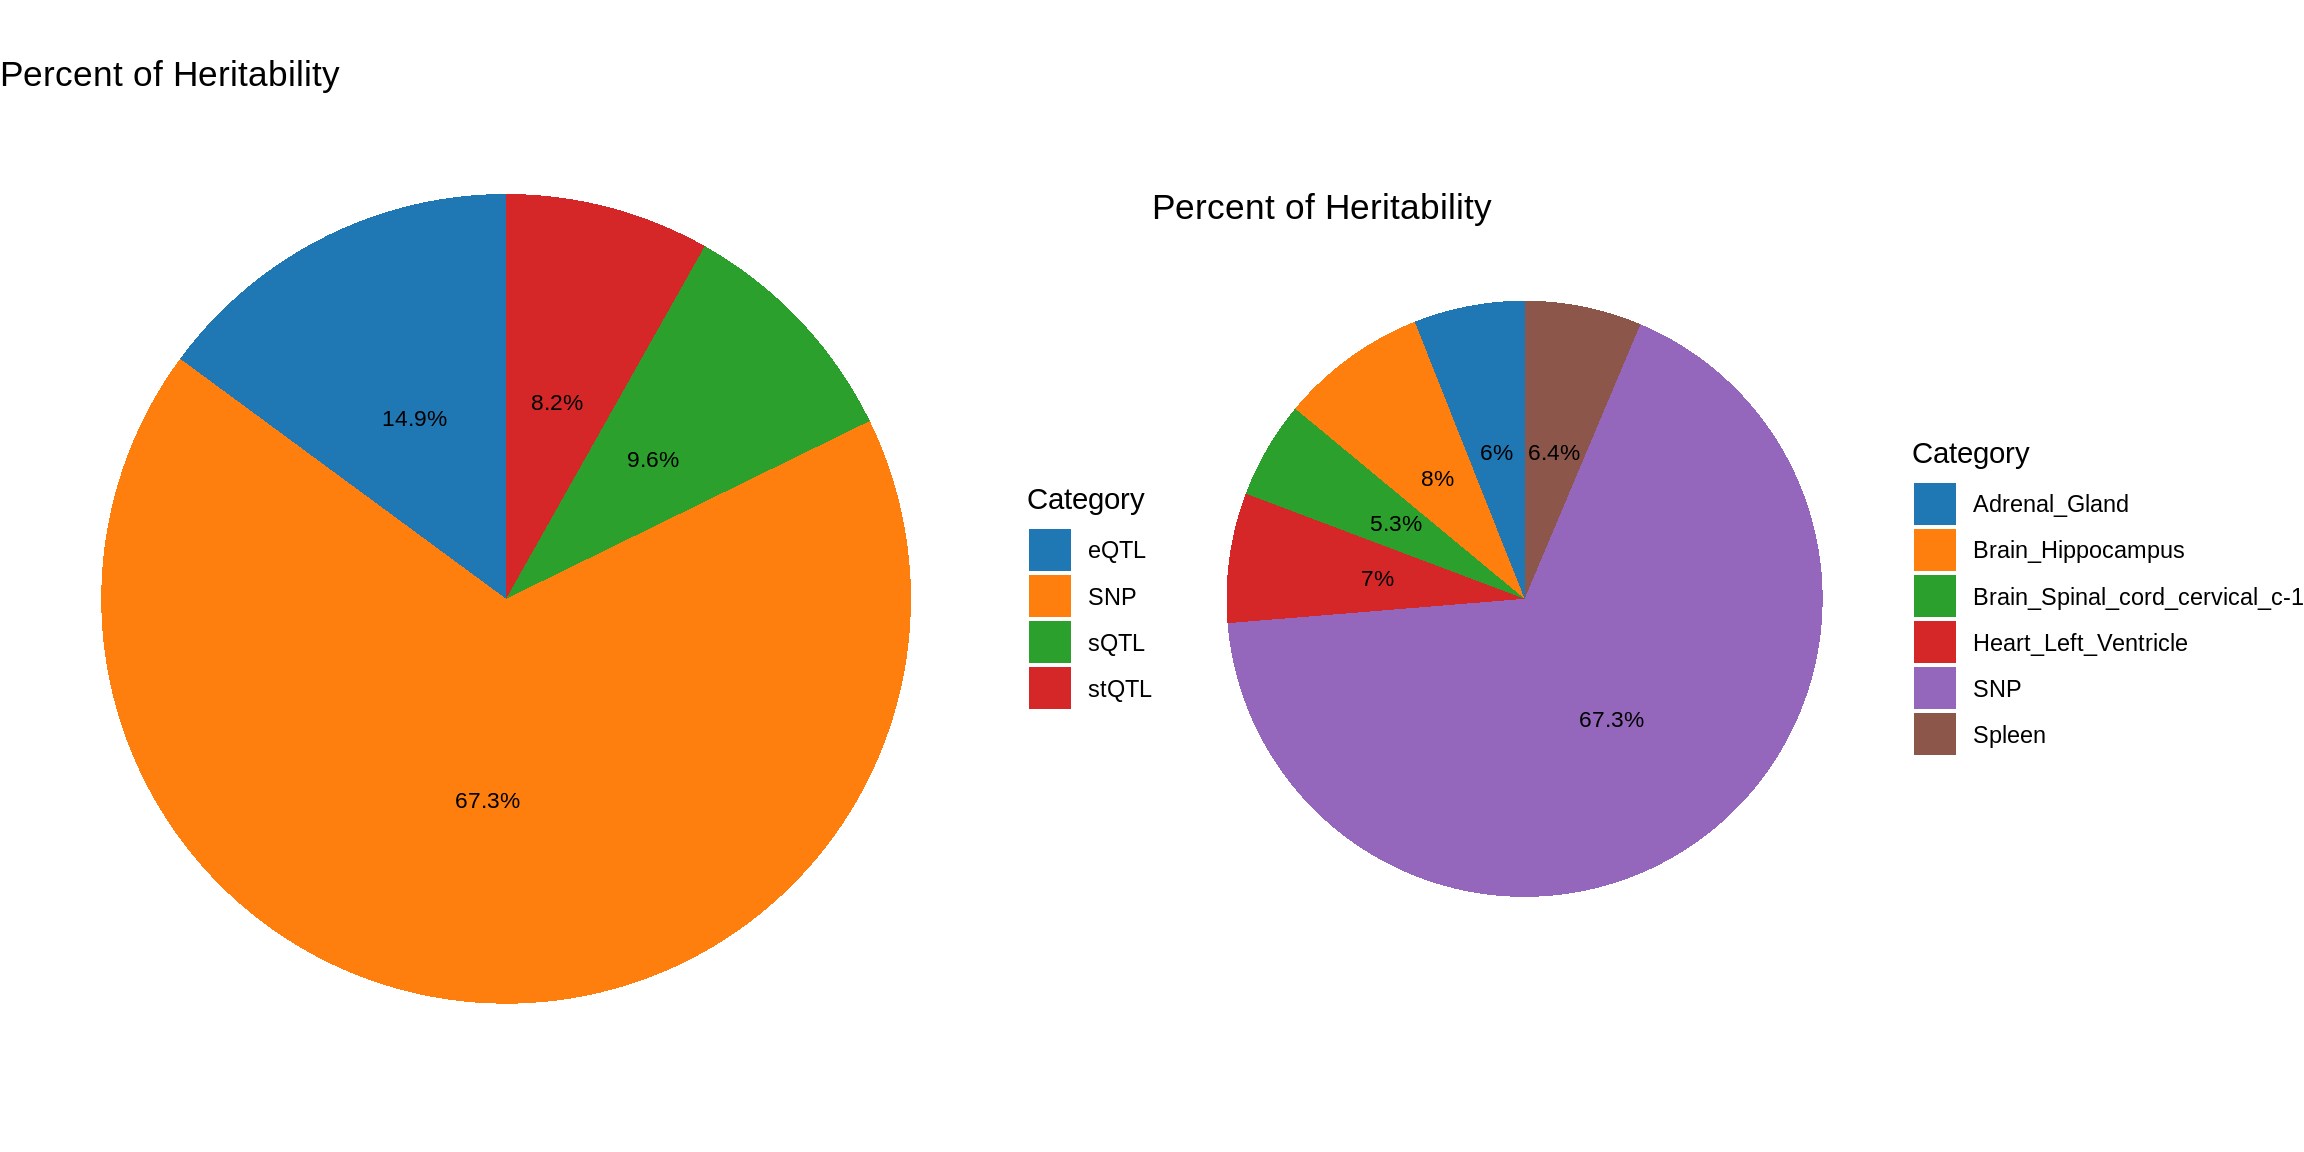
| Version | Author | Date |
|---|---|---|
| eb58424 | XSun | 2024-10-17 |
Postprocessing – LD mismatch
finemap_res_multi <- ctwas_res_multi$finemap_res
finemap_res_multi <- ctwas_res_multi$finemap_res

finemap_res_multi_gene <- finemap_res_multi[finemap_res_multi$type != "SNP",]

ggplot(data = finemap_res_multi_gene, aes(x= abs(z), y= susie_pip)) +
  geom_point() +
  ggtitle("Z scores vs PIP") +
  theme_minimal()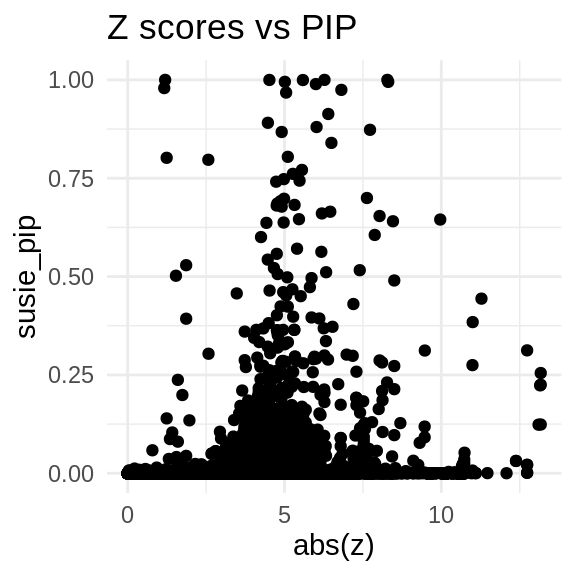
load(paste0("/project/xinhe/xsun/multi_group_ctwas/11.multi_group_1008/ld_mismatch/LD_mismatch_", trait,".rdata"))

sprintf("The number of problematic regions = %s", length(problematic_region_ids))
[1] "The number of problematic regions = 3"sprintf("The number of problematic genes = %s", length(problematic_genes))[1] "The number of problematic genes = 7"sprintf("The number of problematic snps = %s", length(res$problematic_snps))[1] "The number of problematic snps = 253"sprintf("The number of flipped snps = %s", length(res$flipped_snps))[1] "The number of flipped snps = 2"problematic_snps <- res$condz_stats[res$condz_stats$id %in% res$problematic_snps,]
DT::datatable(problematic_snps,caption = htmltools::tags$caption(style = 'caption-side: topleft; text-align = left; color:black;','Stats for problematic snps'),options = list(pageLength = 5) )finemap_origin_res_problematic_region <- finemap_res_multi[finemap_res_multi$id %in% problematic_genes,]
merge_origin_nold <- merge(finemap_origin_res_problematic_region,finemap_noLD_res_problematic_region, by = "id")
merge_origin_nold <- merge_origin_nold[,c("id","susie_pip.x","susie_pip.y")]
colnames(merge_origin_nold) <- c("id","susie_pip_origin","susie_pip_ld-mismatch-fixed")
DT::datatable(merge_origin_nold,caption = htmltools::tags$caption(style = 'caption-side: topleft; text-align = left; color:black;','Original PIP and fixed PIP for problematic genes'),options = list(pageLength = 5) )Fine-mapping (LD mis-match fixed)
susie_alpha_res_multi <- ctwas_res_multi$susie_alpha_res
rerun_finemap_res <- res$finemap_res
rerun_susie_alpha_res <- res$susie_alpha_res
res <- update_finemap_res(finemap_res_multi,
                          susie_alpha_res_multi,
                          rerun_finemap_res,
                          rerun_susie_alpha_res,
                          updated_region_ids = problematic_region_ids)

finemap_res_multi <- res$finemap_res
susie_alpha_res_multi <- res$susie_alpha_res

susie_alpha_res_multi <- anno_susie_alpha_res(susie_alpha_res_multi,
                                        mapping_table = mapping_two,
                                        map_by = "molecular_id",
                                        drop_unmapped = TRUE)
2024-11-26 14:51:36 INFO::Annotating susie alpha result ...
2024-11-26 14:51:36 INFO::Map molecular traits to genes
2024-11-26 14:51:37 INFO::Split PIPs for molecular traits mapped to multiple genescombined_pip_by_type_cs_multi <- combine_gene_pips(susie_alpha_res_multi,
group_by = "gene_name",
by = "type",
method = "combine_cs",
filter_cs = TRUE,
include_cs_id = T)
combined_pip_by_context_cs_multi <- combine_gene_pips(susie_alpha_res_multi,
group_by = "gene_name",
by = "context",
method = "combine_cs",
filter_cs = TRUE,
include_cs_id = T)
DT::datatable(combined_pip_by_type_cs_multi[combined_pip_by_type_cs_multi$combined_pip>0.8,],caption = htmltools::tags$caption( style = 'caption-side: topleft; text-align = left; color:black;','Combined PIP by omics'),options = list(pageLength = 5) )DT::datatable(combined_pip_by_context_cs_multi[combined_pip_by_context_cs_multi$combined_pip>0.8,],caption = htmltools::tags$caption( style = 'caption-side: topleft; text-align = left; color:black;','Combined PIP by tissue'),options = list(pageLength = 5) )combined_pip_by_group_multi <- combine_gene_pips(susie_alpha_res_multi,
group_by = "gene_name",
by = "group",
method = "combine_cs",
filter_cs = TRUE,
include_cs_id = F)
combined_pip_by_group_sig_multi <- combined_pip_by_group_multi[combined_pip_by_group_multi$combined_pip > 0.8,]
plot_heatmap(heatmap_data = combined_pip_by_group_sig_multi, main = "PIP partitions for genes with PIP>0.8")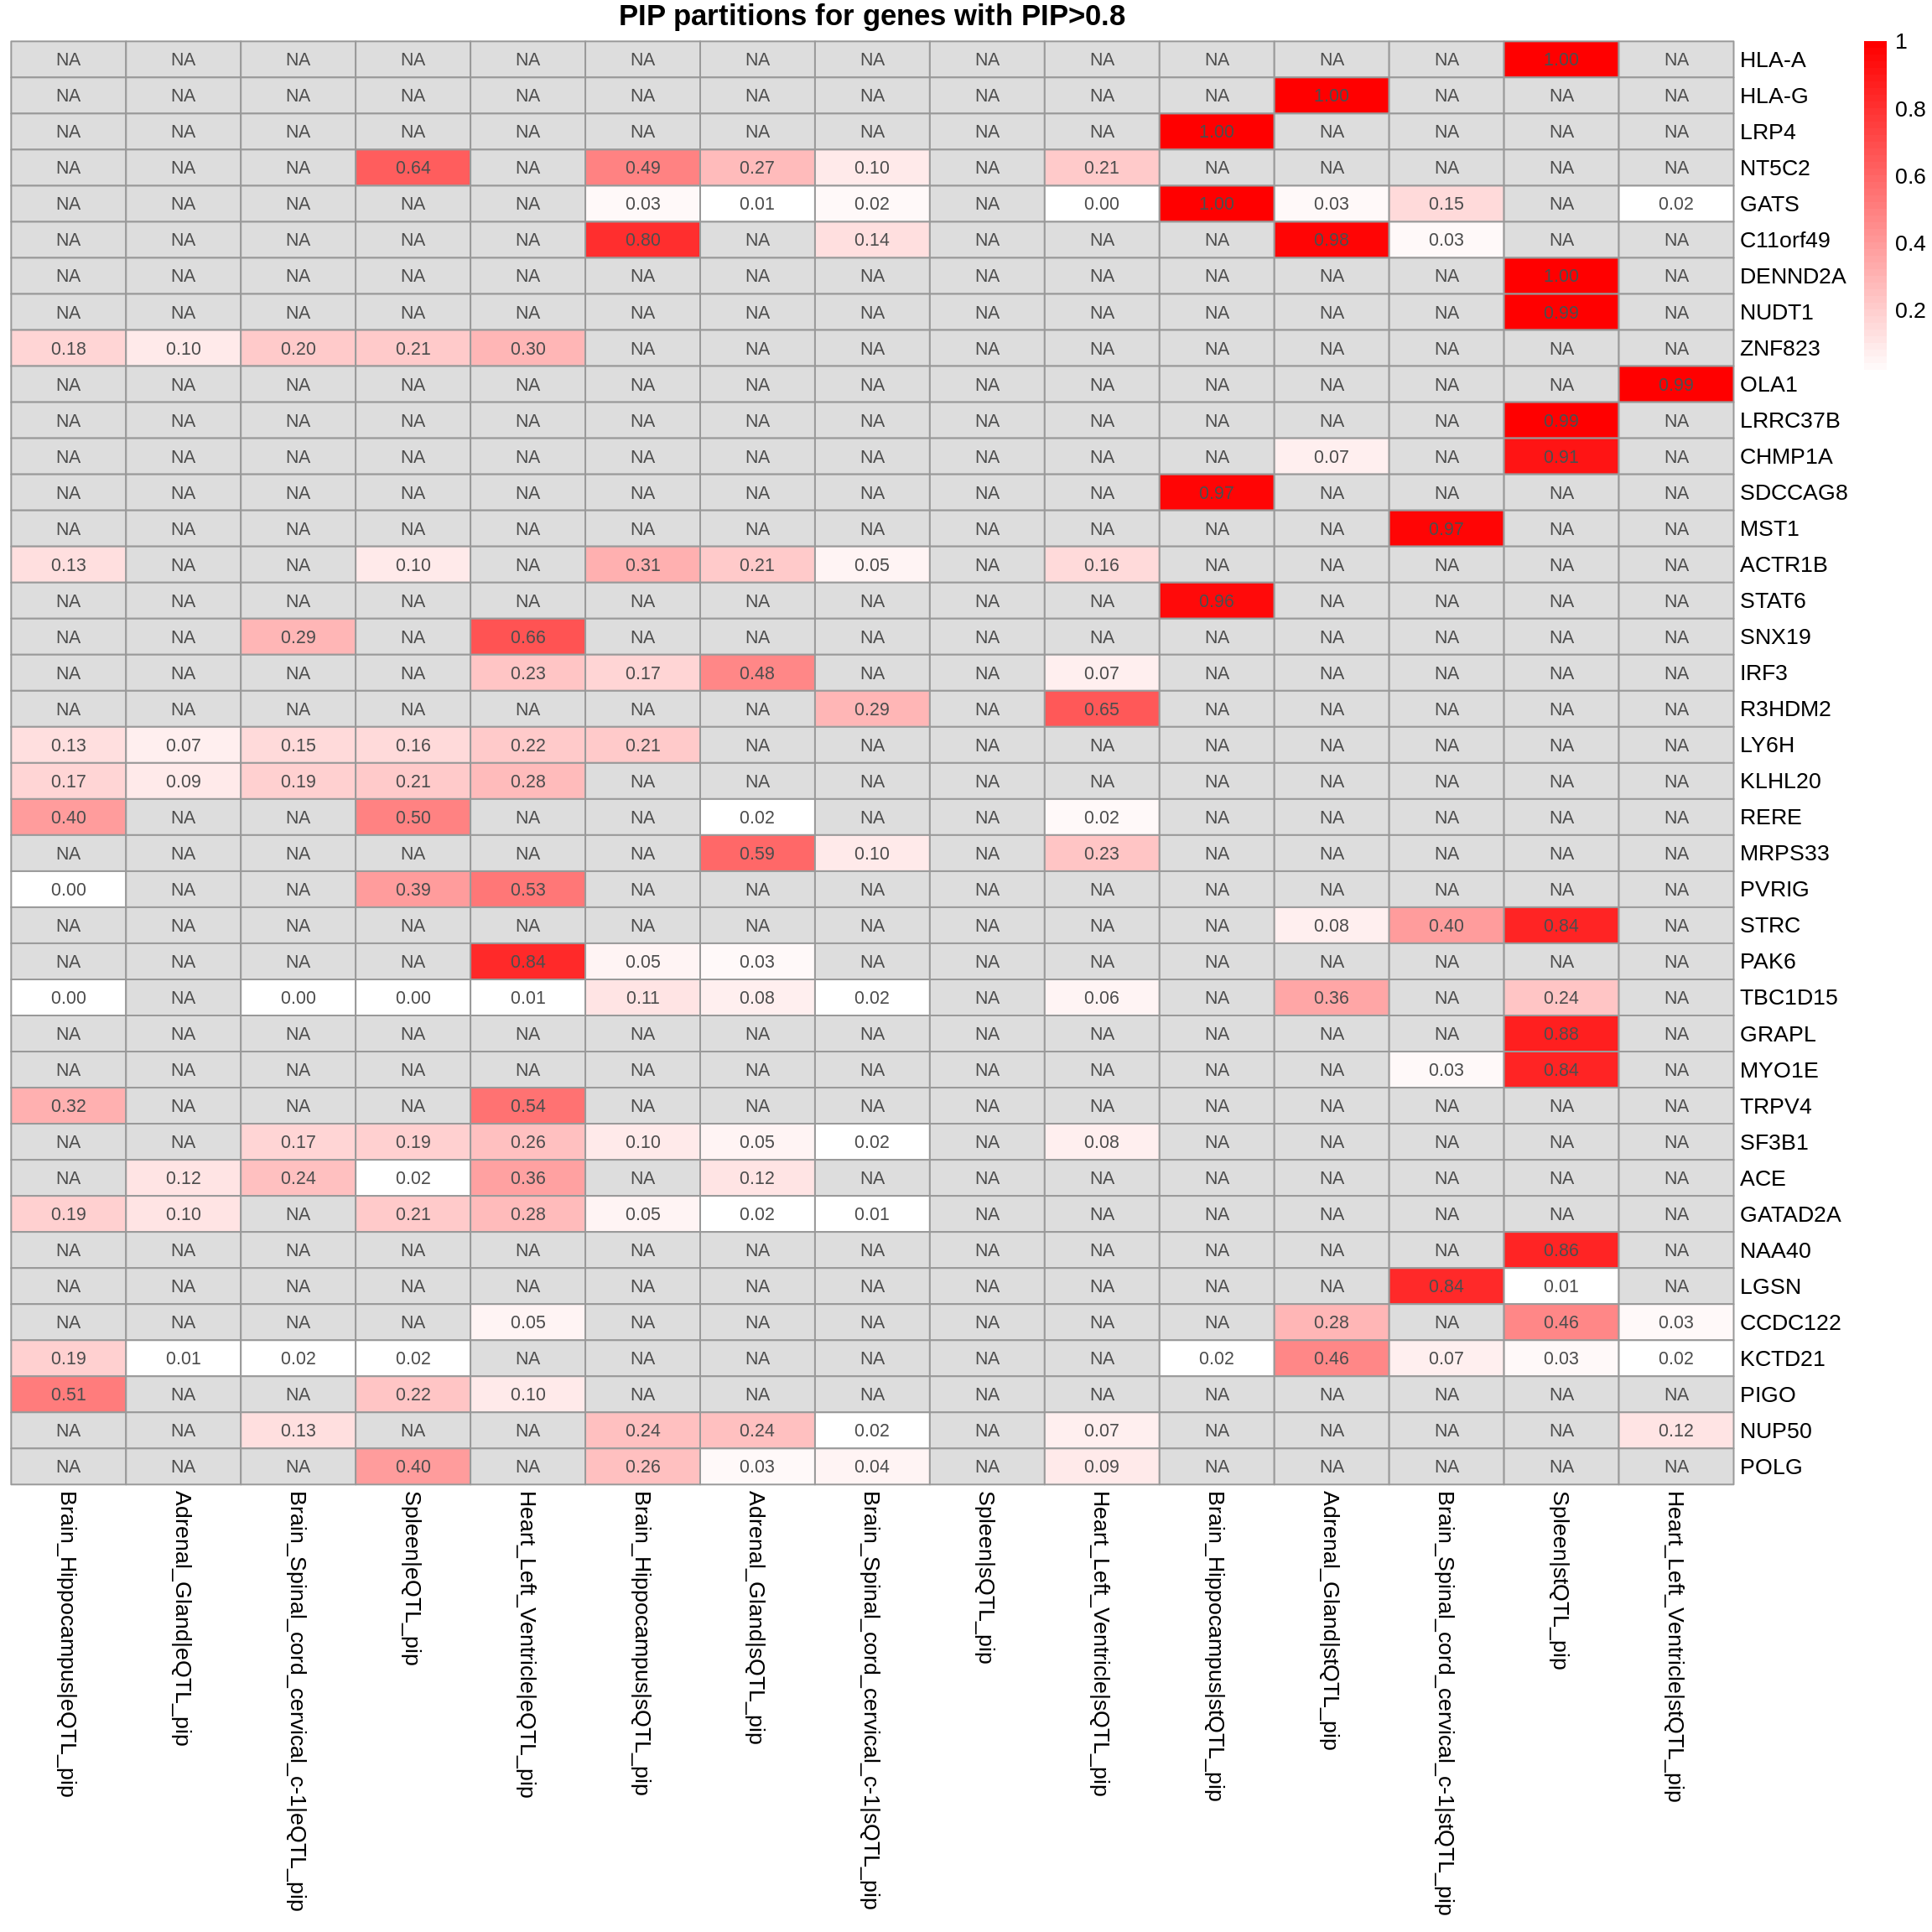
Comparing with single tissue + eQTL analysis
ctwas_res_single <- readRDS(paste0("/project/xinhe/xsun/multi_group_ctwas/10.single_tissue_1007/results/",trait,"/",tissue[1],"/",trait,"_",tissue[1], ".ctwas.res.RDS"))

susie_alpha_res_single <- ctwas_res_single$susie_alpha_res

susie_alpha_res_single <- anno_susie_alpha_res(susie_alpha_res_single,
                                        mapping_table = mapping_predictdb,
                                        map_by = "molecular_id",
                                        drop_unmapped = TRUE)
2024-11-26 14:51:51 INFO::Annotating susie alpha result ...
2024-11-26 14:51:51 INFO::Map molecular traits to genescombined_pip_by_type_single <- combine_gene_pips(susie_alpha_res_single,
group_by = "gene_name",
by = "type",
method = "combine_cs",
filter_cs = TRUE,
include_cs_id = F)
combined_pip_by_type_sig_single <- combined_pip_by_type_single[combined_pip_by_type_single$combined_pip > 0.8,]
combined_pip_by_type_sig_multi <- combined_pip_by_type_cs_multi[combined_pip_by_type_cs_multi$combined_pip > 0.8,]
sprintf("Number of genes with PIP > 0.8 -- Multi-group = %s", nrow(combined_pip_by_type_sig_multi))[1] "Number of genes with PIP > 0.8 -- Multi-group = 40"sprintf("Number of genes with PIP > 0.8 -- single eQTL = %s", nrow(combined_pip_by_type_sig_single))[1] "Number of genes with PIP > 0.8 -- single eQTL = 14"sprintf("Number of overlapped genes = %s", sum(combined_pip_by_type_sig_single$gene_name %in% combined_pip_by_type_sig_multi$gene_name))[1] "Number of overlapped genes = 7"genes_not_reported <- combined_pip_by_type_sig_single$gene_name[!combined_pip_by_type_sig_single$gene_name %in%combined_pip_by_type_sig_multi$gene_name]
DT::datatable(combined_pip_by_type_sig_single[combined_pip_by_type_sig_single$gene_name %in% genes_not_reported,],caption = htmltools::tags$caption( style = 'caption-side: topleft; text-align = left; color:black;','Genes not reported by multi-group analysis'),options = list(pageLength = 5) )DT::datatable(combined_pip_by_type_cs_multi[combined_pip_by_type_cs_multi$gene_name %in% genes_not_reported,],caption = htmltools::tags$caption( style = 'caption-side: topleft; text-align = left; color:black;','Genes not reported by multi-group analysis'),options = list(pageLength = 5) )gene_multi_unique_type <- combined_pip_by_group_sig_multi[!combined_pip_by_group_sig_multi$gene_name %in% combined_pip_by_type_sig_single$gene_name,]
plot_heatmap(heatmap_data = gene_multi_unique_type, main = "PIP partition for unique genes found by multi-group analysis")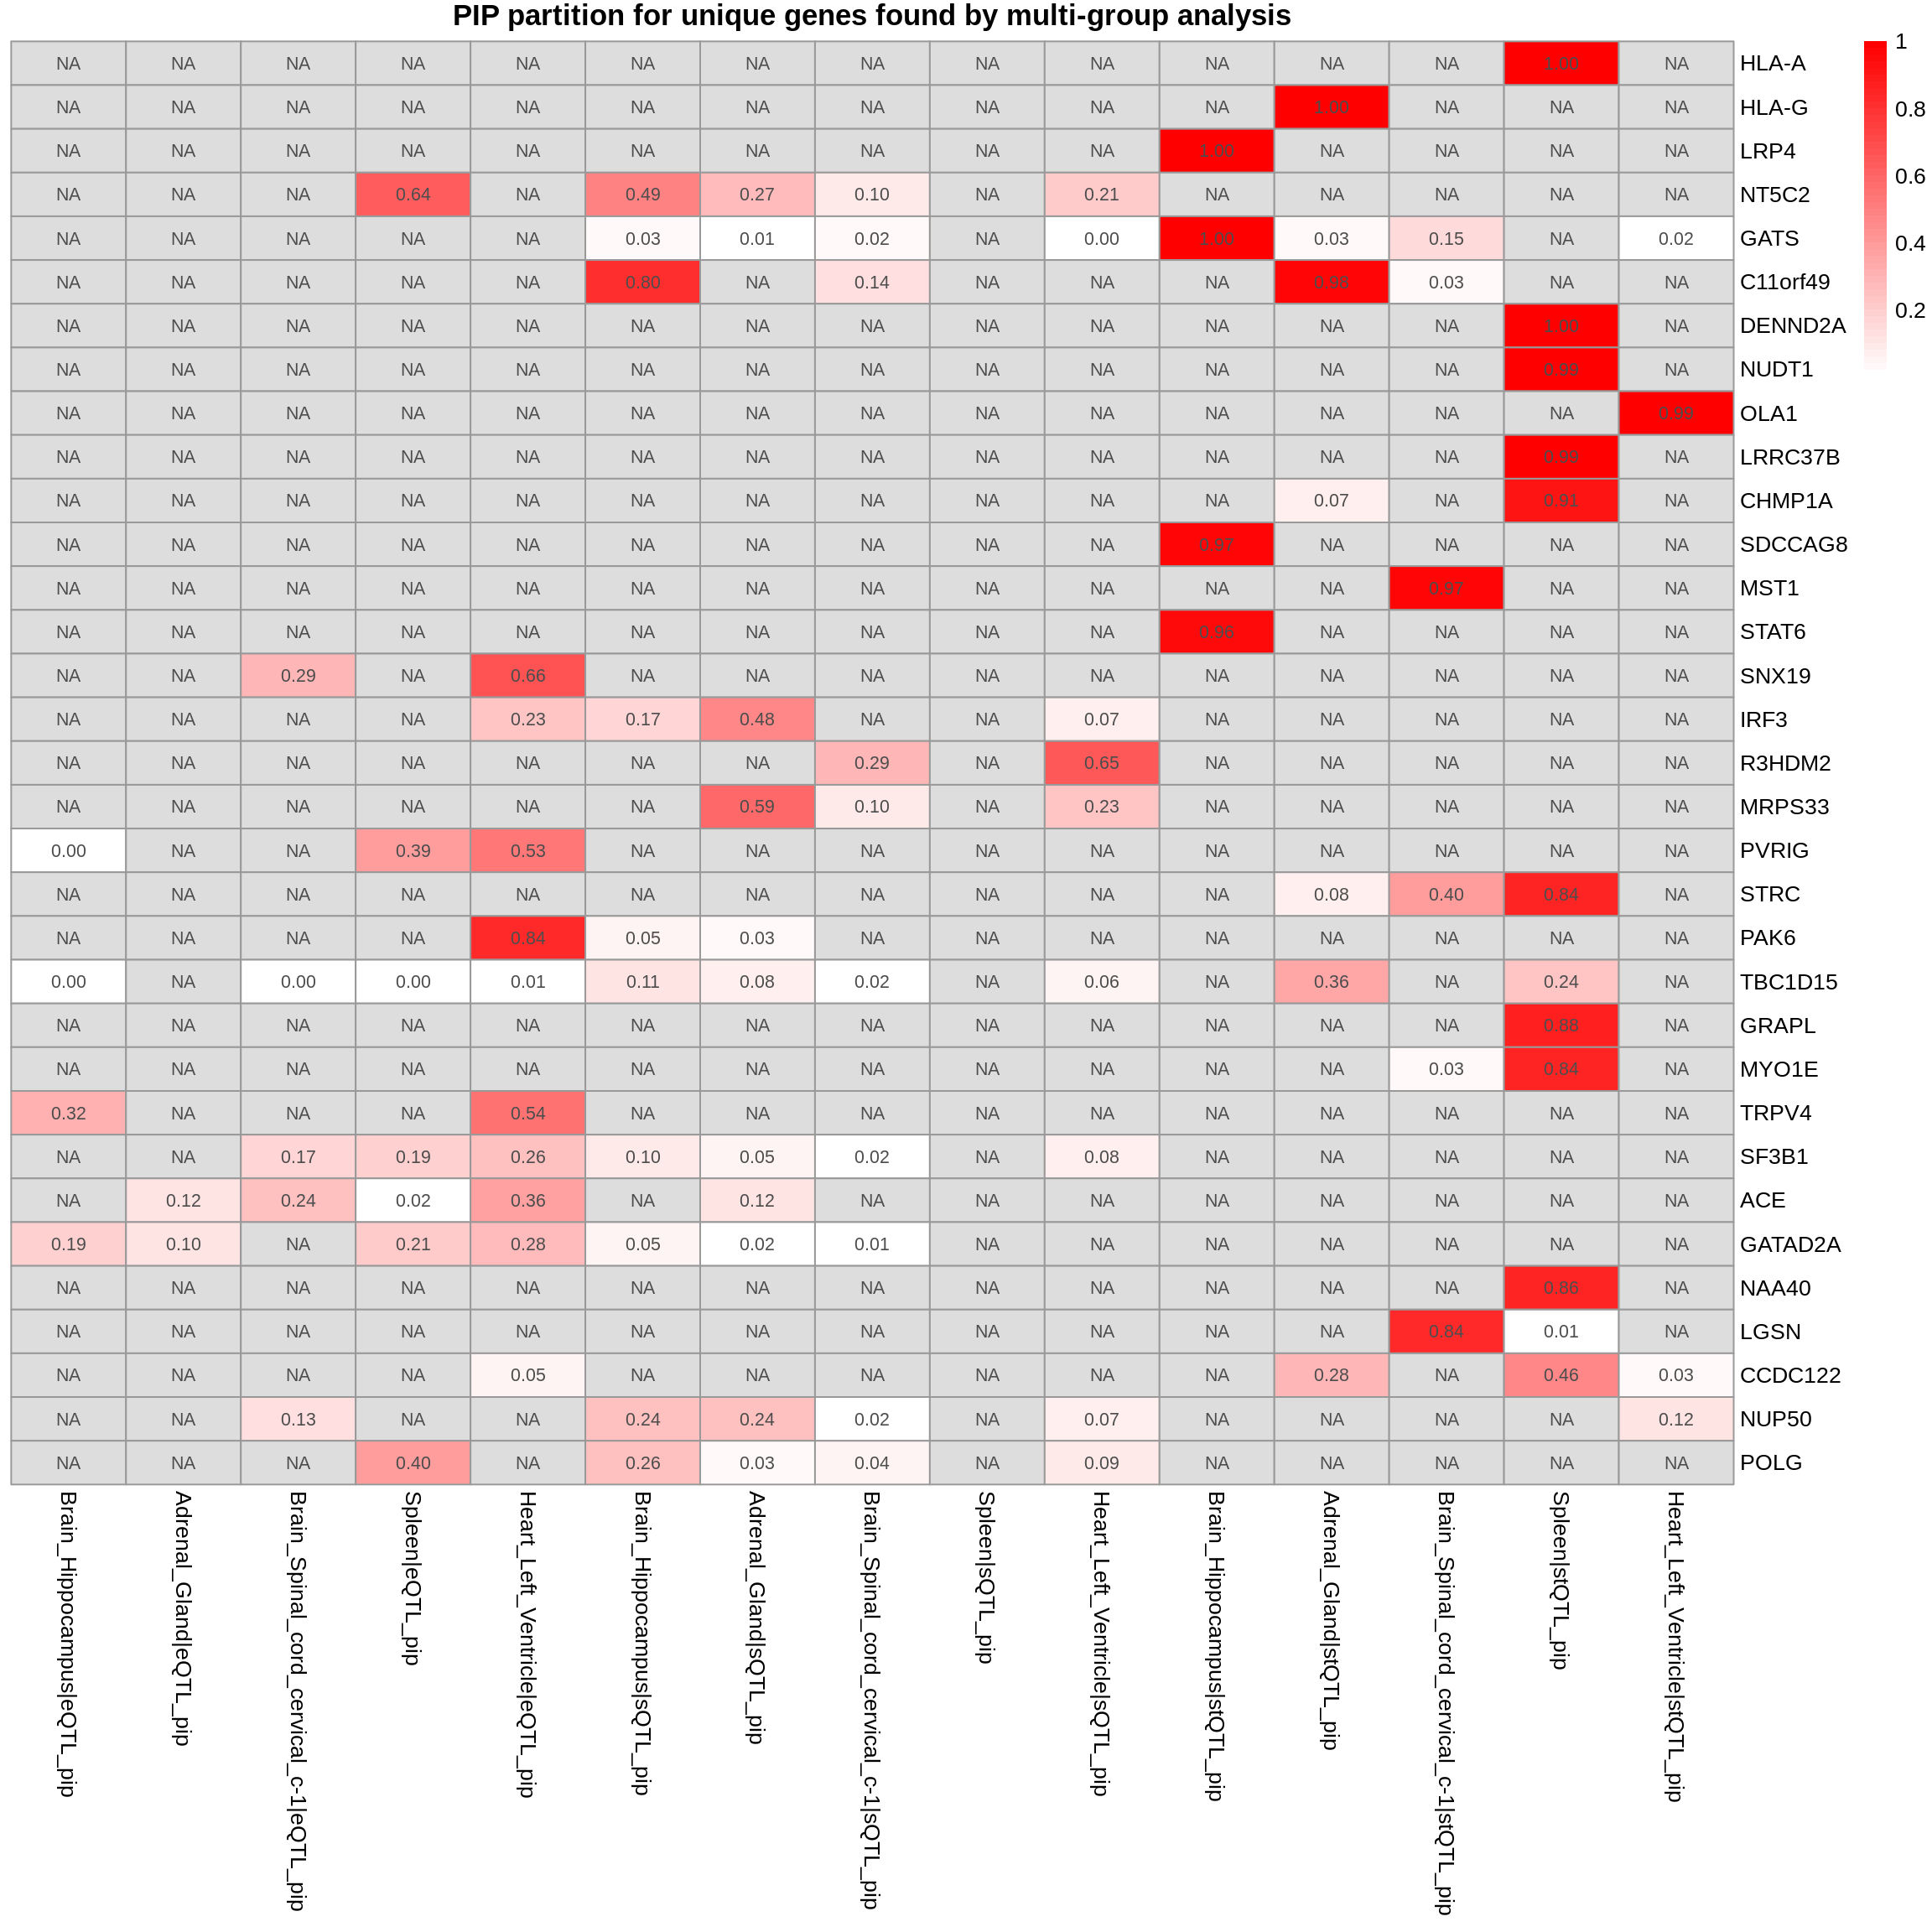
Exploring allelic heterogeneity
pip_per_cs <- compute_pip_per_cs(combined_pip_by_group_sig_multi, susie_alpha_res_multi)

DT::datatable(pip_per_cs,caption = htmltools::tags$caption( style = 'caption-side: topleft; text-align = left; color:black;','PIP per CS'),options = list(pageLength = 5) )
WBC-ieu-b-30
Parameter
trait <- "WBC-ieu-b-30"
gwas_n <- samplesize[trait]
tissue <- c("Whole_Blood","Adipose_Subcutaneous","Esophagus_Muscularis","Cells_Cultured_fibroblasts","Thyroid")


results_dir_multi <- paste0("/project/xinhe/xsun/multi_group_ctwas/11.multi_group_1008/results/",trait,"/")
ctwas_res_multi <- readRDS(paste0(results_dir_multi,trait,".ctwas.res.RDS"))

param_multi <- ctwas_res_multi$param
make_convergence_plots(param_multi, gwas_n, colors = colors)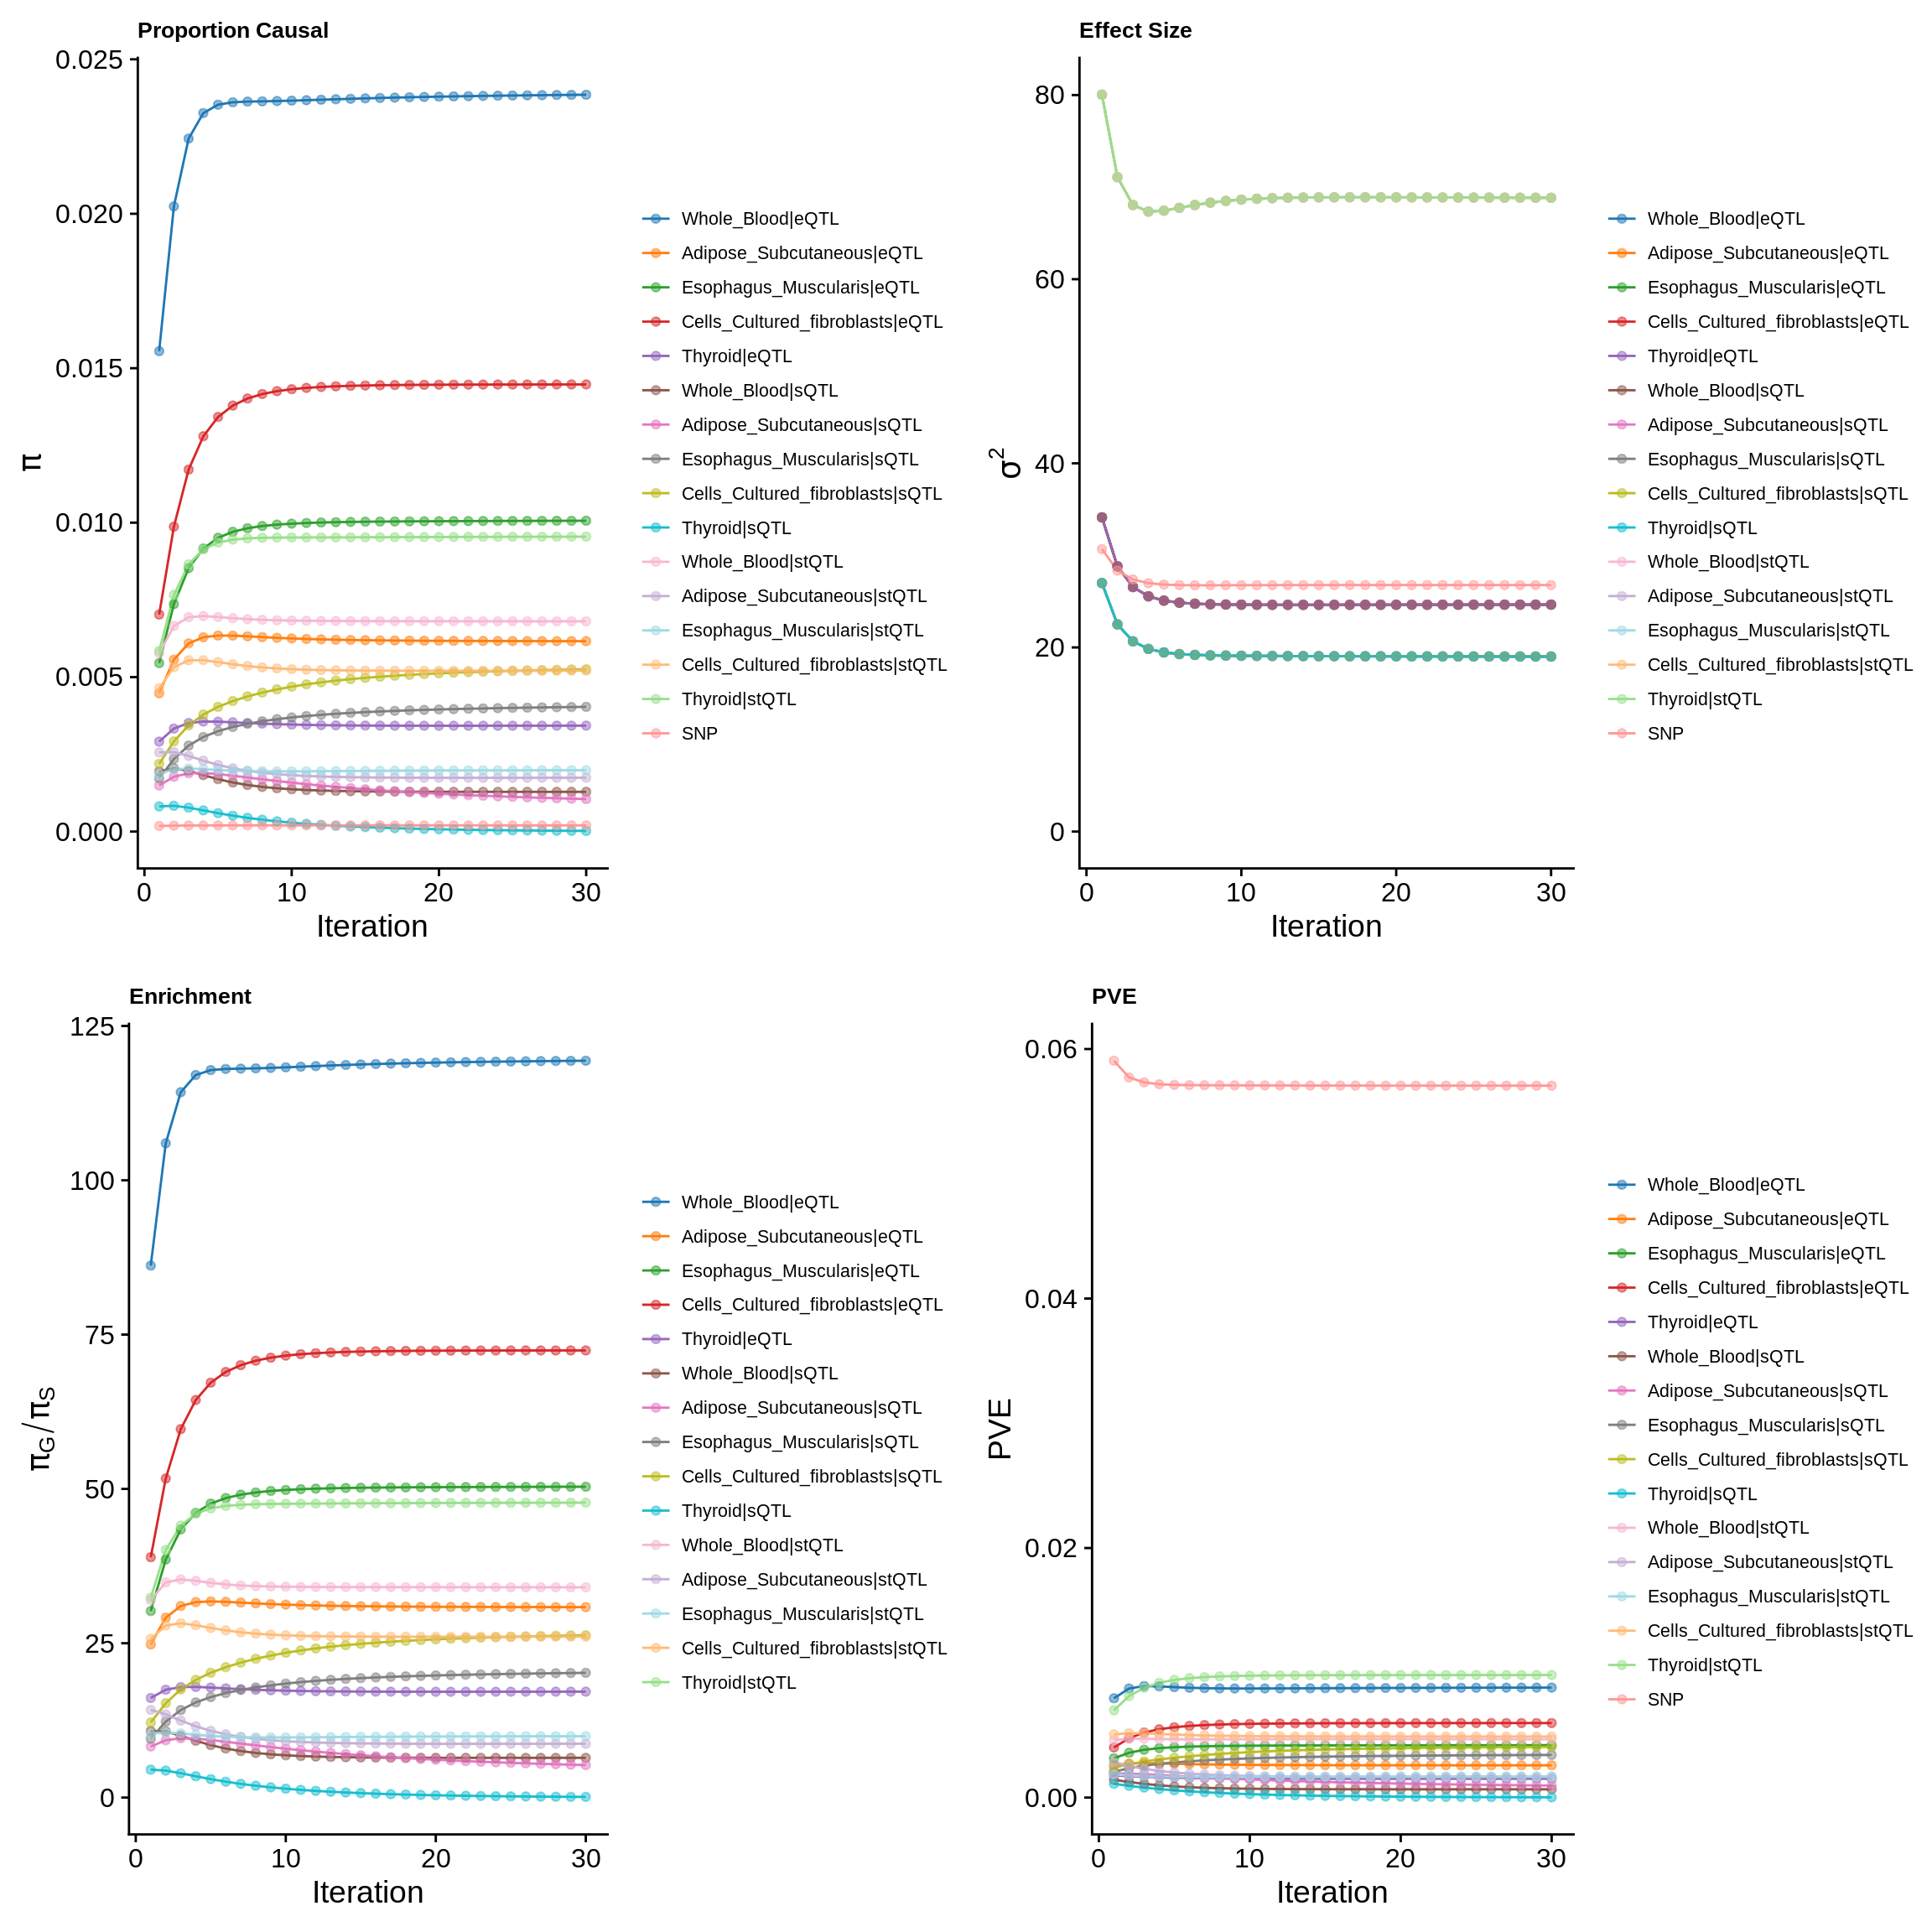
ctwas_parameters_multi <- summarize_param(param_multi, gwas_n)
pve_pie_by_type_multi <- plot_piechart(ctwas_parameters = ctwas_parameters_multi, colors = colors, by = "type")
pve_pie_by_context_multi <- plot_piechart(ctwas_parameters = ctwas_parameters_multi, colors = colors, by = "context")

gridExtra::grid.arrange(pve_pie_by_type_multi,pve_pie_by_context_multi, ncol = 2)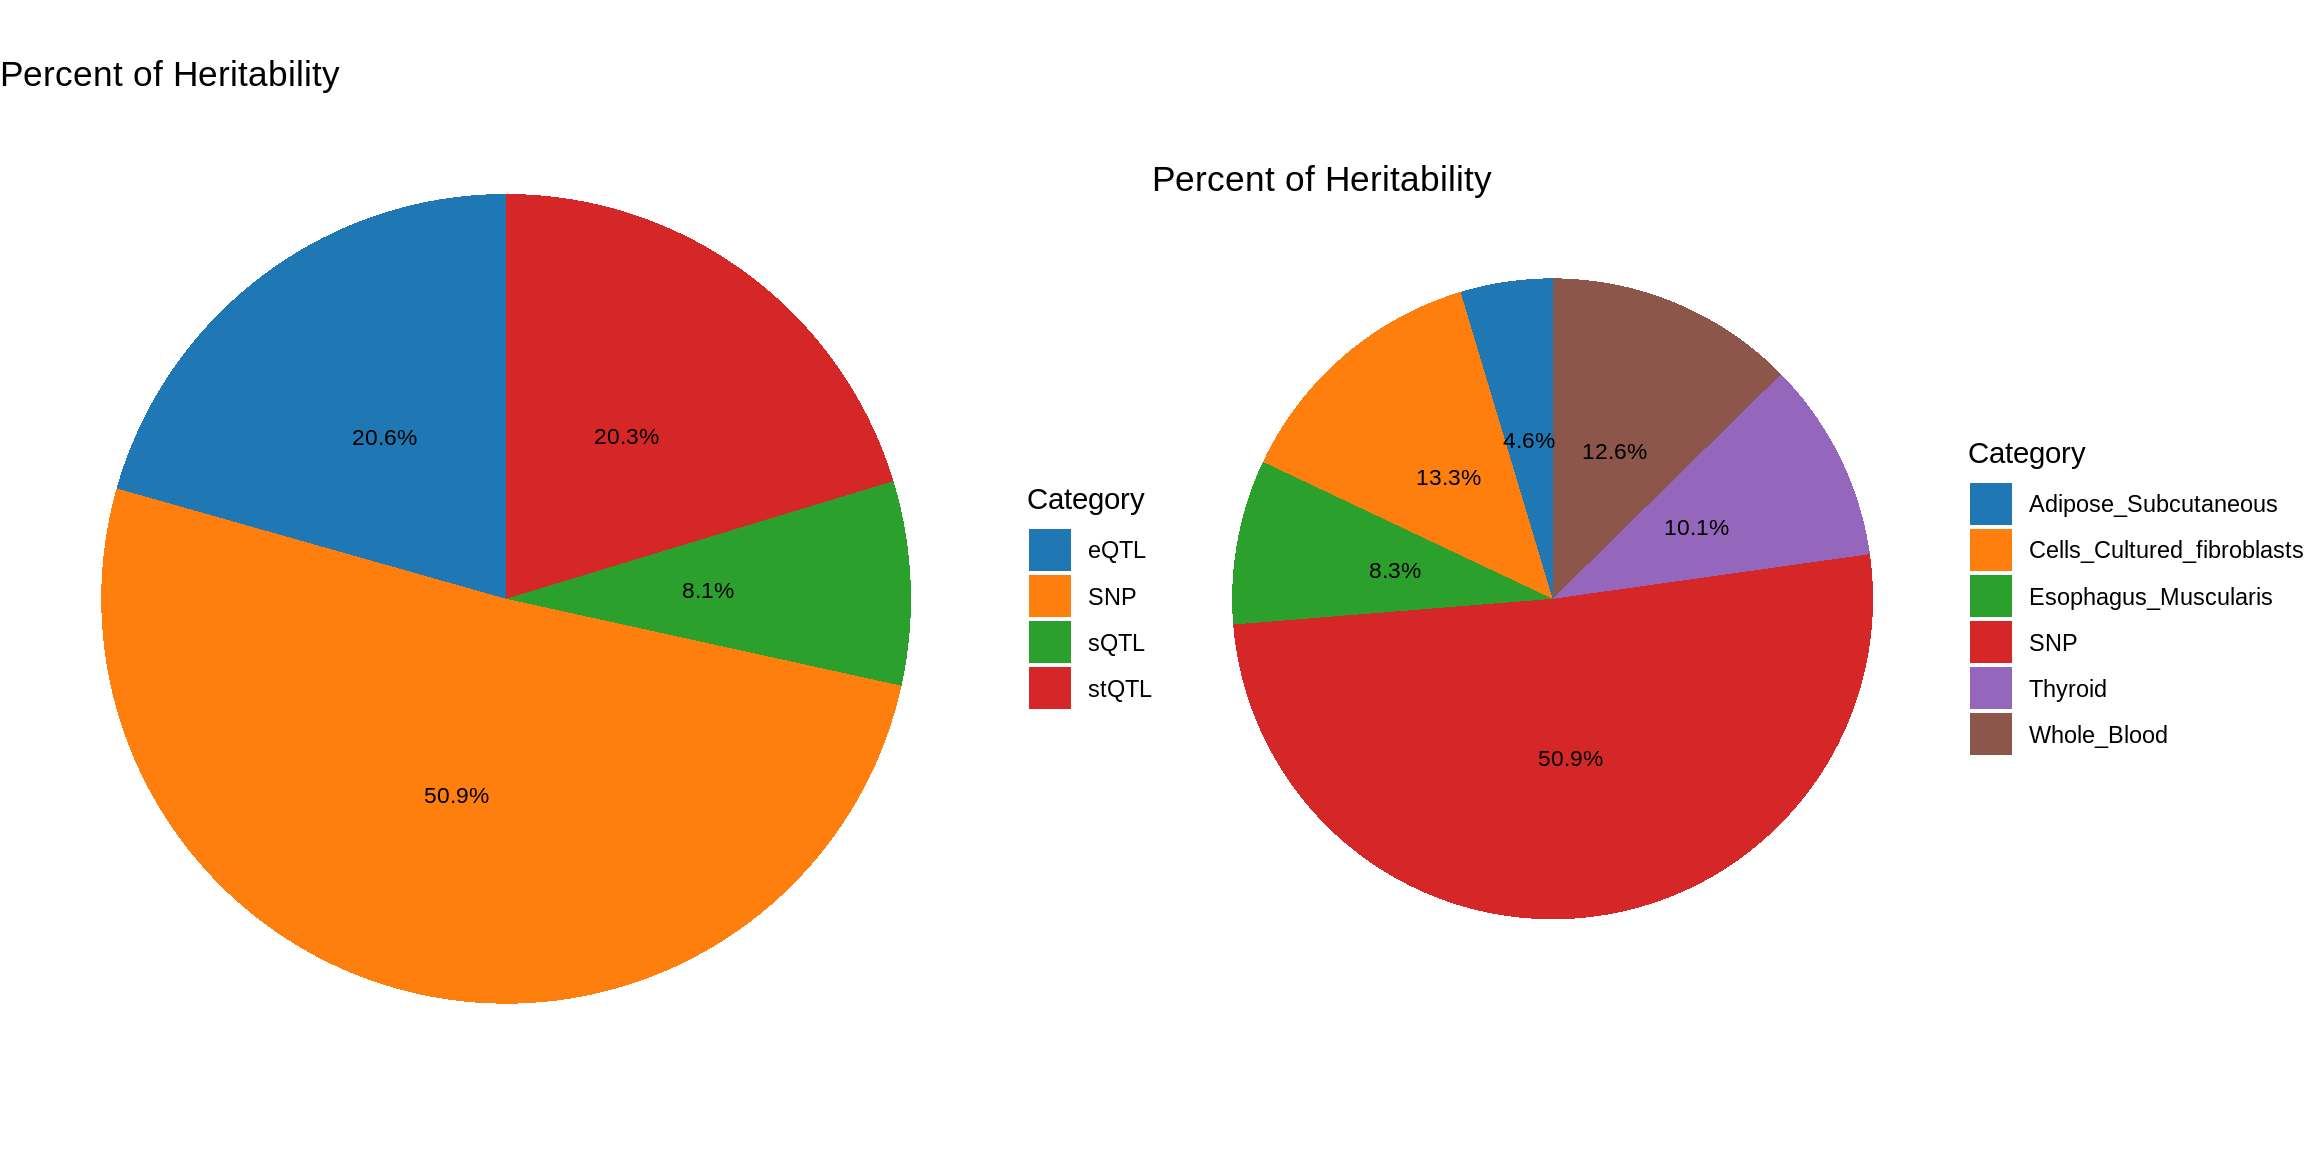
Postprocessing – LD mismatch
finemap_res_multi <- ctwas_res_multi$finemap_res
finemap_res_multi <- ctwas_res_multi$finemap_res

finemap_res_multi_gene <- finemap_res_multi[finemap_res_multi$type != "SNP",]

ggplot(data = finemap_res_multi_gene, aes(x= abs(z), y= susie_pip)) +
  geom_point() +
  ggtitle("Z scores vs PIP") +
  theme_minimal()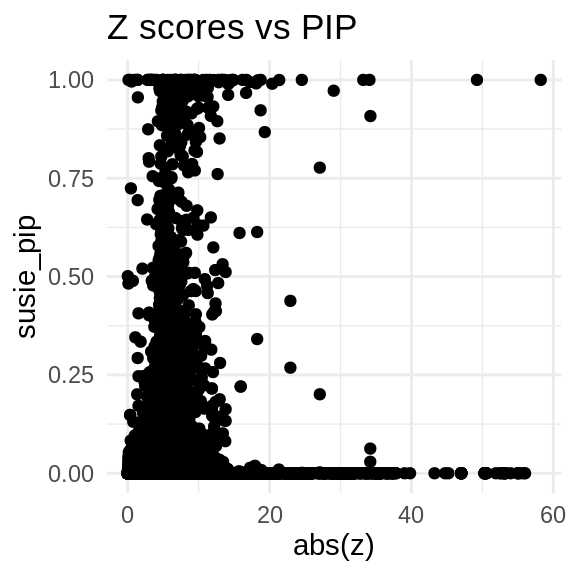
load(paste0("/project/xinhe/xsun/multi_group_ctwas/11.multi_group_1008/ld_mismatch/LD_mismatch_", trait,".rdata"))

sprintf("The number of problematic regions = %s", length(problematic_region_ids))
[1] "The number of problematic regions = 16"sprintf("The number of problematic genes = %s", length(problematic_genes))[1] "The number of problematic genes = 37"sprintf("The number of problematic snps = %s", length(res$problematic_snps))[1] "The number of problematic snps = 1204"sprintf("The number of flipped snps = %s", length(res$flipped_snps))[1] "The number of flipped snps = 15"problematic_snps <- res$condz_stats[res$condz_stats$id %in% res$problematic_snps,]
DT::datatable(problematic_snps,caption = htmltools::tags$caption(style = 'caption-side: topleft; text-align = left; color:black;','Stats for problematic snps'),options = list(pageLength = 5) )finemap_origin_res_problematic_region <- finemap_res_multi[finemap_res_multi$id %in% problematic_genes,]
merge_origin_nold <- merge(finemap_origin_res_problematic_region,finemap_noLD_res_problematic_region, by = "id")
merge_origin_nold <- merge_origin_nold[,c("id","susie_pip.x","susie_pip.y")]
colnames(merge_origin_nold) <- c("id","susie_pip_origin","susie_pip_ld-mismatch-fixed")
DT::datatable(merge_origin_nold,caption = htmltools::tags$caption(style = 'caption-side: topleft; text-align = left; color:black;','Original PIP and fixed PIP for problematic genes'),options = list(pageLength = 5) )Fine-mapping (LD mis-match fixed)
susie_alpha_res_multi <- ctwas_res_multi$susie_alpha_res
rerun_finemap_res <- res$finemap_res
rerun_susie_alpha_res <- res$susie_alpha_res
res <- update_finemap_res(finemap_res_multi,
                          susie_alpha_res_multi,
                          rerun_finemap_res,
                          rerun_susie_alpha_res,
                          updated_region_ids = problematic_region_ids)

finemap_res_multi <- res$finemap_res
susie_alpha_res_multi <- res$susie_alpha_res

susie_alpha_res_multi <- anno_susie_alpha_res(susie_alpha_res_multi,
                                        mapping_table = mapping_two,
                                        map_by = "molecular_id",
                                        drop_unmapped = TRUE)
2024-11-26 14:52:25 INFO::Annotating susie alpha result ...
2024-11-26 14:52:25 INFO::Map molecular traits to genes
2024-11-26 14:52:26 INFO::Split PIPs for molecular traits mapped to multiple genescombined_pip_by_type_cs_multi <- combine_gene_pips(susie_alpha_res_multi,
group_by = "gene_name",
by = "type",
method = "combine_cs",
filter_cs = TRUE,
include_cs_id = T)
combined_pip_by_context_cs_multi <- combine_gene_pips(susie_alpha_res_multi,
group_by = "gene_name",
by = "context",
method = "combine_cs",
filter_cs = TRUE,
include_cs_id = T)
DT::datatable(combined_pip_by_type_cs_multi[combined_pip_by_type_cs_multi$combined_pip>0.8,],caption = htmltools::tags$caption( style = 'caption-side: topleft; text-align = left; color:black;','Combined PIP by omics'),options = list(pageLength = 5) )DT::datatable(combined_pip_by_context_cs_multi[combined_pip_by_context_cs_multi$combined_pip>0.8,],caption = htmltools::tags$caption( style = 'caption-side: topleft; text-align = left; color:black;','Combined PIP by tissue'),options = list(pageLength = 5) )combined_pip_by_group_multi <- combine_gene_pips(susie_alpha_res_multi,
group_by = "gene_name",
by = "group",
method = "combine_cs",
filter_cs = TRUE,
include_cs_id = F)
combined_pip_by_group_sig_multi <- combined_pip_by_group_multi[combined_pip_by_group_multi$combined_pip > 0.8,]
plot_heatmap(heatmap_data = combined_pip_by_group_sig_multi, main = "PIP partitions for genes with PIP>0.8")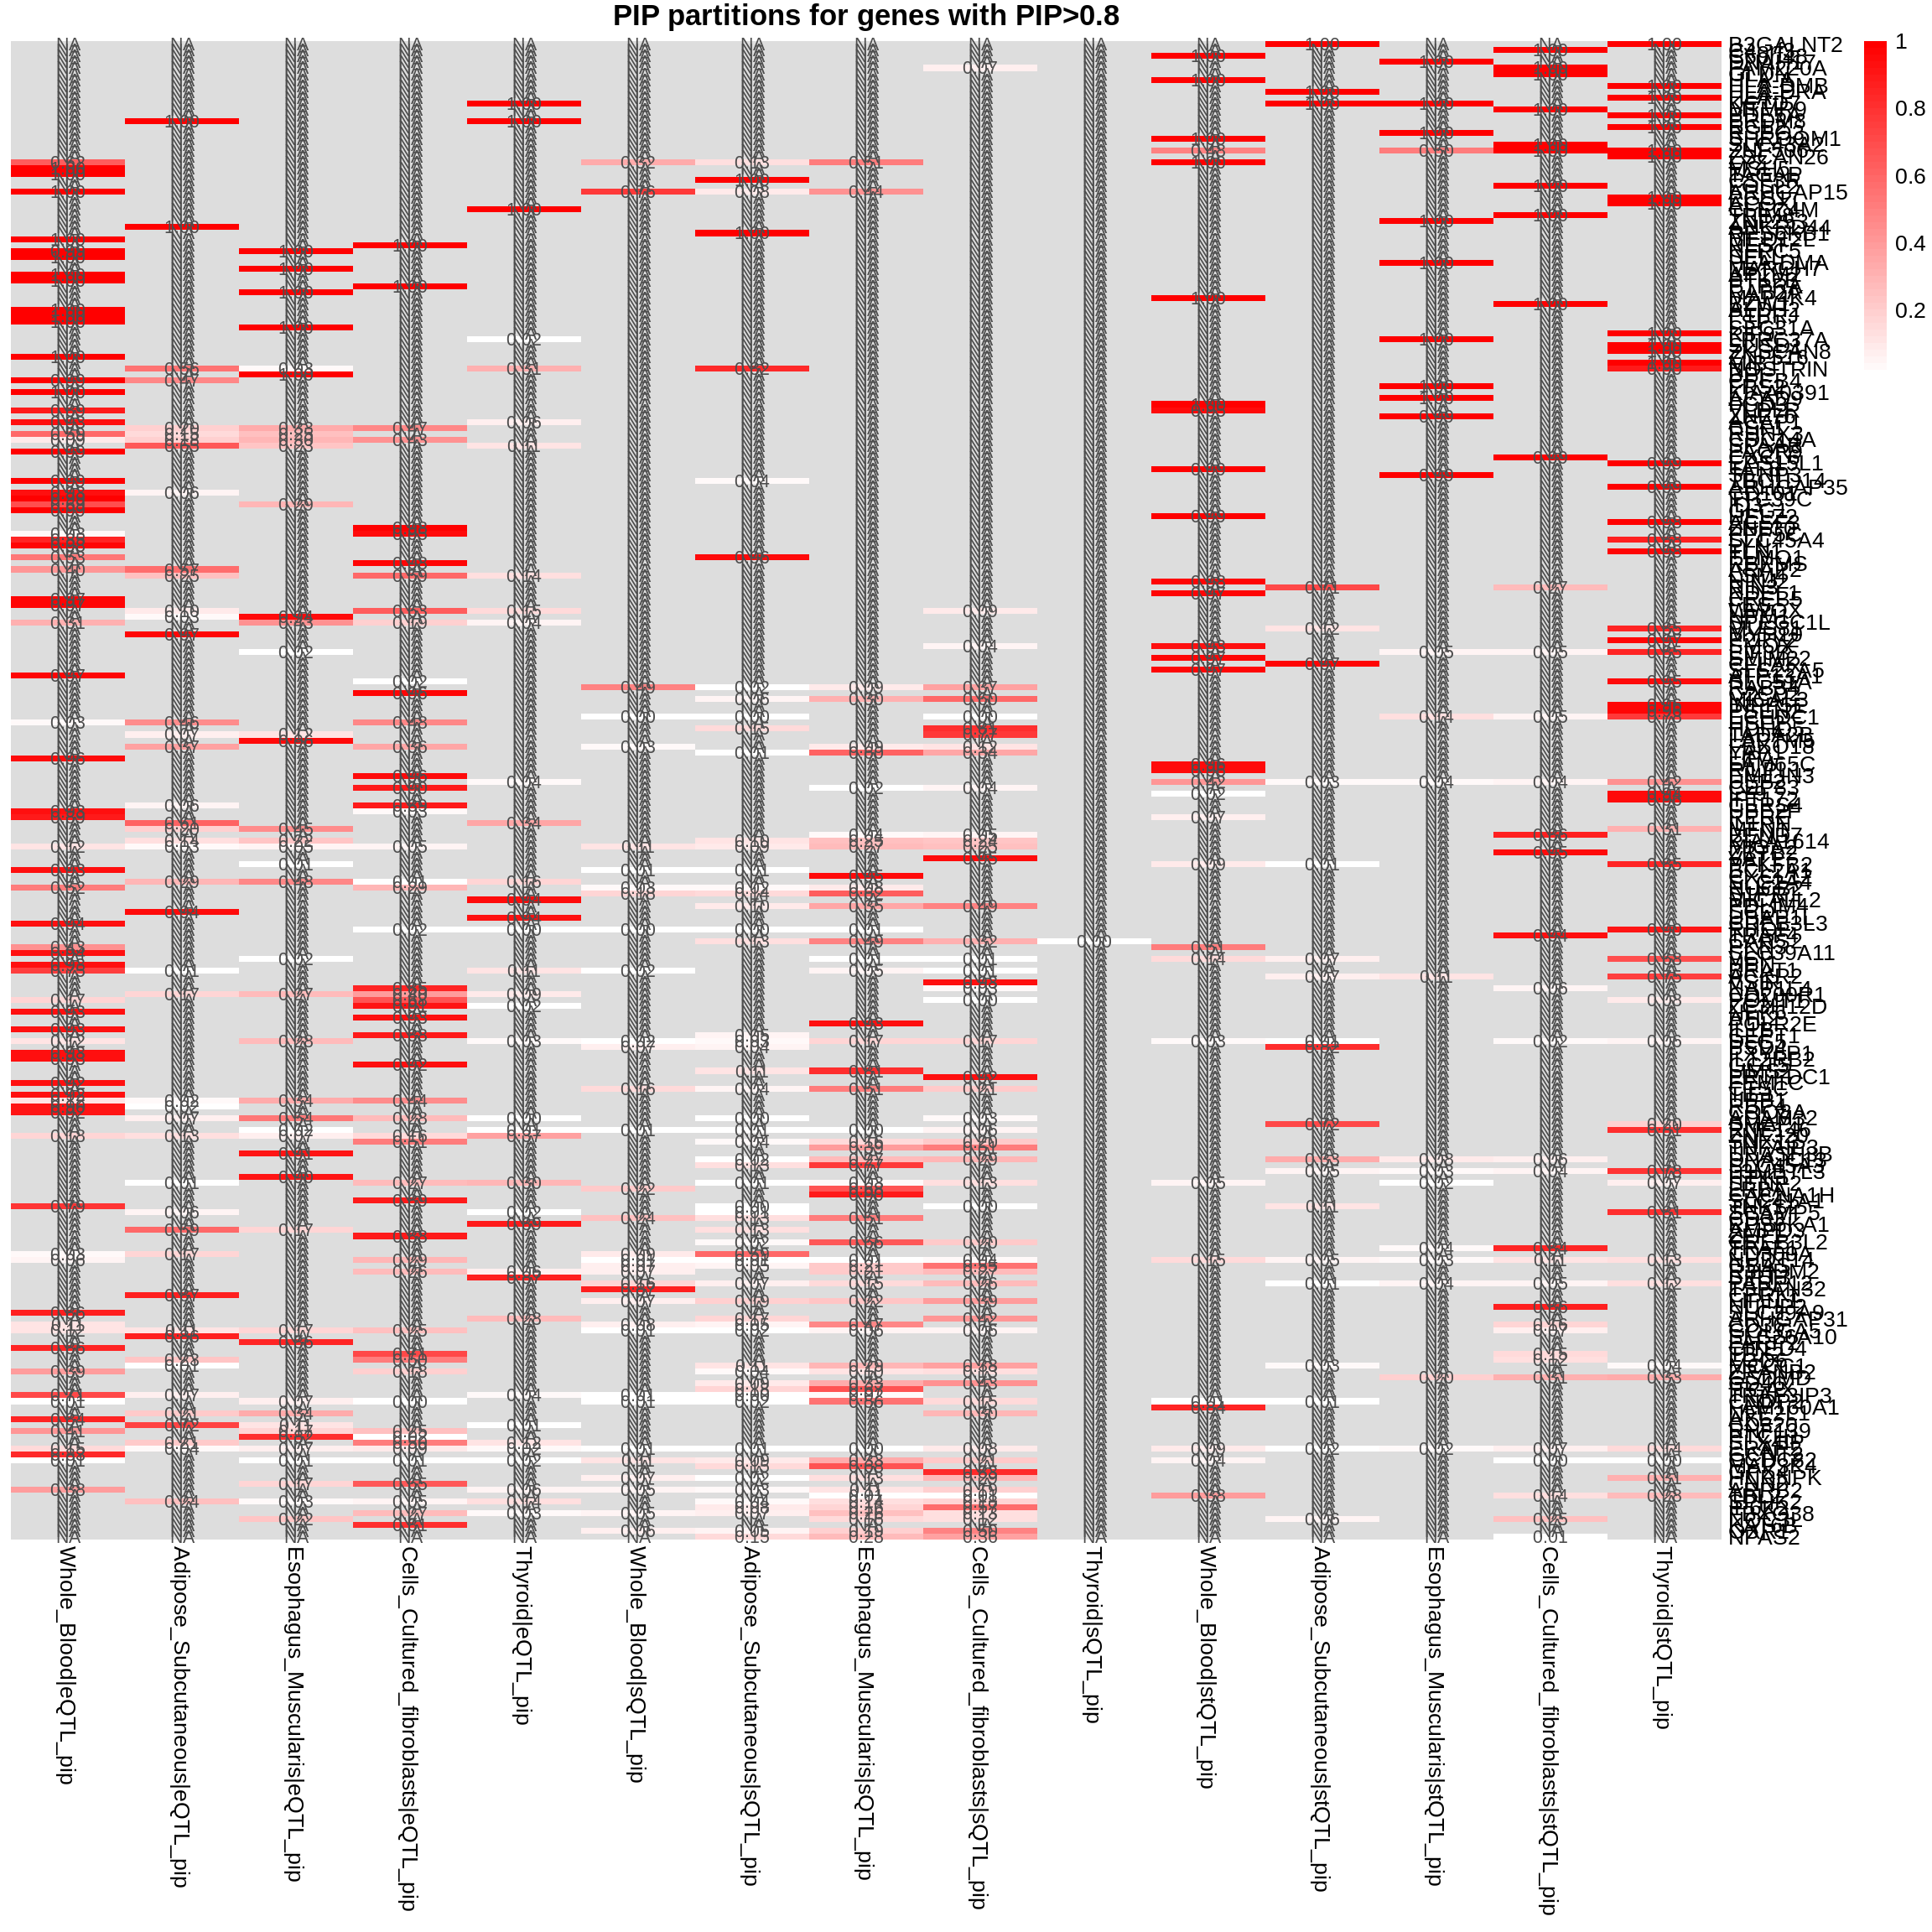
Comparing with single tissue + eQTL analysis
ctwas_res_single <- readRDS(paste0("/project/xinhe/xsun/multi_group_ctwas/10.single_tissue_1007/results/",trait,"/",tissue[1],"/",trait,"_",tissue[1], ".ctwas.res.RDS"))

susie_alpha_res_single <- ctwas_res_single$susie_alpha_res

susie_alpha_res_single <- anno_susie_alpha_res(susie_alpha_res_single,
                                        mapping_table = mapping_predictdb,
                                        map_by = "molecular_id",
                                        drop_unmapped = TRUE)
2024-11-26 14:52:59 INFO::Annotating susie alpha result ...
2024-11-26 14:52:59 INFO::Map molecular traits to genescombined_pip_by_type_single <- combine_gene_pips(susie_alpha_res_single,
group_by = "gene_name",
by = "type",
method = "combine_cs",
filter_cs = TRUE,
include_cs_id = F)
combined_pip_by_type_sig_single <- combined_pip_by_type_single[combined_pip_by_type_single$combined_pip > 0.8,]
combined_pip_by_type_sig_multi <- combined_pip_by_type_cs_multi[combined_pip_by_type_cs_multi$combined_pip > 0.8,]
sprintf("Number of genes with PIP > 0.8 -- Multi-group = %s", nrow(combined_pip_by_type_sig_multi))[1] "Number of genes with PIP > 0.8 -- Multi-group = 254"sprintf("Number of genes with PIP > 0.8 -- single eQTL = %s", nrow(combined_pip_by_type_sig_single))[1] "Number of genes with PIP > 0.8 -- single eQTL = 81"sprintf("Number of overlapped genes = %s", sum(combined_pip_by_type_sig_single$gene_name %in% combined_pip_by_type_sig_multi$gene_name))[1] "Number of overlapped genes = 56"genes_not_reported <- combined_pip_by_type_sig_single$gene_name[!combined_pip_by_type_sig_single$gene_name %in%combined_pip_by_type_sig_multi$gene_name]
DT::datatable(combined_pip_by_type_sig_single[combined_pip_by_type_sig_single$gene_name %in% genes_not_reported,],caption = htmltools::tags$caption( style = 'caption-side: topleft; text-align = left; color:black;','Genes not reported by multi-group analysis'),options = list(pageLength = 5) )DT::datatable(combined_pip_by_type_cs_multi[combined_pip_by_type_cs_multi$gene_name %in% genes_not_reported,],caption = htmltools::tags$caption( style = 'caption-side: topleft; text-align = left; color:black;','Genes not reported by multi-group analysis'),options = list(pageLength = 5) )gene_multi_unique_type <- combined_pip_by_group_sig_multi[!combined_pip_by_group_sig_multi$gene_name %in% combined_pip_by_type_sig_single$gene_name,]
plot_heatmap(heatmap_data = gene_multi_unique_type, main = "PIP partition for unique genes found by multi-group analysis")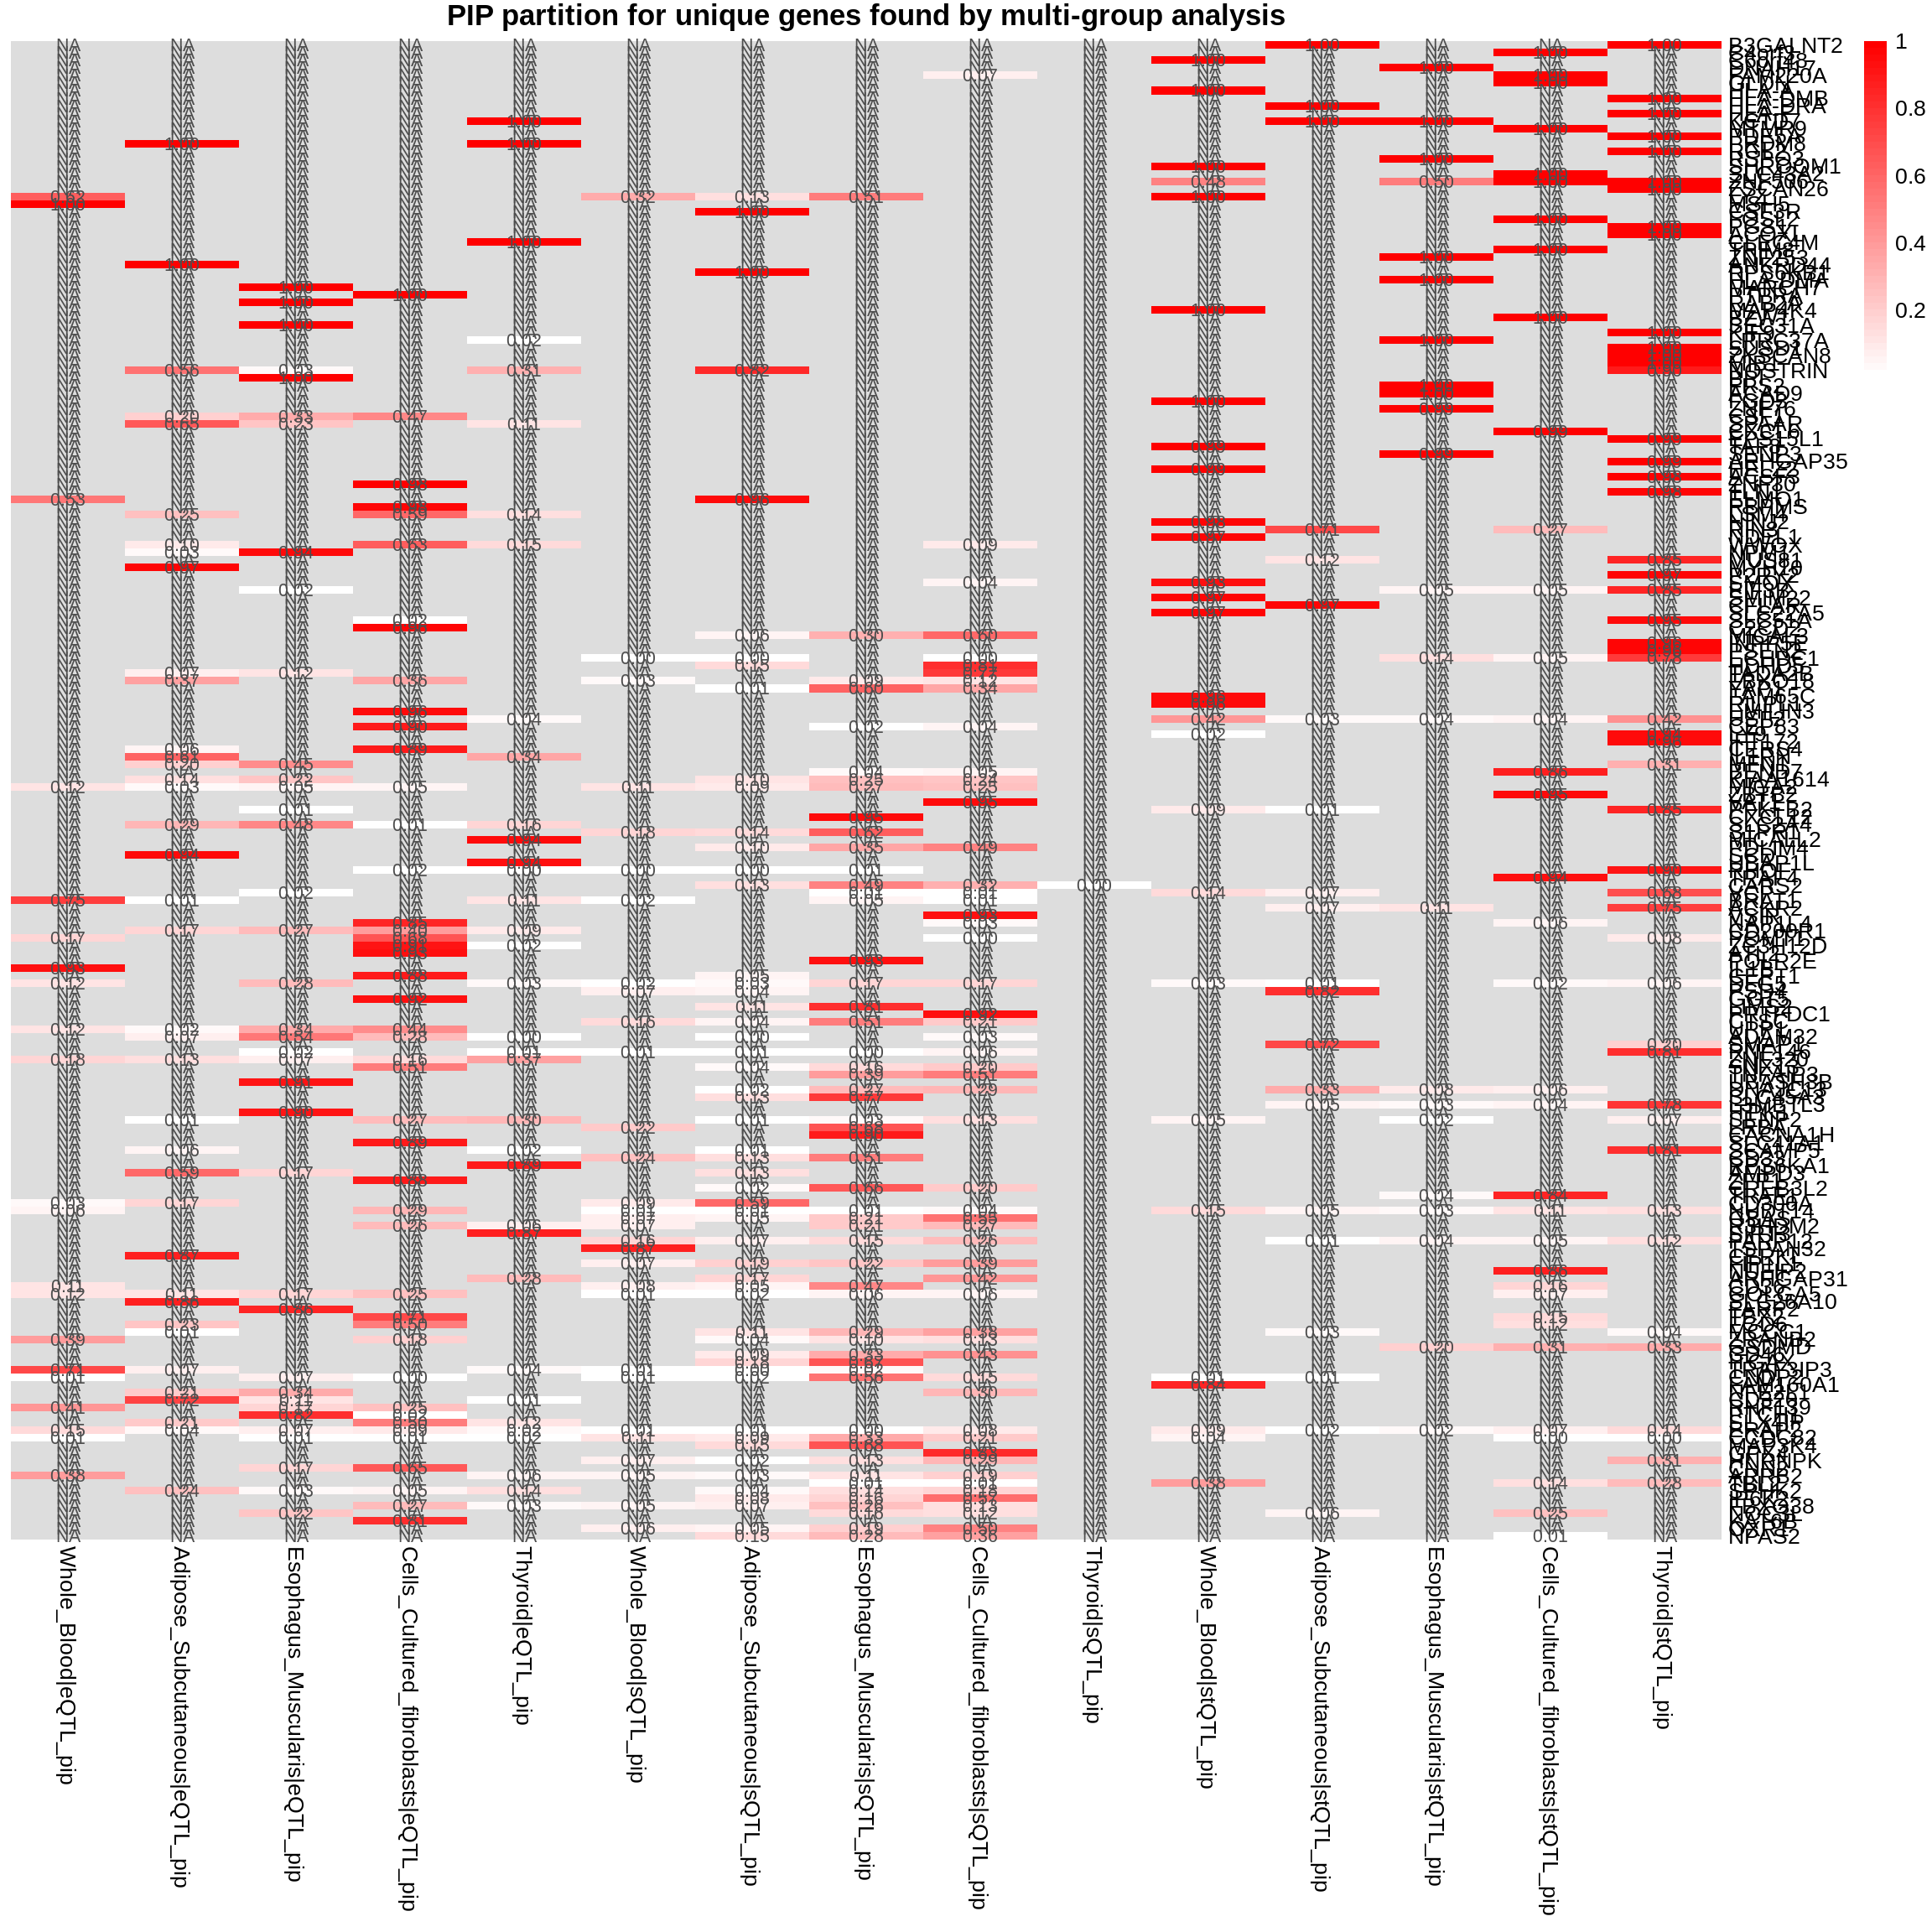
Exploring allelic heterogeneity
pip_per_cs <- compute_pip_per_cs(combined_pip_by_group_sig_multi, susie_alpha_res_multi)

DT::datatable(pip_per_cs,caption = htmltools::tags$caption( style = 'caption-side: topleft; text-align = left; color:black;','PIP per CS'),options = list(pageLength = 5) )
sessionInfo()R version 4.2.0 (2022-04-22)
Platform: x86_64-pc-linux-gnu (64-bit)
Running under: CentOS Linux 8
Matrix products: default
BLAS/LAPACK: /software/openblas-0.3.13-el8-x86_64/lib/libopenblas_skylakexp-r0.3.13.so
locale:
[1] LC_CTYPE=en_US.UTF-8 LC_NUMERIC=C
[3] LC_TIME=en_US.UTF-8 LC_COLLATE=en_US.UTF-8
[5] LC_MONETARY=en_US.UTF-8 LC_MESSAGES=en_US.UTF-8
[7] LC_PAPER=en_US.UTF-8 LC_NAME=C
[9] LC_ADDRESS=C LC_TELEPHONE=C
[11] LC_MEASUREMENT=en_US.UTF-8 LC_IDENTIFICATION=C
attached base packages:
[1] stats4 stats graphics grDevices utils datasets methods
[8] base
other attached packages:
[1] EnsDb.Hsapiens.v86_2.99.0 ensembldb_2.22.0
[3] AnnotationFilter_1.22.0 GenomicFeatures_1.50.4
[5] AnnotationDbi_1.60.2 Biobase_2.58.0
[7] GenomicRanges_1.50.2 GenomeInfoDb_1.34.9
[9] IRanges_2.32.0 S4Vectors_0.36.2
[11] BiocGenerics_0.44.0 pheatmap_1.0.12
[13] lubridate_1.9.2 forcats_1.0.0
[15] stringr_1.5.0 dplyr_1.1.2
[17] purrr_1.0.1 readr_2.1.4
[19] tidyr_1.3.0 tibble_3.2.1
[21] tidyverse_2.0.0 ggplot2_3.4.2
[23] ctwas_0.4.19
loaded via a namespace (and not attached):
[1] colorspace_2.0-3 rjson_0.2.21
[3] ellipsis_0.3.2 rprojroot_2.0.3
[5] XVector_0.38.0 locuszoomr_0.1.5
[7] fs_1.5.2 rstudioapi_0.14
[9] farver_2.1.0 DT_0.22
[11] ggrepel_0.9.3 bit64_4.0.5
[13] fansi_1.0.3 xml2_1.3.3
[15] codetools_0.2-18 logging_0.10-108
[17] cachem_1.0.6 knitr_1.42
[19] jsonlite_1.8.7 workflowr_1.7.1
[21] Rsamtools_2.14.0 dbplyr_2.3.2
[23] png_0.1-7 compiler_4.2.0
[25] httr_1.4.7 Matrix_1.6-1.1
[27] fastmap_1.1.0 lazyeval_0.2.2
[29] cli_3.6.2 later_1.3.0
[31] htmltools_0.5.7 prettyunits_1.1.1
[33] tools_4.2.0 gtable_0.3.0
[35] glue_1.6.2 GenomeInfoDbData_1.2.9
[37] rappdirs_0.3.3 Rcpp_1.0.11
[39] jquerylib_0.1.4 vctrs_0.6.1
[41] Biostrings_2.66.0 rtracklayer_1.58.0
[43] crosstalk_1.2.0 xfun_0.38
[45] timechange_0.2.0 lifecycle_1.0.4
[47] irlba_2.3.5 restfulr_0.0.15
[49] XML_3.99-0.9 zlibbioc_1.44.0
[51] scales_1.2.0 gggrid_0.2-0
[53] hms_1.1.3 promises_1.2.0.1
[55] MatrixGenerics_1.10.0 ProtGenerics_1.30.0
[57] parallel_4.2.0 SummarizedExperiment_1.28.0
[59] RColorBrewer_1.1-3 LDlinkR_1.3.0
[61] yaml_2.3.5 curl_4.3.2
[63] gridExtra_2.3 memoise_2.0.1
[65] sass_0.4.1 biomaRt_2.54.1
[67] stringi_1.7.6 RSQLite_2.3.1
[69] highr_0.9 BiocIO_1.8.0
[71] filelock_1.0.2 BiocParallel_1.32.6
[73] rlang_1.1.2 pkgconfig_2.0.3
[75] matrixStats_1.2.0 bitops_1.0-7
[77] evaluate_0.15 lattice_0.20-45
[79] labeling_0.4.2 GenomicAlignments_1.34.1
[81] htmlwidgets_1.6.2 cowplot_1.1.1
[83] bit_4.0.4 tidyselect_1.2.0
[85] magrittr_2.0.3 R6_2.5.1
[87] generics_0.1.3 DelayedArray_0.24.0
[89] DBI_1.1.2 pgenlibr_0.3.6
[91] pillar_1.9.0 whisker_0.4
[93] withr_2.5.0 KEGGREST_1.38.0
[95] RCurl_1.98-1.12 mixsqp_0.3-48
[97] crayon_1.5.1 utf8_1.2.2
[99] BiocFileCache_2.6.1 plotly_4.10.0
[101] tzdb_0.3.0 rmarkdown_2.21
[103] progress_1.2.2 grid_4.2.0
[105] data.table_1.14.4 blob_1.2.3
[107] git2r_0.30.1 digest_0.6.29
[109] httpuv_1.6.5 munsell_0.5.0
[111] viridisLite_0.4.0 bslib_0.3.1