Comparing results from predictdb eQTL / Munro eQTL / predictdb eQTL + sQTL / predictdb eQTL + sQTL + Munro rsQTL + apaQTL / all 8 weights
XSun
2024-10-02
Last updated: 2024-10-07
Checks: 6 1
Knit directory: multigroup_ctwas_analysis/
This reproducible R Markdown analysis was created with workflowr (version 1.7.0). The Checks tab describes the reproducibility checks that were applied when the results were created. The Past versions tab lists the development history.
The R Markdown file has unstaged changes. To know which version of
the R Markdown file created these results, you’ll want to first commit
it to the Git repo. If you’re still working on the analysis, you can
ignore this warning. When you’re finished, you can run
wflow_publish to commit the R Markdown file and build the
HTML.
Great job! The global environment was empty. Objects defined in the global environment can affect the analysis in your R Markdown file in unknown ways. For reproduciblity it’s best to always run the code in an empty environment.
The command set.seed(20231112) was run prior to running
the code in the R Markdown file. Setting a seed ensures that any results
that rely on randomness, e.g. subsampling or permutations, are
reproducible.
Great job! Recording the operating system, R version, and package versions is critical for reproducibility.
Nice! There were no cached chunks for this analysis, so you can be confident that you successfully produced the results during this run.
Great job! Using relative paths to the files within your workflowr project makes it easier to run your code on other machines.
Great! You are using Git for version control. Tracking code development and connecting the code version to the results is critical for reproducibility.
The results in this page were generated with repository version 11796cd. See the Past versions tab to see a history of the changes made to the R Markdown and HTML files.
Note that you need to be careful to ensure that all relevant files for
the analysis have been committed to Git prior to generating the results
(you can use wflow_publish or
wflow_git_commit). workflowr only checks the R Markdown
file, but you know if there are other scripts or data files that it
depends on. Below is the status of the Git repository when the results
were generated:
Ignored files:
    Ignored:    analysis/figure/

Unstaged changes:
    Modified:   analysis/multi_group_compare_decidingweights_4traits.Rmd
Note that any generated files, e.g. HTML, png, CSS, etc., are not included in this status report because it is ok for generated content to have uncommitted changes.
These are the previous versions of the repository in which changes were
made to the R Markdown
(analysis/multi_group_compare_decidingweights_4traits.Rmd)
and HTML
(docs/multi_group_compare_decidingweights_4traits.html)
files. If you’ve configured a remote Git repository (see
?wflow_git_remote), click on the hyperlinks in the table
below to view the files as they were in that past version.
| File | Version | Author | Date | Message |
|---|---|---|---|---|
| Rmd | 11796cd | XSun | 2024-10-03 | update |
| html | 11796cd | XSun | 2024-10-03 | update |
| Rmd | b00c776 | XSun | 2024-10-03 | update |
| html | b00c776 | XSun | 2024-10-03 | update |
library(ctwas)
library(EnsDb.Hsapiens.v86)
library(VennDiagram)
library(ggplot2)
library(gridExtra)
library(pheatmap)
library(dplyr)

ens_db <- EnsDb.Hsapiens.v86

mapping_predictdb <- readRDS("/project2/xinhe/shared_data/multigroup_ctwas/weights/mapping_files/PredictDB_mapping.RDS")
mapping_munro <- readRDS("/project2/xinhe/shared_data/multigroup_ctwas/weights/mapping_files/Munro_mapping.RDS")
mapping_two <- rbind(mapping_predictdb,mapping_munro)

load("/project2/xinhe/shared_data/multigroup_ctwas/gwas/samplesize.rdata")


colors <- c("#1b9e77", "#d95f02", "#7570b3", "#e7298a", "#66a61e",
               "#e6ab02", "#a6761d", "#666666", "#a6cee3")

plot_venn <- function(npred,nmunro,noverlap) {

  venn.plot <- draw.pairwise.venn(
    area1 = npred,          # Size of Group A
    area2 = nmunro,          # Size of Group B
    cross.area = noverlap,     # Overlap between Group A and Group B
    category = c("Predictdb", "Munro"),  # Labels for the groups
    fill = c("red", "blue"),             # Colors for the groups
    lty = "blank",                       # Line type for the circles
    cex = 2,                             # Font size for the numbers
    cat.cex = 2                          # Font size for the labels
  )

  return(venn.plot)

}

plot_3venn <- function(es, esra, all8) {

  venn.plot <- draw.triple.venn(
      area1 = length(es),
      area2 = length(esra),
      area3 = length(all8),
      n12 = length(intersect(es, esra)),
      n23 = length(intersect(esra, all8)),
      n13 = length(intersect(es, all8)),
      n123 = length(Reduce(intersect, list(es, esra, all8))),
      category = c("e+s", "e+s+rs+apa", "8weights"),
      fill = c("red", "green", "blue"),
      lty = "dashed",
      cex = 2,
      cat.cex = 1.5,
      cat.col = c("red", "green", "blue"),
      scaled = T
      )

  return(venn.plot)

}

plot_scatter <- function(overlap) {

  overlap$pip_diff <- abs(overlap$susie_pip_predictdb - overlap$susie_pip_munro)

  overlap$pip_diff_category <- cut(overlap$pip_diff, breaks = c(-Inf, 0.3, 0.5, Inf),
                                 labels = c("0~0.3", "0.3~0.5", "0.5+"))

  p1 <- ggplot(data = overlap, aes(x = susie_pip_predictdb, y = susie_pip_munro,
                                 color = pip_diff_category)) +
        geom_point() +
        scale_color_manual(values = c("0~0.3" = scales::alpha("blue", 0.3),
                                      "0.3~0.5" = "orange",
                                      "0.5+" = "red")) +
        ggtitle("Comparing susie PIPs") +
        xlab("susie pip -- predictdb") +
        ylab("susie pip -- munro") +
        theme_minimal() +
        labs(color = "PIP diff") +
        guides(color = guide_legend(override.aes = list(size = 3)))

# Modify p2 to color points based on pip_diff categories with alpha for blue
  p2 <- ggplot(data = overlap, aes(x = z_predictdb, y = z_munro,
                                 color = pip_diff_category)) +
        geom_point() +
        scale_color_manual(values = c("0~0.3" = scales::alpha("blue", 0.3),
                                     "0.3~0.5" = "orange",
                                     "0.5+" = "red")) +
        ggtitle("Comparing zscores") +
        xlab("zscores -- predictdb") +
        ylab("zscores -- munro") +
        theme_minimal() +
        labs(color = "PIP diff") +
        guides(color = guide_legend(override.aes = list(size = 3)))

        combined_plot <- grid.arrange(p1, p2, ncol = 2)

        return(combined_plot)
}

plot_heatmap <- function(heatmap_data, main) {

  rownames(heatmap_data) <- heatmap_data$gene_name
  heatmap_data <- heatmap_data %>% dplyr::select(-gene_name, -combined_pip)

  heatmap_matrix <- as.matrix(heatmap_data)
  p <- pheatmap(heatmap_matrix,
         cluster_rows = F,   # Cluster the rows (genes)
         cluster_cols = F,   # Cluster the columns (QTL types)
         color = colorRampPalette(c("white", "red"))(50), # Color gradient
         display_numbers = TRUE, # Display numbers in cells
         main = main,labels_row = rownames(heatmap_data), silent = T)

  return(p)
}

plot_piechart <- function(ctwas_parameters, colors) {
  data <- data.frame(
    category = names(ctwas_parameters$attributable_pve),
    percentage = ctwas_parameters$attributable_pve
  )

  # Calculate percentage labels for the chart
  data$percentage_label <- paste0(round(data$percentage * 100, 1), "%")

  pie <- ggplot(data, aes(x = "", y = percentage, fill = category)) +
    geom_bar(stat = "identity", width = 1) +
    coord_polar("y", start = 0) +
    theme_void() +  # Remove background and axes
    geom_text(aes(label = percentage_label),
              position = position_stack(vjust = 0.5), size = 2) +
    scale_fill_manual(values = colors) +  # Custom colors
    labs(fill = "Category") +  # Legend title
    ggtitle("Percent of heritability")  # Title

  return(pie)
}

process_data_rsapa <- function(finemap_res) {

  finemap_res_gene <- finemap_res[finemap_res$type!="SNP",]
  finemap_res_gene_apa <- finemap_res_gene[finemap_res_gene$type == "apaQTL",]
  gene_apa <- unique(finemap_res_gene_apa$gene_name)

  finemap_res_gene_rs <- finemap_res_gene[finemap_res_gene$type == "rsQTL",]
  gene_rs <- unique(finemap_res_gene_rs$gene_name)

  gene_overlap_rsapa <- intersect(gene_apa,gene_rs)

  finemap_res_gene_apa_overlap <- finemap_res_gene_apa %>%
    dplyr::filter(gene_name %in% gene_overlap_rsapa) %>%
    group_by(gene_name) %>%
    dplyr::filter(abs(z) == max(abs(z))) %>%
    ungroup() %>%
    dplyr::select(gene_name, z)

  finemap_res_gene_rs_overlap <- finemap_res_gene_rs %>%
    dplyr::filter(gene_name %in% gene_overlap_rsapa) %>%
    group_by(gene_name) %>%
    dplyr::filter(abs(z) == max(abs(z))) %>%
    ungroup() %>%
    dplyr::select(gene_name, z)

  rs_apa_overlap_merged <- merge(finemap_res_gene_apa_overlap,finemap_res_gene_rs_overlap, by="gene_name")
  colnames(rs_apa_overlap_merged) <- c("gene_name","z_apa","z_rs")

  return(rs_apa_overlap_merged)

}

plot_scatter_rsapa <- function(rs_apa_overlap_merged) {

  ggplot(data = rs_apa_overlap_merged, aes(x=abs(z_apa), y=abs(z_rs))) +
    geom_point() +
    ggtitle("Scatter plot for largest abs(z) for the overlapping genes") +
    xlab("largest abs(z) for apa genes") +
    ylab("largest abs(z) for rs genes") +
    theme_minimal()

}

plot_venn_apars <- function(gene_apa, gene_rs, gene_overlap) {

  venn.plot <- draw.pairwise.venn(
    area1 = length(gene_apa),          # Size of Group A
    area2 = length(gene_rs),          # Size of Group B
    cross.area = length(gene_overlap_rsapa),     # Overlap between Group A and Group B
    category = c("#of apa genes", "#of rs genes"),  # Labels for the groups
    fill = c("red", "blue"),             # Colors for the groups
    lty = "blank",                       # Line type for the circles
    cex = 2,                             # Font size for the numbers
    cat.cex = 2,scaled = T,                       # Font size for the labels
    cat.pos = c(0.5, 0.5),                 # Adjust the label position, set to 0 for central alignment
    cat.dist = c(0, 0),
  )

  grid.text("number of genes of rsQTL and apaQTL", x = 0.5, y = 0.95, gp = gpar(fontsize = 20, fontface = "bold"))


}


rename_heatmap_columns <- function(heatmap_data, column_order) {
  # Select columns that are in the column_order and exist in heatmap_data
  selected_columns <- intersect(column_order, colnames(heatmap_data))
  heatmap_data <- heatmap_data[, selected_columns]

  # Initialize new_column_names as a copy of selected_columns
  new_column_names <- selected_columns

  # Rename the columns based on specific conditions
  for (col in colnames(heatmap_data)[3:ncol(heatmap_data)]) {
    if (grepl("rsQTL|apaQTL|isoQTL|eQTL|tssQTL|sQTL", col) && !grepl("eQTL_pred|sQTL_pred", col)) {
      new_column_names[new_column_names == col] <- paste0(col, "_munro")
    }
  }

  # Assign the new column names to heatmap_data
  colnames(heatmap_data) <- new_column_names

  return(heatmap_data)
}
Settings
6 modalities from Munro
- Weight processing:
PredictDB:
all the PredictDB are converted from FUSION weights
- drop_strand_ambig = TRUE,
- scale_by_ld_variance = F (FUSION converted weights)
- load_predictdb_LD = F,
- Parameter estimation and fine-mapping
- niter_prefit = 5,
- niter = 30(default),
- L: determined by uniform susie,
- group_prior_var_structure = “shared_type”,
- maxSNP = 20000,
- min_nonSNP_PIP = 0.5,
weights from predictdb
- Weight processing:
PredictDB (eqtl, sqtl)
- drop_strand_ambig = TRUE,
- scale_by_ld_variance = T
- load_predictdb_LD = F,
- Parameter estimation and fine-mapping
- group_prior_var_structure = “shared_type”,
- filter_L = TRUE,
- filter_nonSNP_PIP = FALSE,
- min_nonSNP_PIP = 0.5,
- min_abs_corr = 0.1,
mem: 100g 10cores
LDL-ukb-d-30780_irnt
Comparing predictdb eQTL VS munro eQTL
trait <- "LDL-ukb-d-30780_irnt"
tissue <- "Liver"
### predictdb
results_dir_epred <- paste0("/project/xinhe/xsun/multi_group_ctwas/9.deciding_weights_4traits/results/",trait,"/epred/")

ctwas_res_epred <- readRDS(paste0(results_dir_epred,trait,".ctwas.res.RDS"))
snp_map_epred  <- readRDS(paste0(results_dir_epred,trait,".snp_map.RDS"))
finemap_res_epred <- ctwas_res_epred$finemap_res
finemap_res_epred$molecular_id <- get_molecular_ids(finemap_res_epred)

finemap_res_epred <- anno_finemap_res(finemap_res_epred,
                              snp_map = snp_map_epred,
                              mapping_table = mapping_predictdb,
                              add_gene_annot = TRUE,
                              map_by = "molecular_id",
                              drop_unmapped = TRUE,
                              add_position = TRUE,
                              use_gene_pos = "mid")
2024-10-07 15:17:54 INFO::Annotating fine-mapping result ...
2024-10-07 15:18:00 INFO::Map molecular traits to genes
2024-10-07 15:18:21 INFO::Add gene positions
2024-10-07 15:18:21 INFO::Add SNP positionsfinemap_res_gene_epred <- finemap_res_epred[finemap_res_epred$type !="SNP",]
### munro
results_dir_emunro <- paste0("/project/xinhe/xsun/multi_group_ctwas/9.deciding_weights_4traits/results/",trait,"/emunro/")
ctwas_res_emunro <- readRDS(paste0(results_dir_emunro,trait,".ctwas.res.RDS"))
snp_map_emunro <- readRDS(paste0(results_dir_emunro,trait,".snp_map.RDS"))
finemap_res_emunro <- ctwas_res_emunro$finemap_res
finemap_res_emunro$molecular_id <- get_molecular_ids(finemap_res_emunro)
finemap_res_emunro <- anno_finemap_res(finemap_res_emunro,
snp_map = snp_map_emunro,
mapping_table = mapping_munro,
add_gene_annot = TRUE,
map_by = "molecular_id",
drop_unmapped = TRUE,
add_position = TRUE,
use_gene_pos = "mid")2024-10-07 15:19:38 INFO::Annotating fine-mapping result ...
2024-10-07 15:19:38 INFO::Map molecular traits to genes
2024-10-07 15:19:51 INFO::Add gene positions
2024-10-07 15:19:51 INFO::Add SNP positionsfinemap_res_gene_emunro <- finemap_res_emunro[finemap_res_emunro$type !="SNP",]
overlap <- merge(finemap_res_gene_epred, finemap_res_gene_emunro, by = "gene_name")
overlap <- overlap[,c("gene_name","type.x","context.x","region_id.x","z.x","susie_pip.x","z.y","susie_pip.y")]
colnames(overlap) <- c("gene_name","type","context","region_id","z_predictdb","susie_pip_predictdb","z_munro","susie_pip_munro")
DT::datatable(overlap,caption = htmltools::tags$caption( style = 'caption-side: topleft; text-align = left; color:black;','overlapping genes'),options = list(pageLength = 10) )venn <- plot_venn(npred = nrow(finemap_res_gene_epred), nmunro = nrow(finemap_res_gene_emunro), noverlap = nrow(overlap))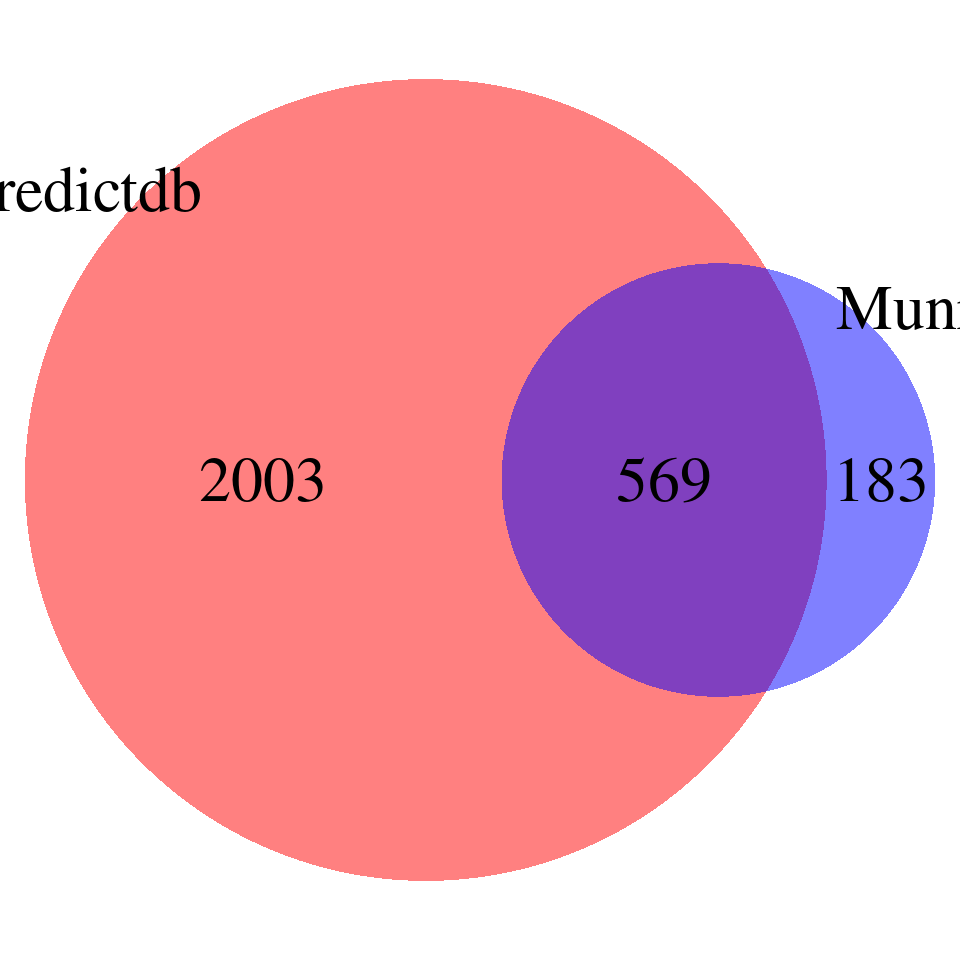
| Version | Author | Date |
|---|---|---|
| b00c776 | XSun | 2024-10-03 |
print("For the overlapping genes")[1] "For the overlapping genes"scatter_plot <- plot_scatter(overlap = overlap)
Comparing predictdb e+s VS predictdb e+s + Munro rs+apa VS all 8 weights
gwas_n <- samplesize[trait]

results_dir_espred <- paste0("/project/xinhe/xsun/multi_group_ctwas/9.deciding_weights_4traits/results/",trait,"/espred/")

snp_map_espred <- readRDS(paste0(results_dir_espred,trait,".snp_map.RDS"))
ctwas_res_espred <- readRDS(paste0(results_dir_espred,trait,".ctwas.res.RDS"))

param_espred <- ctwas_res_espred$param
finemap_res_espred <- ctwas_res_espred$finemap_res


p_conv_espred <- make_convergence_plots(param_espred, gwas_n, ncol = 1, colors = colors)
ctwas_parameters_espred <- summarize_param(param_espred, gwas_n)
pve_pie_espred <- plot_piechart(ctwas_parameters = ctwas_parameters_espred, colors = colors)


finemap_res_espred$molecular_id <- get_molecular_ids(finemap_res_espred)
finemap_res_espred <- anno_finemap_res(finemap_res_espred,
                              snp_map = snp_map_espred,
                              mapping_table = mapping_two,
                              add_gene_annot = TRUE,
                              map_by = "molecular_id",
                              drop_unmapped = TRUE,
                              add_position = TRUE,
                              use_gene_pos = "mid")
2024-10-07 15:21:03 INFO::Annotating fine-mapping result ...
2024-10-07 15:21:04 INFO::Map molecular traits to genes
2024-10-07 15:21:05 INFO::Split PIPs for molecular traits mapped to multiple genes
2024-10-07 15:21:12 INFO::Add gene positions
2024-10-07 15:21:12 INFO::Add SNP positionscombined_pip_by_type_espred <- combine_gene_pips(finemap_res =finemap_res_espred,
group_by = "gene_name",
by = "type",
method = "combine_cs",
filter_cs = T )2024-10-07 15:21:27 INFO::Limit gene results to credible setsresults_dir_4W <- paste0("/project/xinhe/xsun/multi_group_ctwas/9.deciding_weights_4traits/results/",trait,"/4W/")
snp_map_4W <- readRDS(paste0(results_dir_4W,trait,".snp_map.RDS"))
ctwas_res_4W <- readRDS(paste0(results_dir_4W,trait,".ctwas.res.RDS"))
param_4W <- ctwas_res_4W$param
finemap_res_4W <- ctwas_res_4W$finemap_res
p_conv_4W <- make_convergence_plots(param_4W, gwas_n, ncol = 1, colors = colors)
ctwas_parameters_4W <- summarize_param(param_4W, gwas_n)
pve_pie_4W <- plot_piechart(ctwas_parameters = ctwas_parameters_4W, colors = colors)
finemap_res_4W$molecular_id <- get_molecular_ids(finemap_res_4W)
finemap_res_4W <- anno_finemap_res(finemap_res_4W,
snp_map = snp_map_4W,
mapping_table = mapping_two,
add_gene_annot = TRUE,
map_by = "molecular_id",
drop_unmapped = TRUE,
add_position = TRUE,
use_gene_pos = "mid")2024-10-07 15:22:14 INFO::Annotating fine-mapping result ...
2024-10-07 15:22:14 INFO::Map molecular traits to genes
2024-10-07 15:22:15 INFO::Split PIPs for molecular traits mapped to multiple genes
2024-10-07 15:22:23 INFO::Add gene positions
2024-10-07 15:22:23 INFO::Add SNP positionscombined_pip_by_type_4W <- combine_gene_pips(finemap_res =finemap_res_4W,
group_by = "gene_name",
by = "type",
method = "combine_cs",
filter_cs = T )2024-10-07 15:22:38 INFO::Limit gene results to credible setsresults_dir_8W <- paste0("/project/xinhe/xsun/multi_group_ctwas/9.deciding_weights_4traits/results/",trait,"/8W/")
snp_map_8W <- readRDS(paste0(results_dir_8W,trait,".snp_map.RDS"))
ctwas_res_8W <- readRDS(paste0(results_dir_8W,trait,".ctwas.res.RDS"))
param_8W <- ctwas_res_8W$param
finemap_res_8W <- ctwas_res_8W$finemap_res
p_conv_8W <- make_convergence_plots(param_8W, gwas_n, ncol = 1, colors = colors)
ctwas_parameters_8W <- summarize_param(param_8W, gwas_n)
pve_pie_8W <- plot_piechart(ctwas_parameters = ctwas_parameters_8W, colors = colors)
finemap_res_8W$molecular_id <- get_molecular_ids(finemap_res_8W)
finemap_res_8W <- anno_finemap_res(finemap_res_8W,
snp_map = snp_map_8W,
mapping_table = mapping_two,
add_gene_annot = TRUE,
map_by = "molecular_id",
drop_unmapped = TRUE,
add_position = TRUE,
use_gene_pos = "mid")2024-10-07 15:23:25 INFO::Annotating fine-mapping result ...
2024-10-07 15:23:26 INFO::Map molecular traits to genes
2024-10-07 15:23:27 INFO::Split PIPs for molecular traits mapped to multiple genes
2024-10-07 15:23:35 INFO::Add gene positions
2024-10-07 15:23:35 INFO::Add SNP positionsfinemap_res_8W$type <- ifelse(grepl("_pred$", finemap_res_8W$context),
paste0(finemap_res_8W$type, "_pred"),
finemap_res_8W$type)
combined_pip_by_type_8W <- combine_gene_pips(finemap_res =finemap_res_8W,
group_by = "gene_name",
by = "type",
method = "combine_cs",
filter_cs = T )2024-10-07 15:23:52 INFO::Limit gene results to credible setsParameters
print("each row represents one setting: predictdb e+s, predictdb e+s + Munro apa+rs, all 8 weights accordingly")[1] "each row represents one setting: predictdb e+s, predictdb e+s + Munro apa+rs, all 8 weights accordingly"grid.arrange(p_conv_espred,p_conv_4W,p_conv_8W, ncol = 3)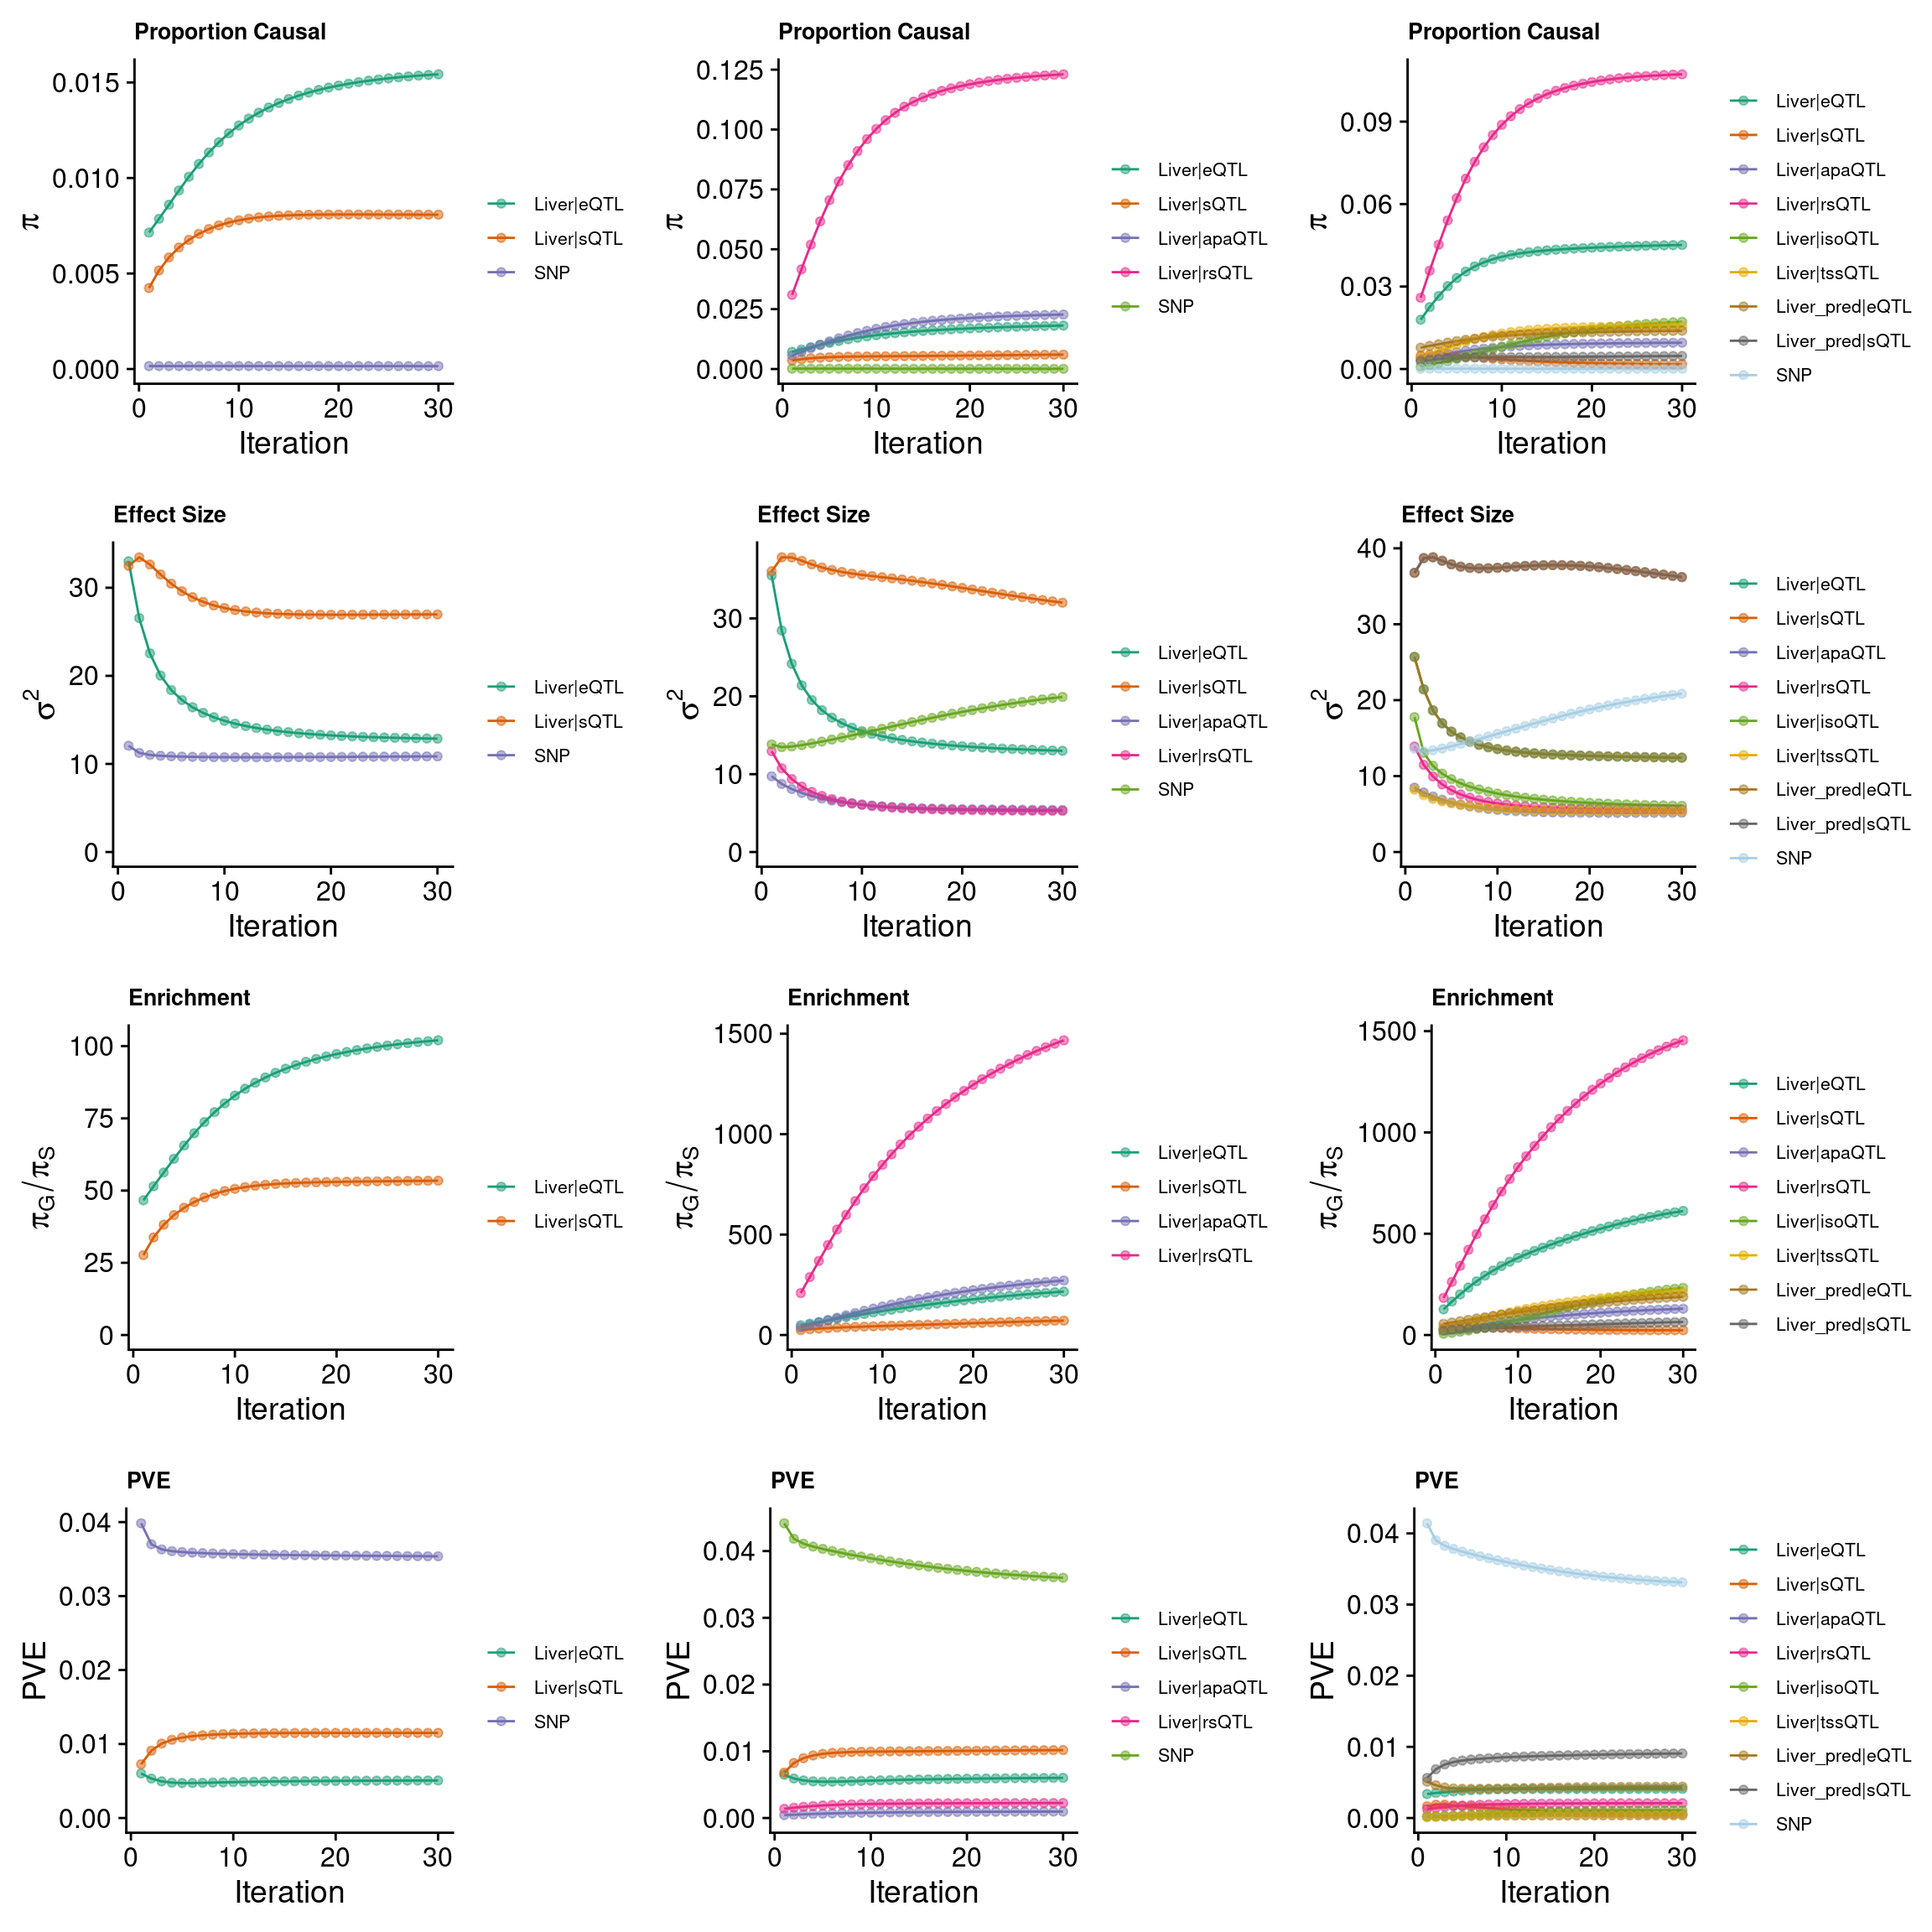
| Version | Author | Date |
|---|---|---|
| b00c776 | XSun | 2024-10-03 |
######pve
group_pve_espred <- ctwas_parameters_espred$group_pve
group_pve_espred <- group_pve_espred[-length(group_pve_espred)]
group_pve_espred <- c(group_pve_espred, rep(NA,6))
group_pve_espred <- c(group_pve_espred, ctwas_parameters_espred$total_pve)
names(group_pve_espred) <- c("eQTL_pred","sQTL_pred","apaQTL_munro","rsQTL_munro","isoQTL_munro","tssQTL_munro","eQTL_munro","sQTL_munro","TOTAL")

group_pve_4W <- ctwas_parameters_4W$group_pve
group_pve_4W <- group_pve_4W[-length(group_pve_4W)]
group_pve_4W <- c(group_pve_4W, rep(NA,4))
group_pve_4W <- c(group_pve_4W, ctwas_parameters_4W$total_pve)
names(group_pve_4W) <- c("eQTL_pred","sQTL_pred","apaQTL_munro","rsQTL_munro","isoQTL_munro","tssQTL_munro","eQTL_munro","sQTL_munro","TOTAL")

group_pve_8W <- ctwas_parameters_8W$group_pve
group_pve_8W <- group_pve_8W[-length(group_pve_8W)]
group_pve_8W <- group_pve_8W[c(paste0(tissue,"_pred|eQTL"),paste0(tissue,"_pred|sQTL"),paste0(tissue,"|apaQTL"),paste0(tissue,"|rsQTL"),paste0(tissue,"|isoQTL"),paste0(tissue,"|tssQTL"),paste0(tissue,"|eQTL"),paste0(tissue,"|sQTL"))]
group_pve_8W <- c(group_pve_8W, ctwas_parameters_8W$total_pve)
names(group_pve_8W) <- c("eQTL_pred","sQTL_pred","apaQTL_munro","rsQTL_munro","isoQTL_munro","tssQTL_munro","eQTL_munro","sQTL_munro","TOTAL")

grouppve <- cbind(group_pve_espred,group_pve_4W,group_pve_8W)
grouppve <- round(grouppve,digits = 4)

######size
group_size_espred <- ctwas_parameters_espred$group_size
group_size_espred <- group_size_espred[-length(group_size_espred)]
group_size_espred <- c(group_size_espred, rep(NA,6))
names(group_size_espred) <- c("eQTL_pred","sQTL_pred","apaQTL_munro","rsQTL_munro","isoQTL_munro","tssQTL_munro","eQTL_munro","sQTL_munro")

group_size_4W <- ctwas_parameters_4W$group_size
group_size_4W <- group_size_4W[-length(group_size_4W)]
group_size_4W <- c(group_size_4W, rep(NA,4))
names(group_size_4W) <- c("eQTL_pred","sQTL_pred","apaQTL_munro","rsQTL_munro","isoQTL_munro","tssQTL_munro","eQTL_munro","sQTL_munro")

group_size_8W <- ctwas_parameters_8W$group_size
group_size_8W <- group_size_8W[-length(group_size_8W)]
group_size_8W <- group_size_8W[c(paste0(tissue,"_pred|eQTL"),paste0(tissue,"_pred|sQTL"),paste0(tissue,"|apaQTL"),paste0(tissue,"|rsQTL"),paste0(tissue,"|isoQTL"),paste0(tissue,"|tssQTL"),paste0(tissue,"|eQTL"),paste0(tissue,"|sQTL"))]
names(group_size_8W) <- c("eQTL_pred","sQTL_pred","apaQTL_munro","rsQTL_munro","isoQTL_munro","tssQTL_munro","eQTL_munro","sQTL_munro")

groupsize <- cbind(group_size_espred,group_size_4W,group_size_8W)

group_info <- cbind(grouppve,rbind(groupsize,c(rep(NA,3))))

DT::datatable(group_info,caption = htmltools::tags$caption( style = 'caption-side: topleft; text-align = left; color:black;','Group PVE and Group Size'),options = list(pageLength = 10) )
print("each pie chart represents one setting: predictdb e+s, predictdb e+s + Munro apa+rs, all 8 weights accordingly")[1] "each pie chart represents one setting: predictdb e+s, predictdb e+s + Munro apa+rs, all 8 weights accordingly"grid.arrange(pve_pie_espred,pve_pie_4W,pve_pie_8W, ncol =3)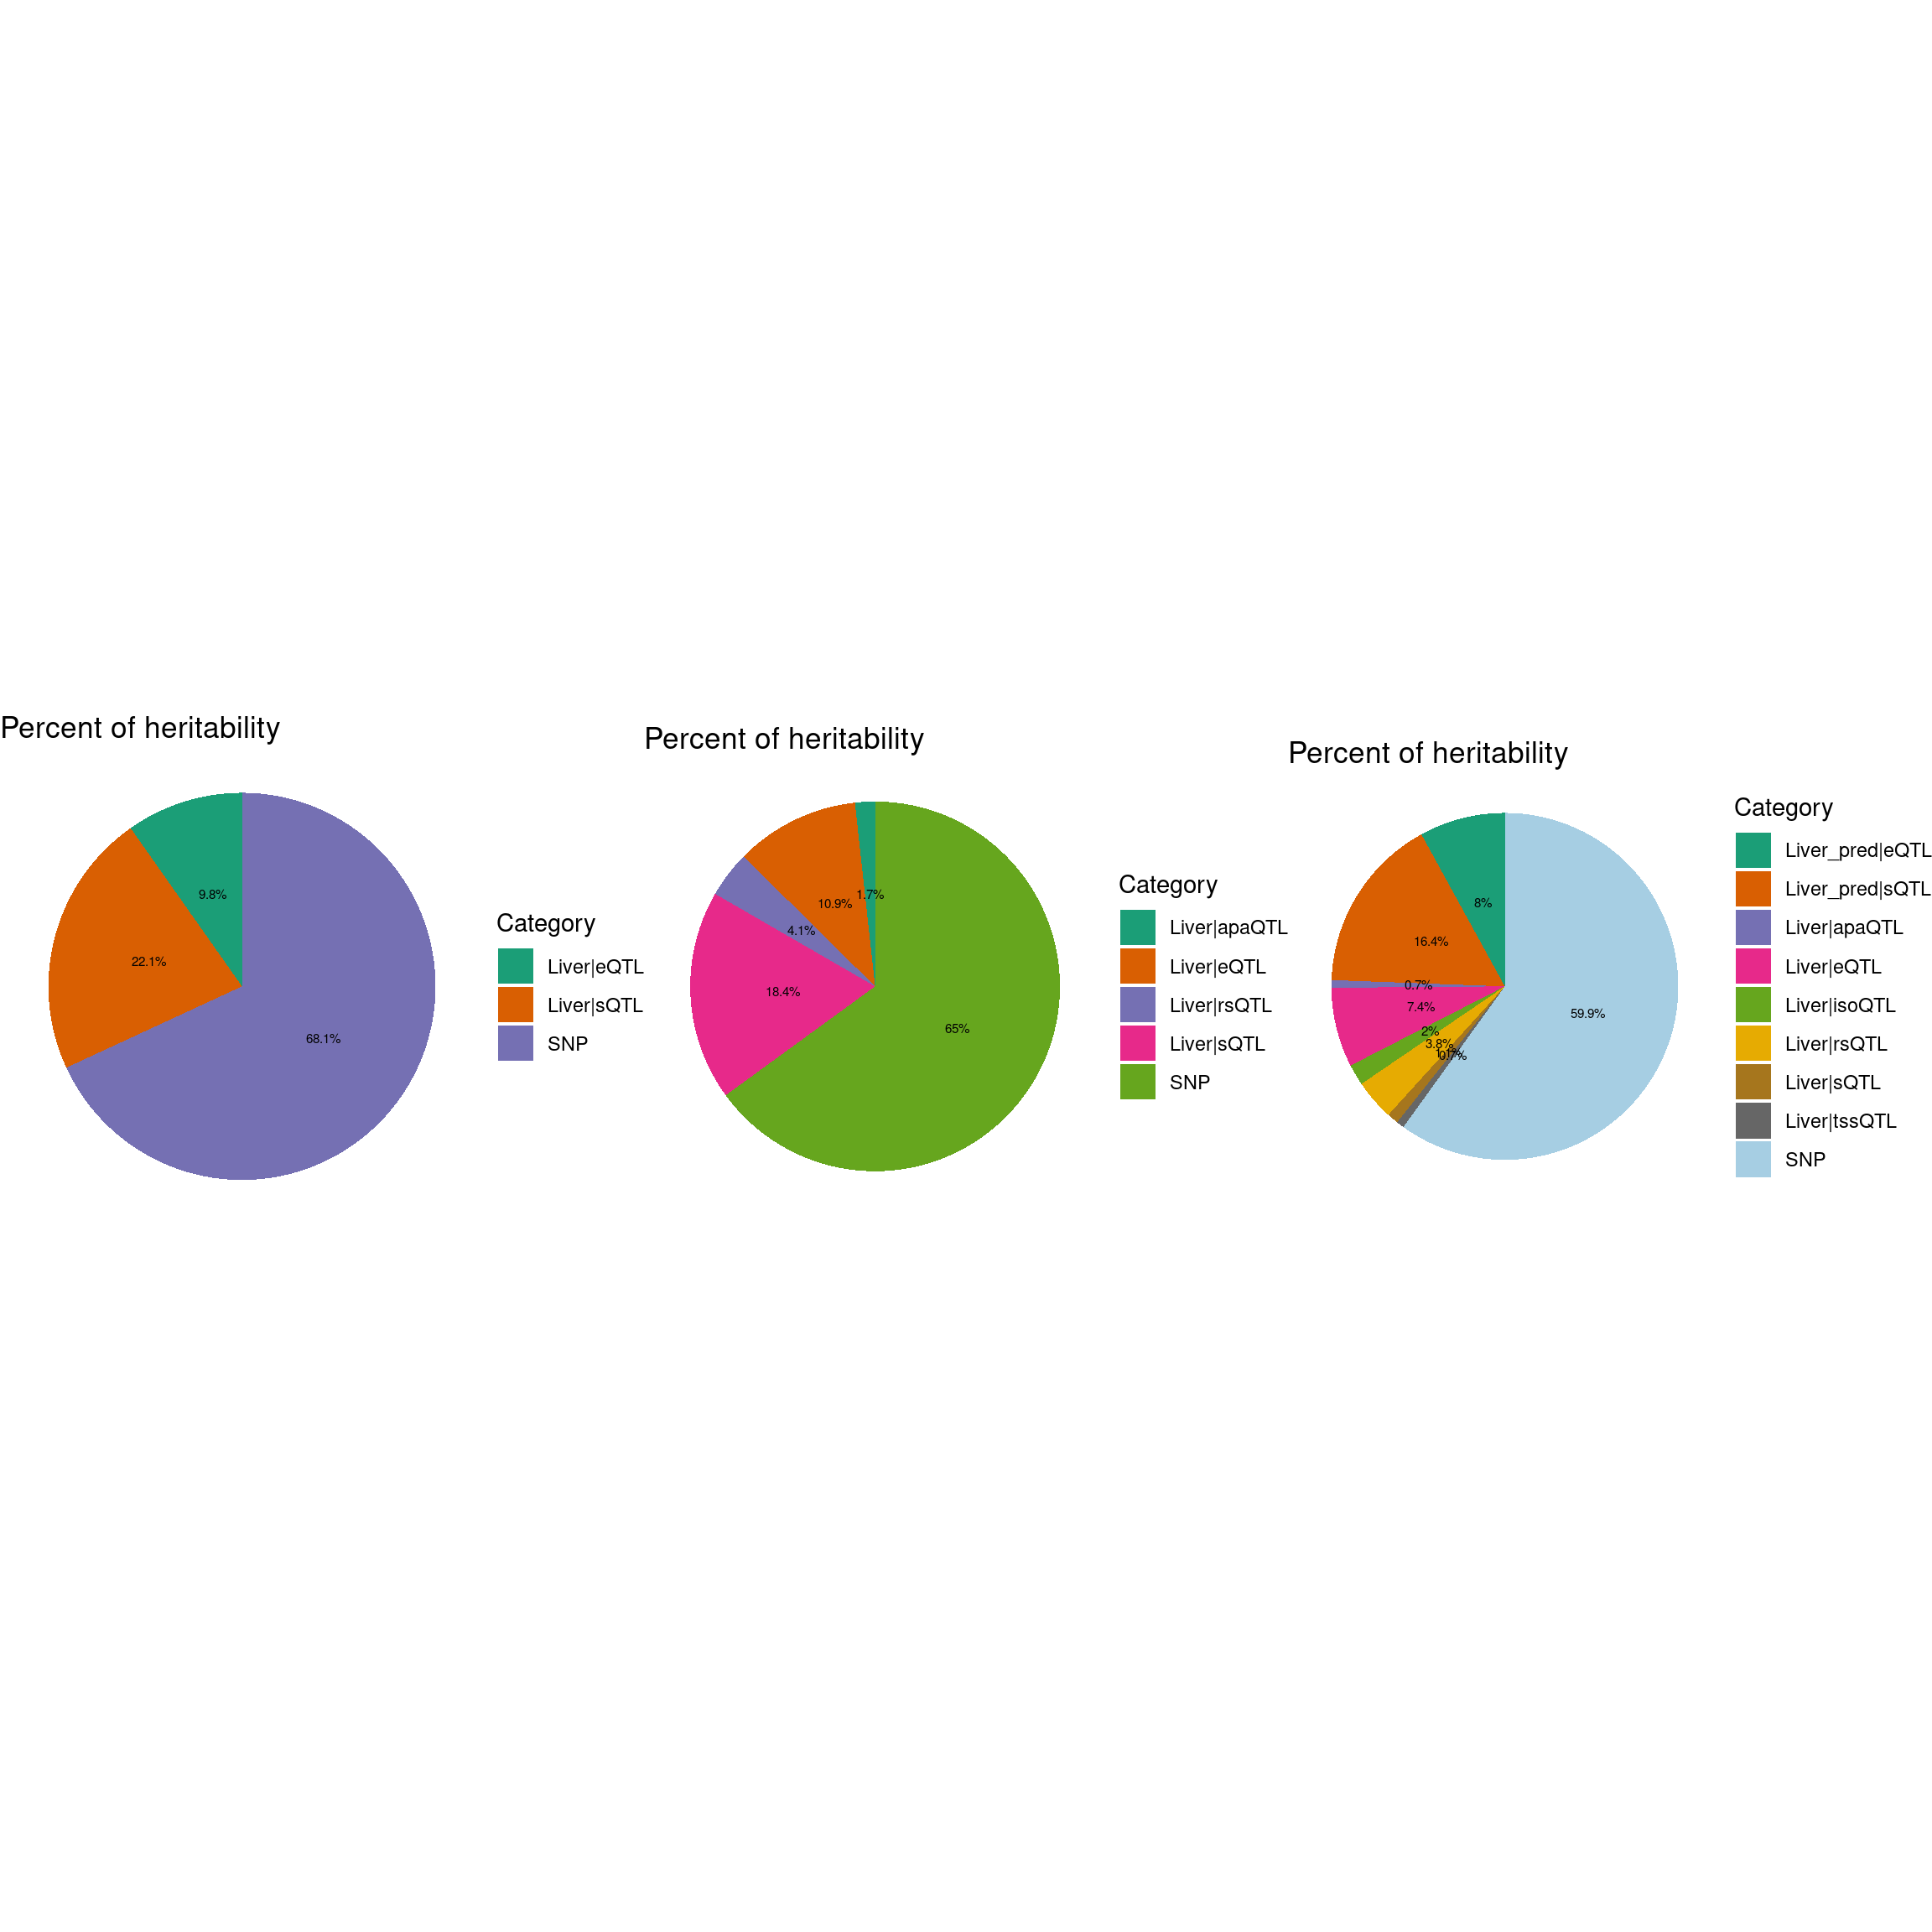
Comparing apaQTL and rsQTL
gene_apa <- unique(finemap_res_4W[finemap_res_4W$type == "apaQTL",]$gene_name)
gene_rs <- unique(finemap_res_4W[finemap_res_4W$type == "rsQTL",]$gene_name)
gene_overlap_rsapa <- intersect(gene_apa,gene_rs)
plot_venn_apars(gene_apa = gene_apa,gene_rs = gene_rs,gene_overlap = gene_overlap_rsapa)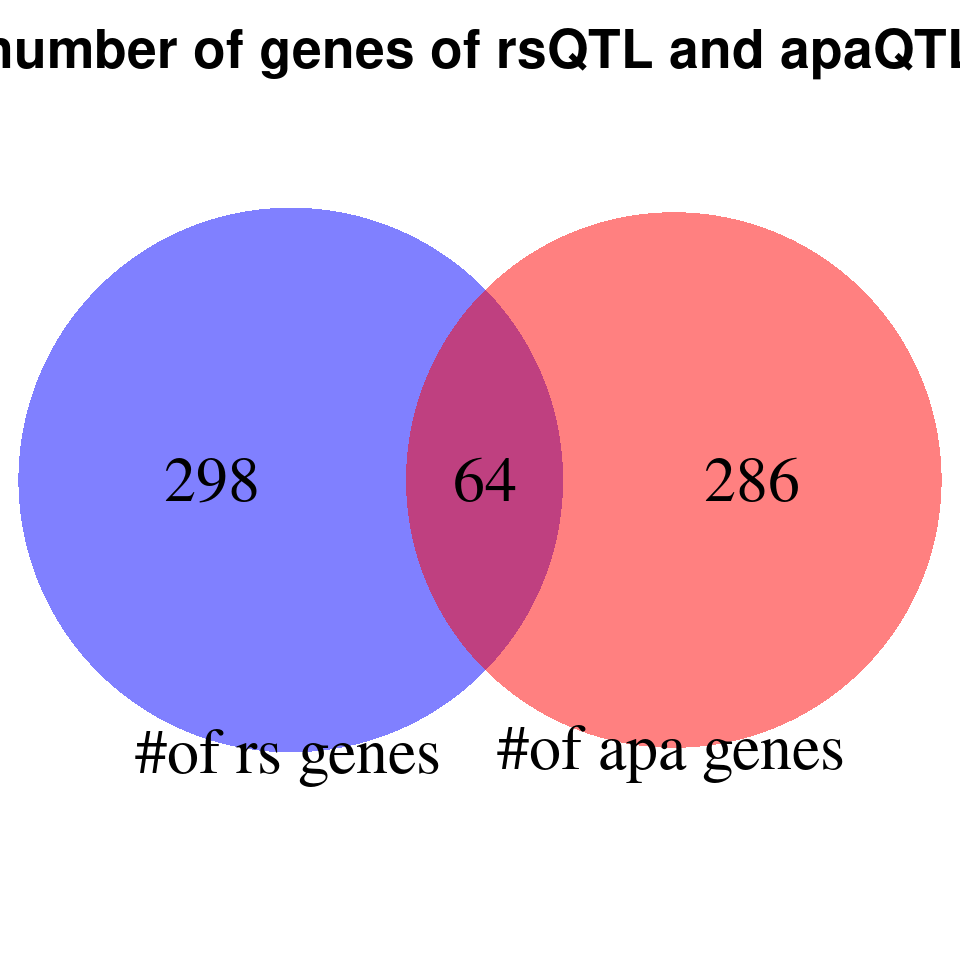
| Version | Author | Date |
|---|---|---|
| b00c776 | XSun | 2024-10-03 |
rs_apa_overlap_merged <- process_data_rsapa(finemap_res = finemap_res_4W)
plot_scatter_rsapa(rs_apa_overlap_merged = rs_apa_overlap_merged)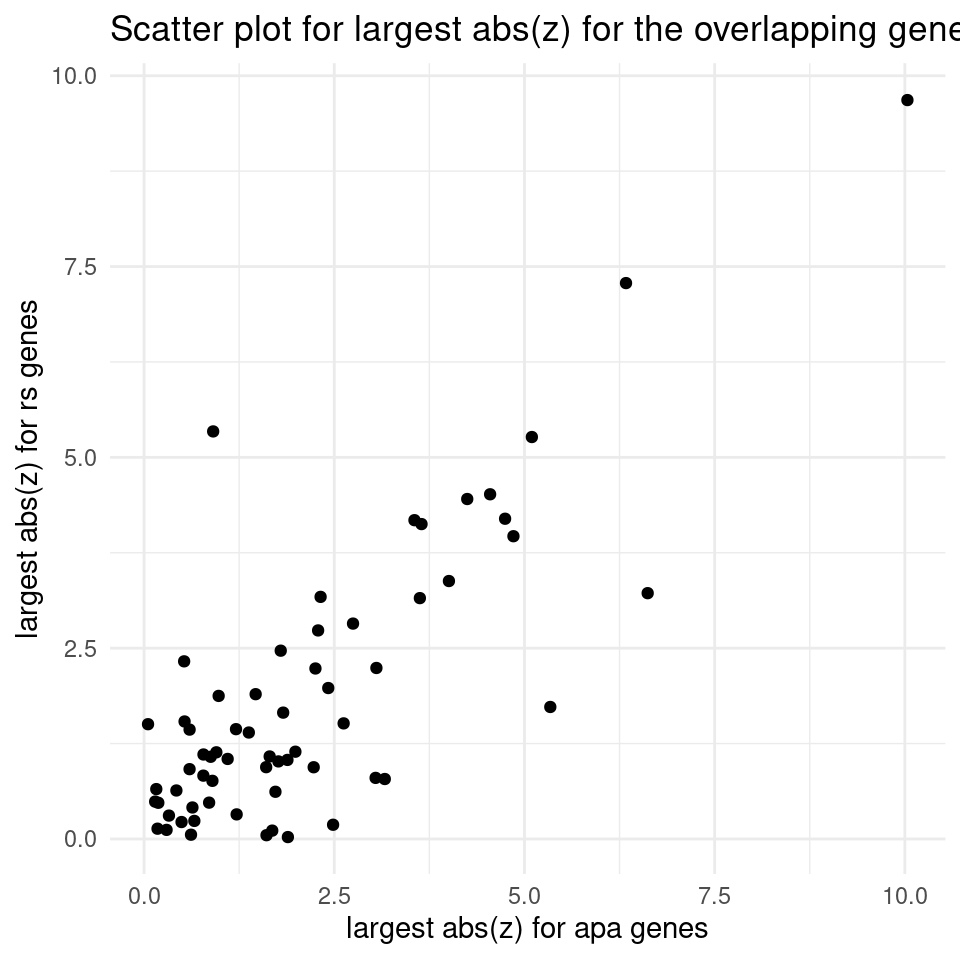
| Version | Author | Date |
|---|---|---|
| b00c776 | XSun | 2024-10-03 |
Fine-mapping results
combined_sig_espred <- combined_pip_by_type_espred[combined_pip_by_type_espred$combined_pip > 0.8,]
combined_sig_4W <- combined_pip_by_type_4W[combined_pip_by_type_4W$combined_pip > 0.8,]
combined_sig_8W <- combined_pip_by_type_8W[combined_pip_by_type_8W$combined_pip > 0.8,]

sprintf("# of genes with PIP > 0.8 = %s -- predictdb e +s", nrow(combined_sig_espred))
[1] "# of genes with PIP > 0.8 = 42 -- predictdb e +s"sprintf("# of genes with PIP > 0.8 = %s -- predictdb e + s + Munro apa + rs", nrow(combined_sig_4W))[1] "# of genes with PIP > 0.8 = 60 -- predictdb e + s + Munro apa + rs"sprintf("# of genes with PIP > 0.8 = %s -- all 8 weights", nrow(combined_sig_8W))[1] "# of genes with PIP > 0.8 = 75 -- all 8 weights"# DT::datatable(combined_sig_espred,caption = htmltools::tags$caption( style = 'caption-side: topleft; text-align = left; color:black;','High PIP genes -- predictdb e+s'),options = list(pageLength = 10) )
# DT::datatable(combined_sig_4W,caption = htmltools::tags$caption( style = 'caption-side: topleft; text-align = left; color:black;','High PIP genes -- predictdb e+s + Munro apa + rs'),options = list(pageLength = 10) )
# DT::datatable(combined_sig_8W,caption = htmltools::tags$caption( style = 'caption-side: topleft; text-align = left; color:black;','High PIP genes -- all 8 weights'),options = list(pageLength = 10) )
venn.plot <- plot_3venn(es = combined_sig_espred$gene_name,esra = combined_sig_4W$gene_name,all8 = combined_sig_8W$gene_name)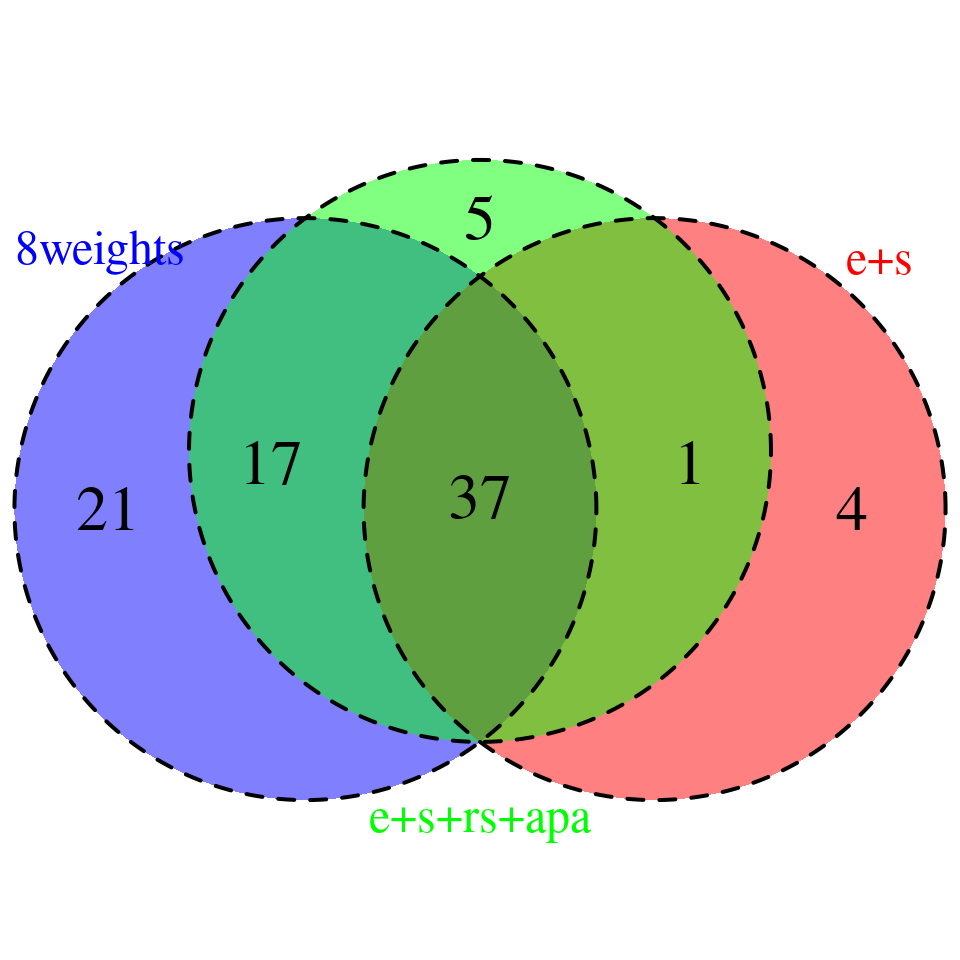
| Version | Author | Date |
|---|---|---|
| b00c776 | XSun | 2024-10-03 |
###1
heatmap_data <- combined_sig_8W[!combined_sig_8W$gene_name %in%combined_sig_espred$gene_name, ]
column_order <- c("gene_name","combined_pip",
                  "eQTL_pred_pip", "sQTL_pred_pip", "rsQTL_pip","apaQTL_pip",
                  "isoQTL_pip", "eQTL_pip","tssQTL_pip","sQTL_pip")
heatmap_data <- heatmap_data[,column_order]
colnames(heatmap_data) <- c("gene_name","combined_pip",
                  "eQTL_pred_pip", "sQTL_pred_pip", "rsQTL_munro_pip","apaQTL_munro_pip",
                  "isoQTL_munro_pip", "eQTL_munro_pip","tssQTL_munro_pip","sQTL_munro_pip")
p1 <- plot_heatmap(heatmap_data = heatmap_data,main = "PIP partition for the genes reported by 8weight setting but not by e+s setting")

###2
heatmap_data <- combined_sig_4W[!combined_sig_4W$gene_name %in%combined_sig_espred$gene_name, ]
column_order <- c("gene_name","combined_pip",
                  "eQTL_pip", "sQTL_pip", "rsQTL_pip","apaQTL_pip")
heatmap_data <- heatmap_data[,column_order]
colnames(heatmap_data) <- c("gene_name","combined_pip",
                  "eQTL_pred_pip", "sQTL_pred_pip", "rsQTL_munro_pip","apaQTL_munro_pip")
p2 <- plot_heatmap(heatmap_data = heatmap_data,main = "PIP partition for the genes reported by 4weight setting but not by e+s setting")

###3
heatmap_data <- combined_sig_8W[!combined_sig_8W$gene_name %in%combined_sig_4W$gene_name, ]
column_order <- c("gene_name","combined_pip",
                  "eQTL_pred_pip", "sQTL_pred_pip", "rsQTL_pip","apaQTL_pip",
                  "isoQTL_pip", "eQTL_pip","tssQTL_pip","sQTL_pip")
heatmap_data <- heatmap_data[,column_order]
colnames(heatmap_data) <- c("gene_name","combined_pip",
                  "eQTL_pred_pip", "sQTL_pred_pip", "rsQTL_munro_pip","apaQTL_munro_pip",
                  "isoQTL_munro_pip", "eQTL_munro_pip","tssQTL_munro_pip","sQTL_munro_pip")
p3 <- plot_heatmap(heatmap_data = heatmap_data,main = "PIP partition for the genes reported by 8weight setting but not by 4weight setting")

g1 <- p1$gtable
g2 <- p2$gtable
g3 <- p3$gtable
grid.arrange(g1, g2, g3, ncol=3)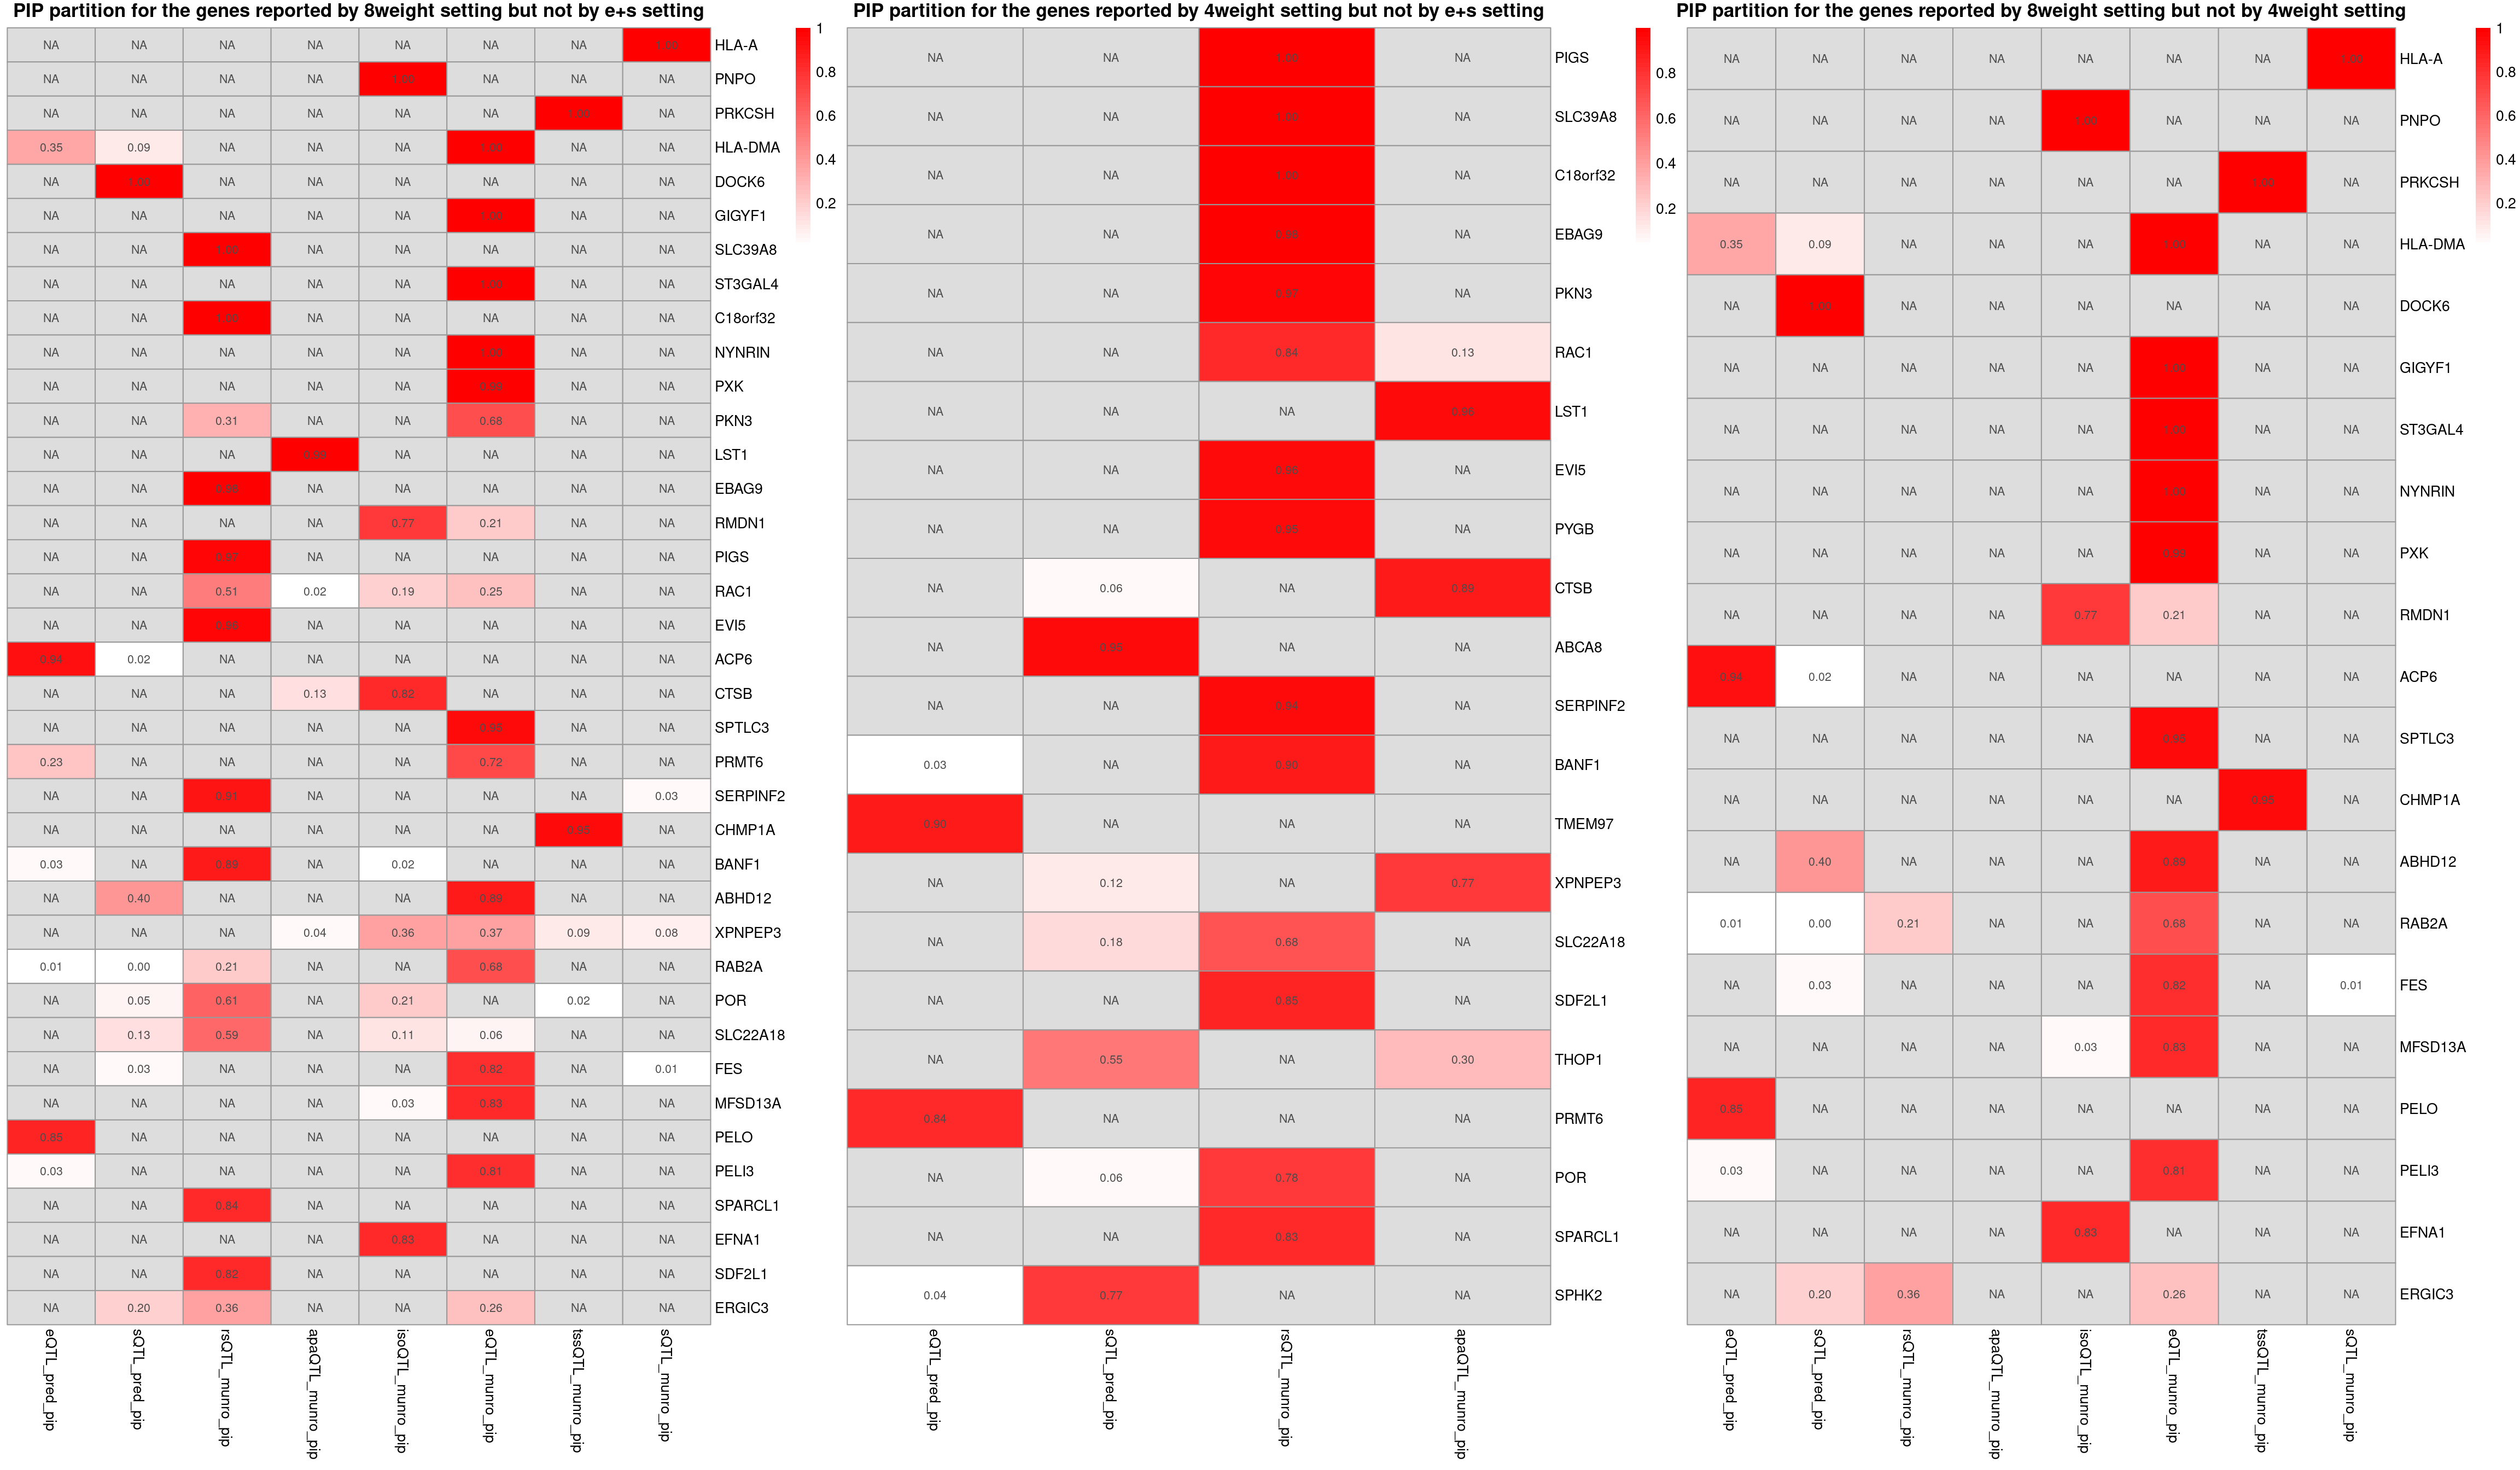
IBD-ebi-a-GCST004131
Comparing predictdb eQTL VS munro eQTL
trait <- "IBD-ebi-a-GCST004131"
tissue <- "Colon_Transverse"
### predictdb
results_dir_epred <- paste0("/project/xinhe/xsun/multi_group_ctwas/9.deciding_weights_4traits/results/",trait,"/epred/")

ctwas_res_epred <- readRDS(paste0(results_dir_epred,trait,".ctwas.res.RDS"))
snp_map_epred  <- readRDS(paste0(results_dir_epred,trait,".snp_map.RDS"))
finemap_res_epred <- ctwas_res_epred$finemap_res
finemap_res_epred$molecular_id <- get_molecular_ids(finemap_res_epred)

finemap_res_epred <- anno_finemap_res(finemap_res_epred,
                              snp_map = snp_map_epred,
                              mapping_table = mapping_predictdb,
                              add_gene_annot = TRUE,
                              map_by = "molecular_id",
                              drop_unmapped = TRUE,
                              add_position = TRUE,
                              use_gene_pos = "mid")
2024-10-07 15:24:44 INFO::Annotating fine-mapping result ...
2024-10-07 15:24:44 INFO::Map molecular traits to genes
2024-10-07 15:24:49 INFO::Add gene positions
2024-10-07 15:24:49 INFO::Add SNP positionsfinemap_res_gene_epred <- finemap_res_epred[finemap_res_epred$type !="SNP",]
### munro
results_dir_emunro <- paste0("/project/xinhe/xsun/multi_group_ctwas/9.deciding_weights_4traits/results/",trait,"/emunro/")
ctwas_res_emunro <- readRDS(paste0(results_dir_emunro,trait,".ctwas.res.RDS"))
snp_map_emunro <- readRDS(paste0(results_dir_emunro,trait,".snp_map.RDS"))
finemap_res_emunro <- ctwas_res_emunro$finemap_res
finemap_res_emunro$molecular_id <- get_molecular_ids(finemap_res_emunro)
finemap_res_emunro <- anno_finemap_res(finemap_res_emunro,
snp_map = snp_map_emunro,
mapping_table = mapping_munro,
add_gene_annot = TRUE,
map_by = "molecular_id",
drop_unmapped = TRUE,
add_position = TRUE,
use_gene_pos = "mid")2024-10-07 15:25:49 INFO::Annotating fine-mapping result ...
2024-10-07 15:25:49 INFO::Map molecular traits to genes
2024-10-07 15:25:54 INFO::Add gene positions
2024-10-07 15:25:54 INFO::Add SNP positionsfinemap_res_gene_emunro <- finemap_res_emunro[finemap_res_emunro$type !="SNP",]
overlap <- merge(finemap_res_gene_epred, finemap_res_gene_emunro, by = "gene_name")
overlap <- overlap[,c("gene_name","type.x","context.x","region_id.x","z.x","susie_pip.x","z.y","susie_pip.y")]
colnames(overlap) <- c("gene_name","type","context","region_id","z_predictdb","susie_pip_predictdb","z_munro","susie_pip_munro")
DT::datatable(overlap,caption = htmltools::tags$caption( style = 'caption-side: topleft; text-align = left; color:black;','overlapping genes'),options = list(pageLength = 10) )venn <- plot_venn(npred = nrow(finemap_res_gene_epred), nmunro = nrow(finemap_res_gene_emunro), noverlap = nrow(overlap))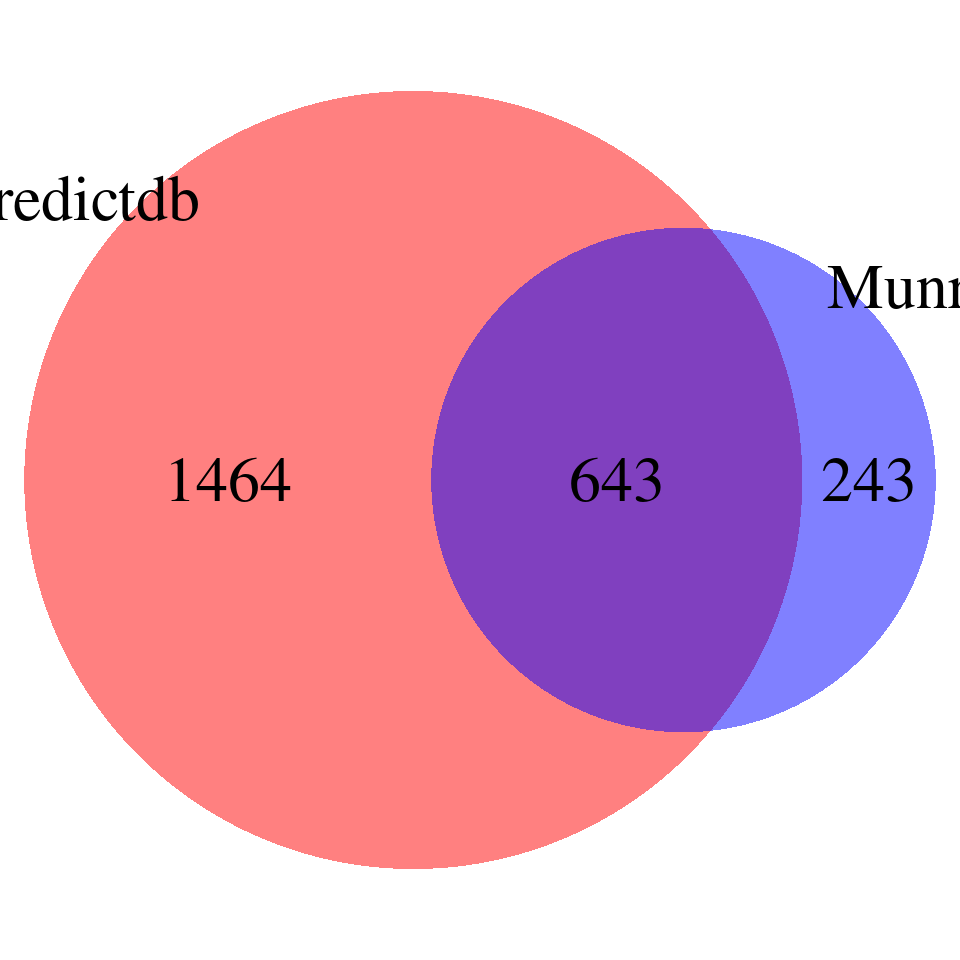
print("For the overlapping genes")[1] "For the overlapping genes"scatter_plot <- plot_scatter(overlap = overlap)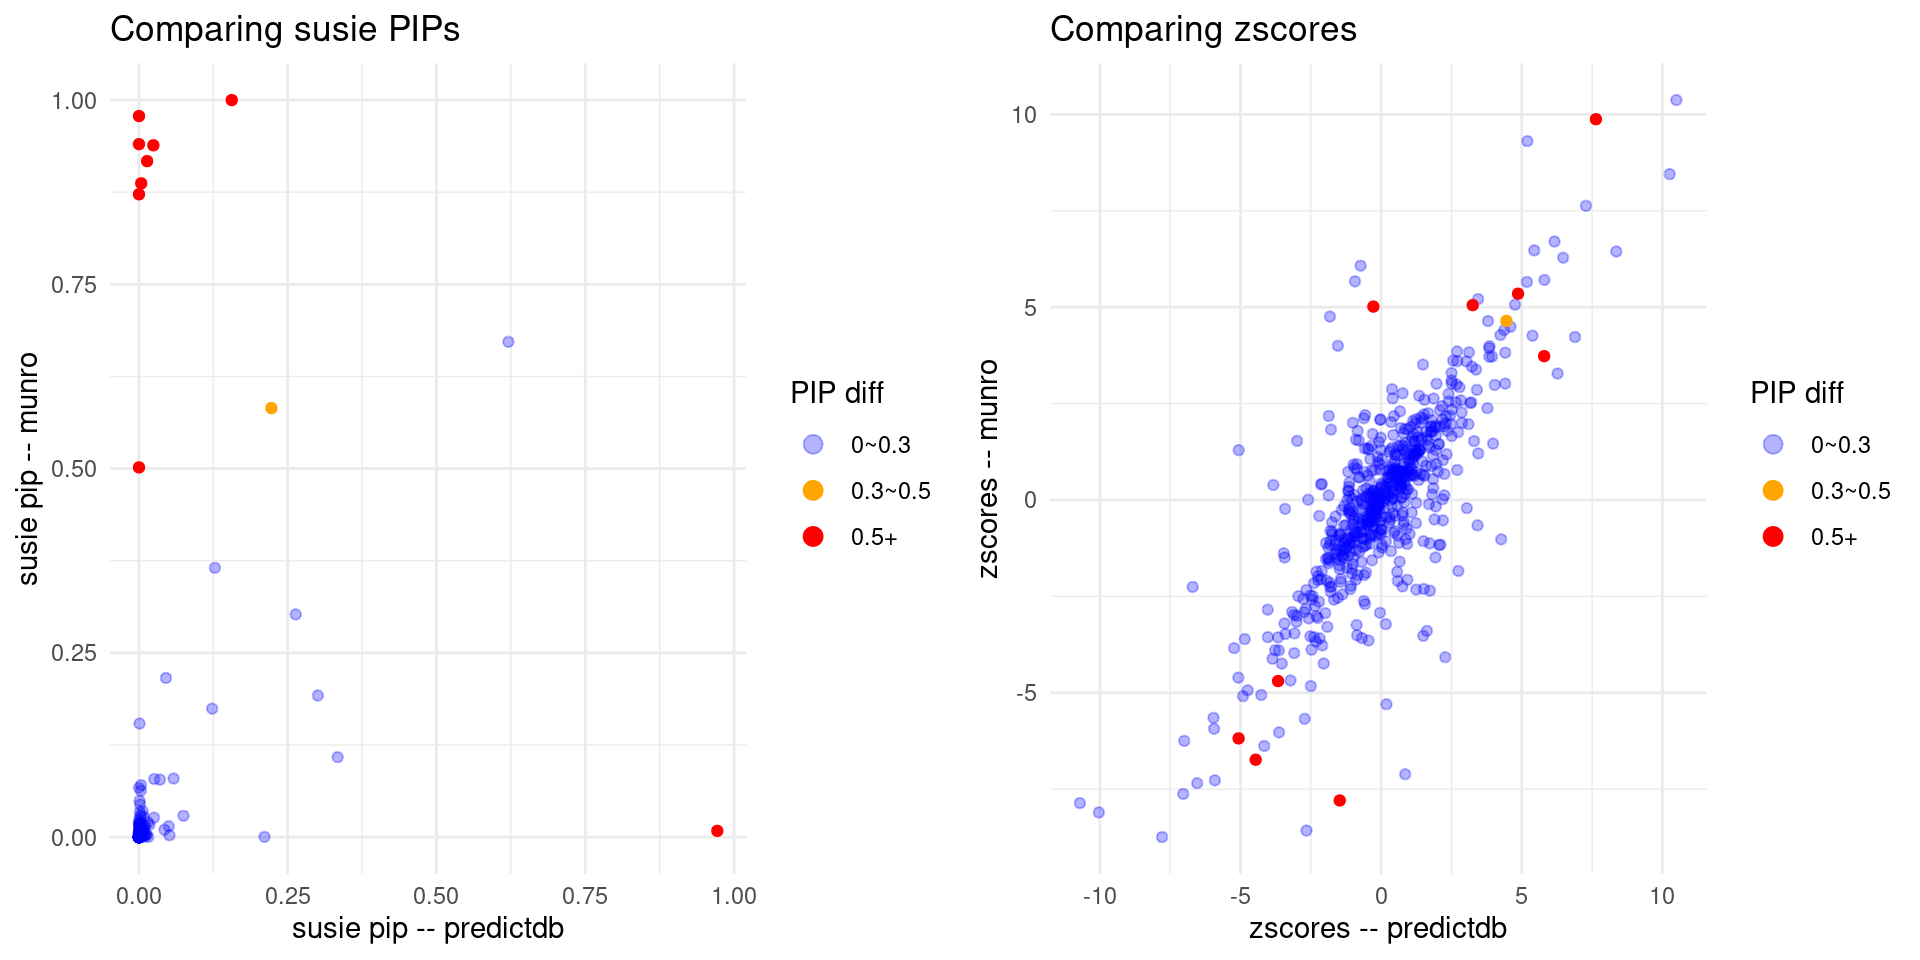
Comparing predictdb e+s VS predictdb e+s + Munro rs+apa VS all 8 weights
gwas_n <- samplesize[trait]

results_dir_espred <- paste0("/project/xinhe/xsun/multi_group_ctwas/9.deciding_weights_4traits/results/",trait,"/espred/")

snp_map_espred <- readRDS(paste0(results_dir_espred,trait,".snp_map.RDS"))
ctwas_res_espred <- readRDS(paste0(results_dir_espred,trait,".ctwas.res.RDS"))

param_espred <- ctwas_res_espred$param
finemap_res_espred <- ctwas_res_espred$finemap_res


p_conv_espred <- make_convergence_plots(param_espred, gwas_n, ncol = 1, colors = colors)
ctwas_parameters_espred <- summarize_param(param_espred, gwas_n)
pve_pie_espred <- plot_piechart(ctwas_parameters = ctwas_parameters_espred, colors = colors)

finemap_res_espred$molecular_id <- get_molecular_ids(finemap_res_espred)
finemap_res_espred <- anno_finemap_res(finemap_res_espred,
                              snp_map = snp_map_espred,
                              mapping_table = mapping_two,
                              add_gene_annot = TRUE,
                              map_by = "molecular_id",
                              drop_unmapped = TRUE,
                              add_position = TRUE,
                              use_gene_pos = "mid")
2024-10-07 15:26:57 INFO::Annotating fine-mapping result ...
2024-10-07 15:26:57 INFO::Map molecular traits to genes
2024-10-07 15:26:58 INFO::Split PIPs for molecular traits mapped to multiple genes
2024-10-07 15:27:03 INFO::Add gene positions
2024-10-07 15:27:04 INFO::Add SNP positionscombined_pip_by_type_espred <- combine_gene_pips(finemap_res =finemap_res_espred,
group_by = "gene_name",
by = "type",
method = "combine_cs",
filter_cs = T )2024-10-07 15:27:13 INFO::Limit gene results to credible setsresults_dir_4W <- paste0("/project/xinhe/xsun/multi_group_ctwas/9.deciding_weights_4traits/results/",trait,"/4W/")
snp_map_4W <- readRDS(paste0(results_dir_4W,trait,".snp_map.RDS"))
ctwas_res_4W <- readRDS(paste0(results_dir_4W,trait,".ctwas.res.RDS"))
param_4W <- ctwas_res_4W$param
finemap_res_4W <- ctwas_res_4W$finemap_res
p_conv_4W <- make_convergence_plots(param_4W, gwas_n, ncol = 1, colors = colors)
ctwas_parameters_4W <- summarize_param(param_4W, gwas_n)
pve_pie_4W <- plot_piechart(ctwas_parameters = ctwas_parameters_4W, colors = colors)
finemap_res_4W$molecular_id <- get_molecular_ids(finemap_res_4W)
finemap_res_4W <- anno_finemap_res(finemap_res_4W,
snp_map = snp_map_4W,
mapping_table = mapping_two,
add_gene_annot = TRUE,
map_by = "molecular_id",
drop_unmapped = TRUE,
add_position = TRUE,
use_gene_pos = "mid")2024-10-07 15:27:59 INFO::Annotating fine-mapping result ...
2024-10-07 15:27:59 INFO::Map molecular traits to genes
2024-10-07 15:28:00 INFO::Split PIPs for molecular traits mapped to multiple genes
2024-10-07 15:28:06 INFO::Add gene positions
2024-10-07 15:28:06 INFO::Add SNP positionscombined_pip_by_type_4W <- combine_gene_pips(finemap_res =finemap_res_4W,
group_by = "gene_name",
by = "type",
method = "combine_cs",
filter_cs = T )2024-10-07 15:28:15 INFO::Limit gene results to credible setsresults_dir_8W <- paste0("/project/xinhe/xsun/multi_group_ctwas/9.deciding_weights_4traits/results/",trait,"/8W/")
snp_map_8W <- readRDS(paste0(results_dir_8W,trait,".snp_map.RDS"))
ctwas_res_8W <- readRDS(paste0(results_dir_8W,trait,".ctwas.res.RDS"))
param_8W <- ctwas_res_8W$param
finemap_res_8W <- ctwas_res_8W$finemap_res
p_conv_8W <- make_convergence_plots(param_8W, gwas_n, ncol = 1, colors = colors)
ctwas_parameters_8W <- summarize_param(param_8W, gwas_n)
pve_pie_8W <- plot_piechart(ctwas_parameters = ctwas_parameters_8W, colors = colors)
finemap_res_8W$molecular_id <- get_molecular_ids(finemap_res_8W)
finemap_res_8W <- anno_finemap_res(finemap_res_8W,
snp_map = snp_map_8W,
mapping_table = mapping_two,
add_gene_annot = TRUE,
map_by = "molecular_id",
drop_unmapped = TRUE,
add_position = TRUE,
use_gene_pos = "mid")2024-10-07 15:28:58 INFO::Annotating fine-mapping result ...
2024-10-07 15:28:58 INFO::Map molecular traits to genes
2024-10-07 15:28:59 INFO::Split PIPs for molecular traits mapped to multiple genes
2024-10-07 15:29:05 INFO::Add gene positions
2024-10-07 15:29:05 INFO::Add SNP positionsfinemap_res_8W$type <- ifelse(grepl("_pred$", finemap_res_8W$context),
paste0(finemap_res_8W$type, "_pred"),
finemap_res_8W$type)
combined_pip_by_type_8W <- combine_gene_pips(finemap_res =finemap_res_8W,
group_by = "gene_name",
by = "type",
method = "combine_cs",
filter_cs = T )2024-10-07 15:29:21 INFO::Limit gene results to credible setsParameters
print("each row represents one setting: predictdb e+s, predictdb e+s + Munro apa+rs, all 8 weights accordingly")[1] "each row represents one setting: predictdb e+s, predictdb e+s + Munro apa+rs, all 8 weights accordingly"grid.arrange(p_conv_espred,p_conv_4W,p_conv_8W, ncol = 3)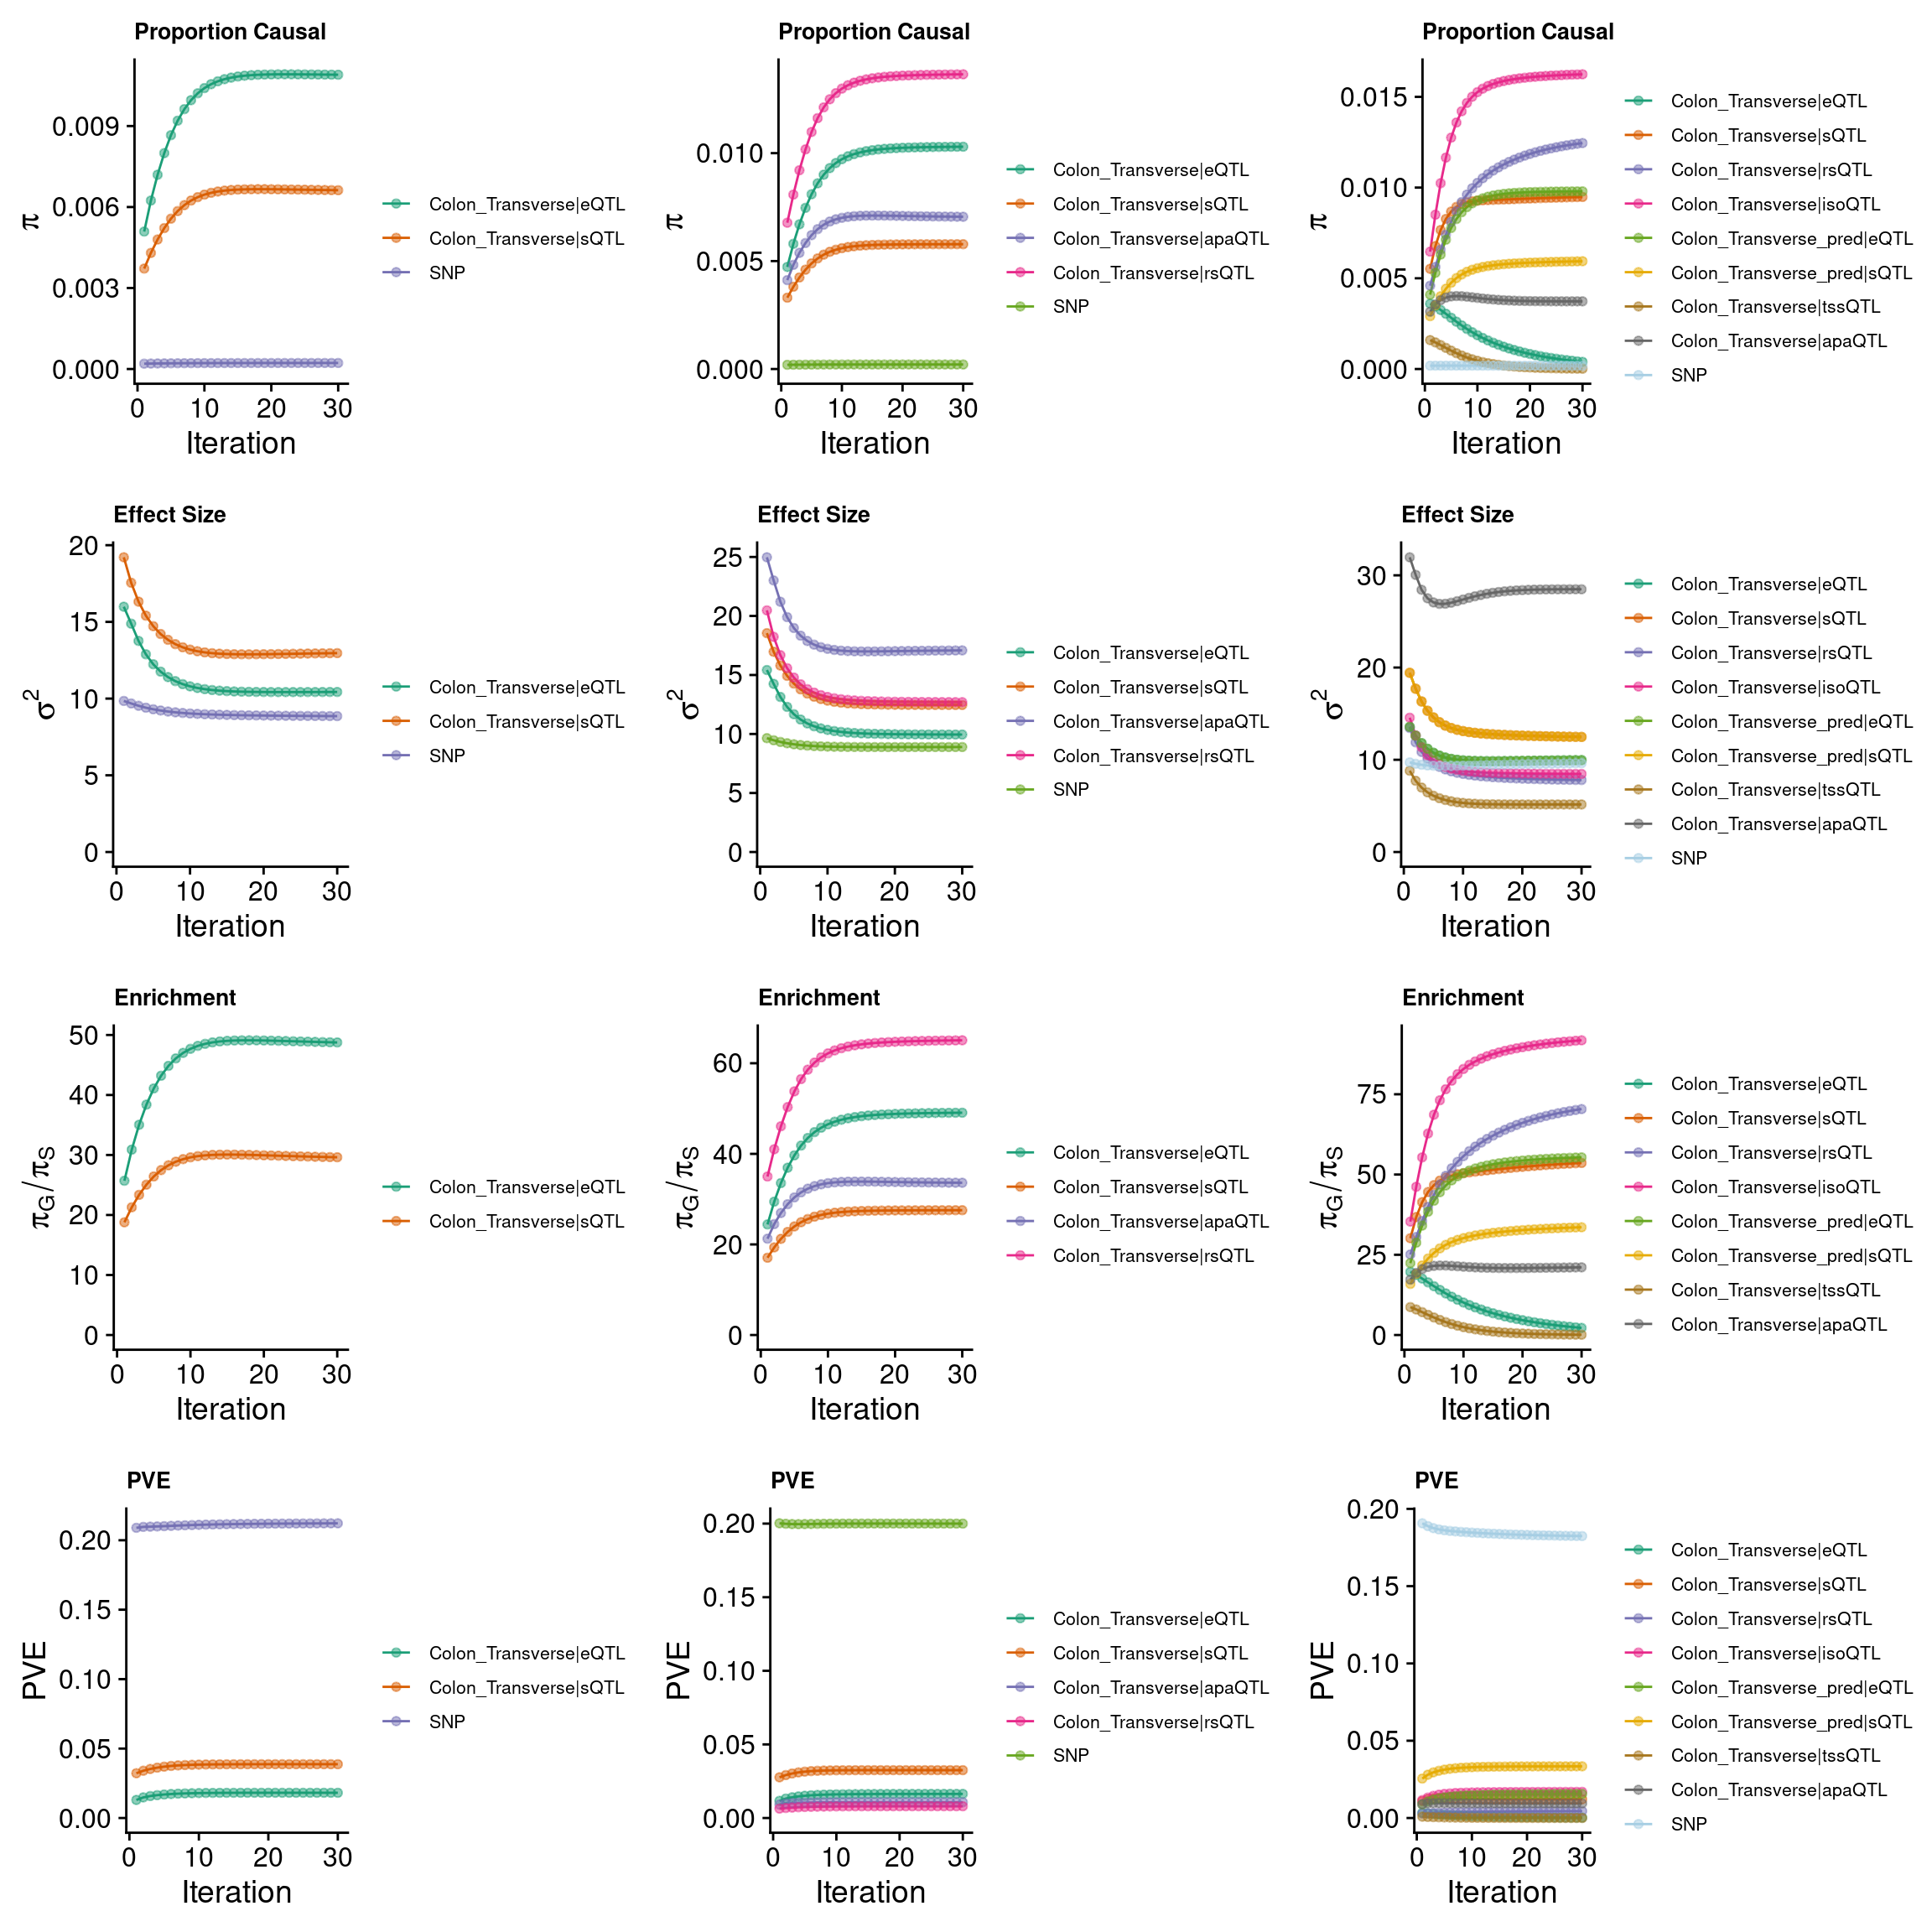
| Version | Author | Date |
|---|---|---|
| b00c776 | XSun | 2024-10-03 |
######pve
group_pve_espred <- ctwas_parameters_espred$group_pve
group_pve_espred <- group_pve_espred[-length(group_pve_espred)]
group_pve_espred <- c(group_pve_espred, rep(NA,6))
group_pve_espred <- c(group_pve_espred, ctwas_parameters_espred$total_pve)
names(group_pve_espred) <- c("eQTL_pred","sQTL_pred","apaQTL_munro","rsQTL_munro","isoQTL_munro","tssQTL_munro","eQTL_munro","sQTL_munro","TOTAL")

group_pve_4W <- ctwas_parameters_4W$group_pve
group_pve_4W <- group_pve_4W[-length(group_pve_4W)]
group_pve_4W <- c(group_pve_4W, rep(NA,4))
group_pve_4W <- c(group_pve_4W, ctwas_parameters_4W$total_pve)
names(group_pve_4W) <- c("eQTL_pred","sQTL_pred","apaQTL_munro","rsQTL_munro","isoQTL_munro","tssQTL_munro","eQTL_munro","sQTL_munro","TOTAL")

group_pve_8W <- ctwas_parameters_8W$group_pve
group_pve_8W <- group_pve_8W[-length(group_pve_8W)]
group_pve_8W <- group_pve_8W[c(paste0(tissue,"_pred|eQTL"),paste0(tissue,"_pred|sQTL"),paste0(tissue,"|apaQTL"),paste0(tissue,"|rsQTL"),paste0(tissue,"|isoQTL"),paste0(tissue,"|tssQTL"),paste0(tissue,"|eQTL"),paste0(tissue,"|sQTL"))]


group_pve_8W <- c(group_pve_8W, ctwas_parameters_8W$total_pve)
names(group_pve_8W) <- c("eQTL_pred","sQTL_pred","apaQTL_munro","rsQTL_munro","isoQTL_munro","tssQTL_munro","eQTL_munro","sQTL_munro","TOTAL")

grouppve <- cbind(group_pve_espred,group_pve_4W,group_pve_8W)
grouppve <- round(grouppve,digits = 4)

######size
group_size_espred <- ctwas_parameters_espred$group_size
group_size_espred <- group_size_espred[-length(group_size_espred)]
group_size_espred <- c(group_size_espred, rep(NA,6))
names(group_size_espred) <- c("eQTL_pred","sQTL_pred","apaQTL_munro","rsQTL_munro","isoQTL_munro","tssQTL_munro","eQTL_munro","sQTL_munro")

group_size_4W <- ctwas_parameters_4W$group_size
group_size_4W <- group_size_4W[-length(group_size_4W)]
group_size_4W <- c(group_size_4W, rep(NA,4))
names(group_size_4W) <- c("eQTL_pred","sQTL_pred","apaQTL_munro","rsQTL_munro","isoQTL_munro","tssQTL_munro","eQTL_munro","sQTL_munro")

group_size_8W <- ctwas_parameters_8W$group_size
group_size_8W <- group_size_8W[-length(group_size_8W)]
group_size_8W <- group_size_8W[c(paste0(tissue,"_pred|eQTL"),paste0(tissue,"_pred|sQTL"),paste0(tissue,"|apaQTL"),paste0(tissue,"|rsQTL"),paste0(tissue,"|isoQTL"),paste0(tissue,"|tssQTL"),paste0(tissue,"|eQTL"),paste0(tissue,"|sQTL"))]
names(group_size_8W) <- c("eQTL_pred","sQTL_pred","apaQTL_munro","rsQTL_munro","isoQTL_munro","tssQTL_munro","eQTL_munro","sQTL_munro")

groupsize <- cbind(group_size_espred,group_size_4W,group_size_8W)

group_info <- cbind(grouppve,rbind(groupsize,c(rep(NA,3))))

DT::datatable(group_info,caption = htmltools::tags$caption( style = 'caption-side: topleft; text-align = left; color:black;','Group PVE and Group Size'),options = list(pageLength = 10) )
print("each pie chart represents one setting: predictdb e+s, predictdb e+s + Munro apa+rs, all 8 weights accordingly")[1] "each pie chart represents one setting: predictdb e+s, predictdb e+s + Munro apa+rs, all 8 weights accordingly"grid.arrange(pve_pie_espred,pve_pie_4W,pve_pie_8W, ncol =3)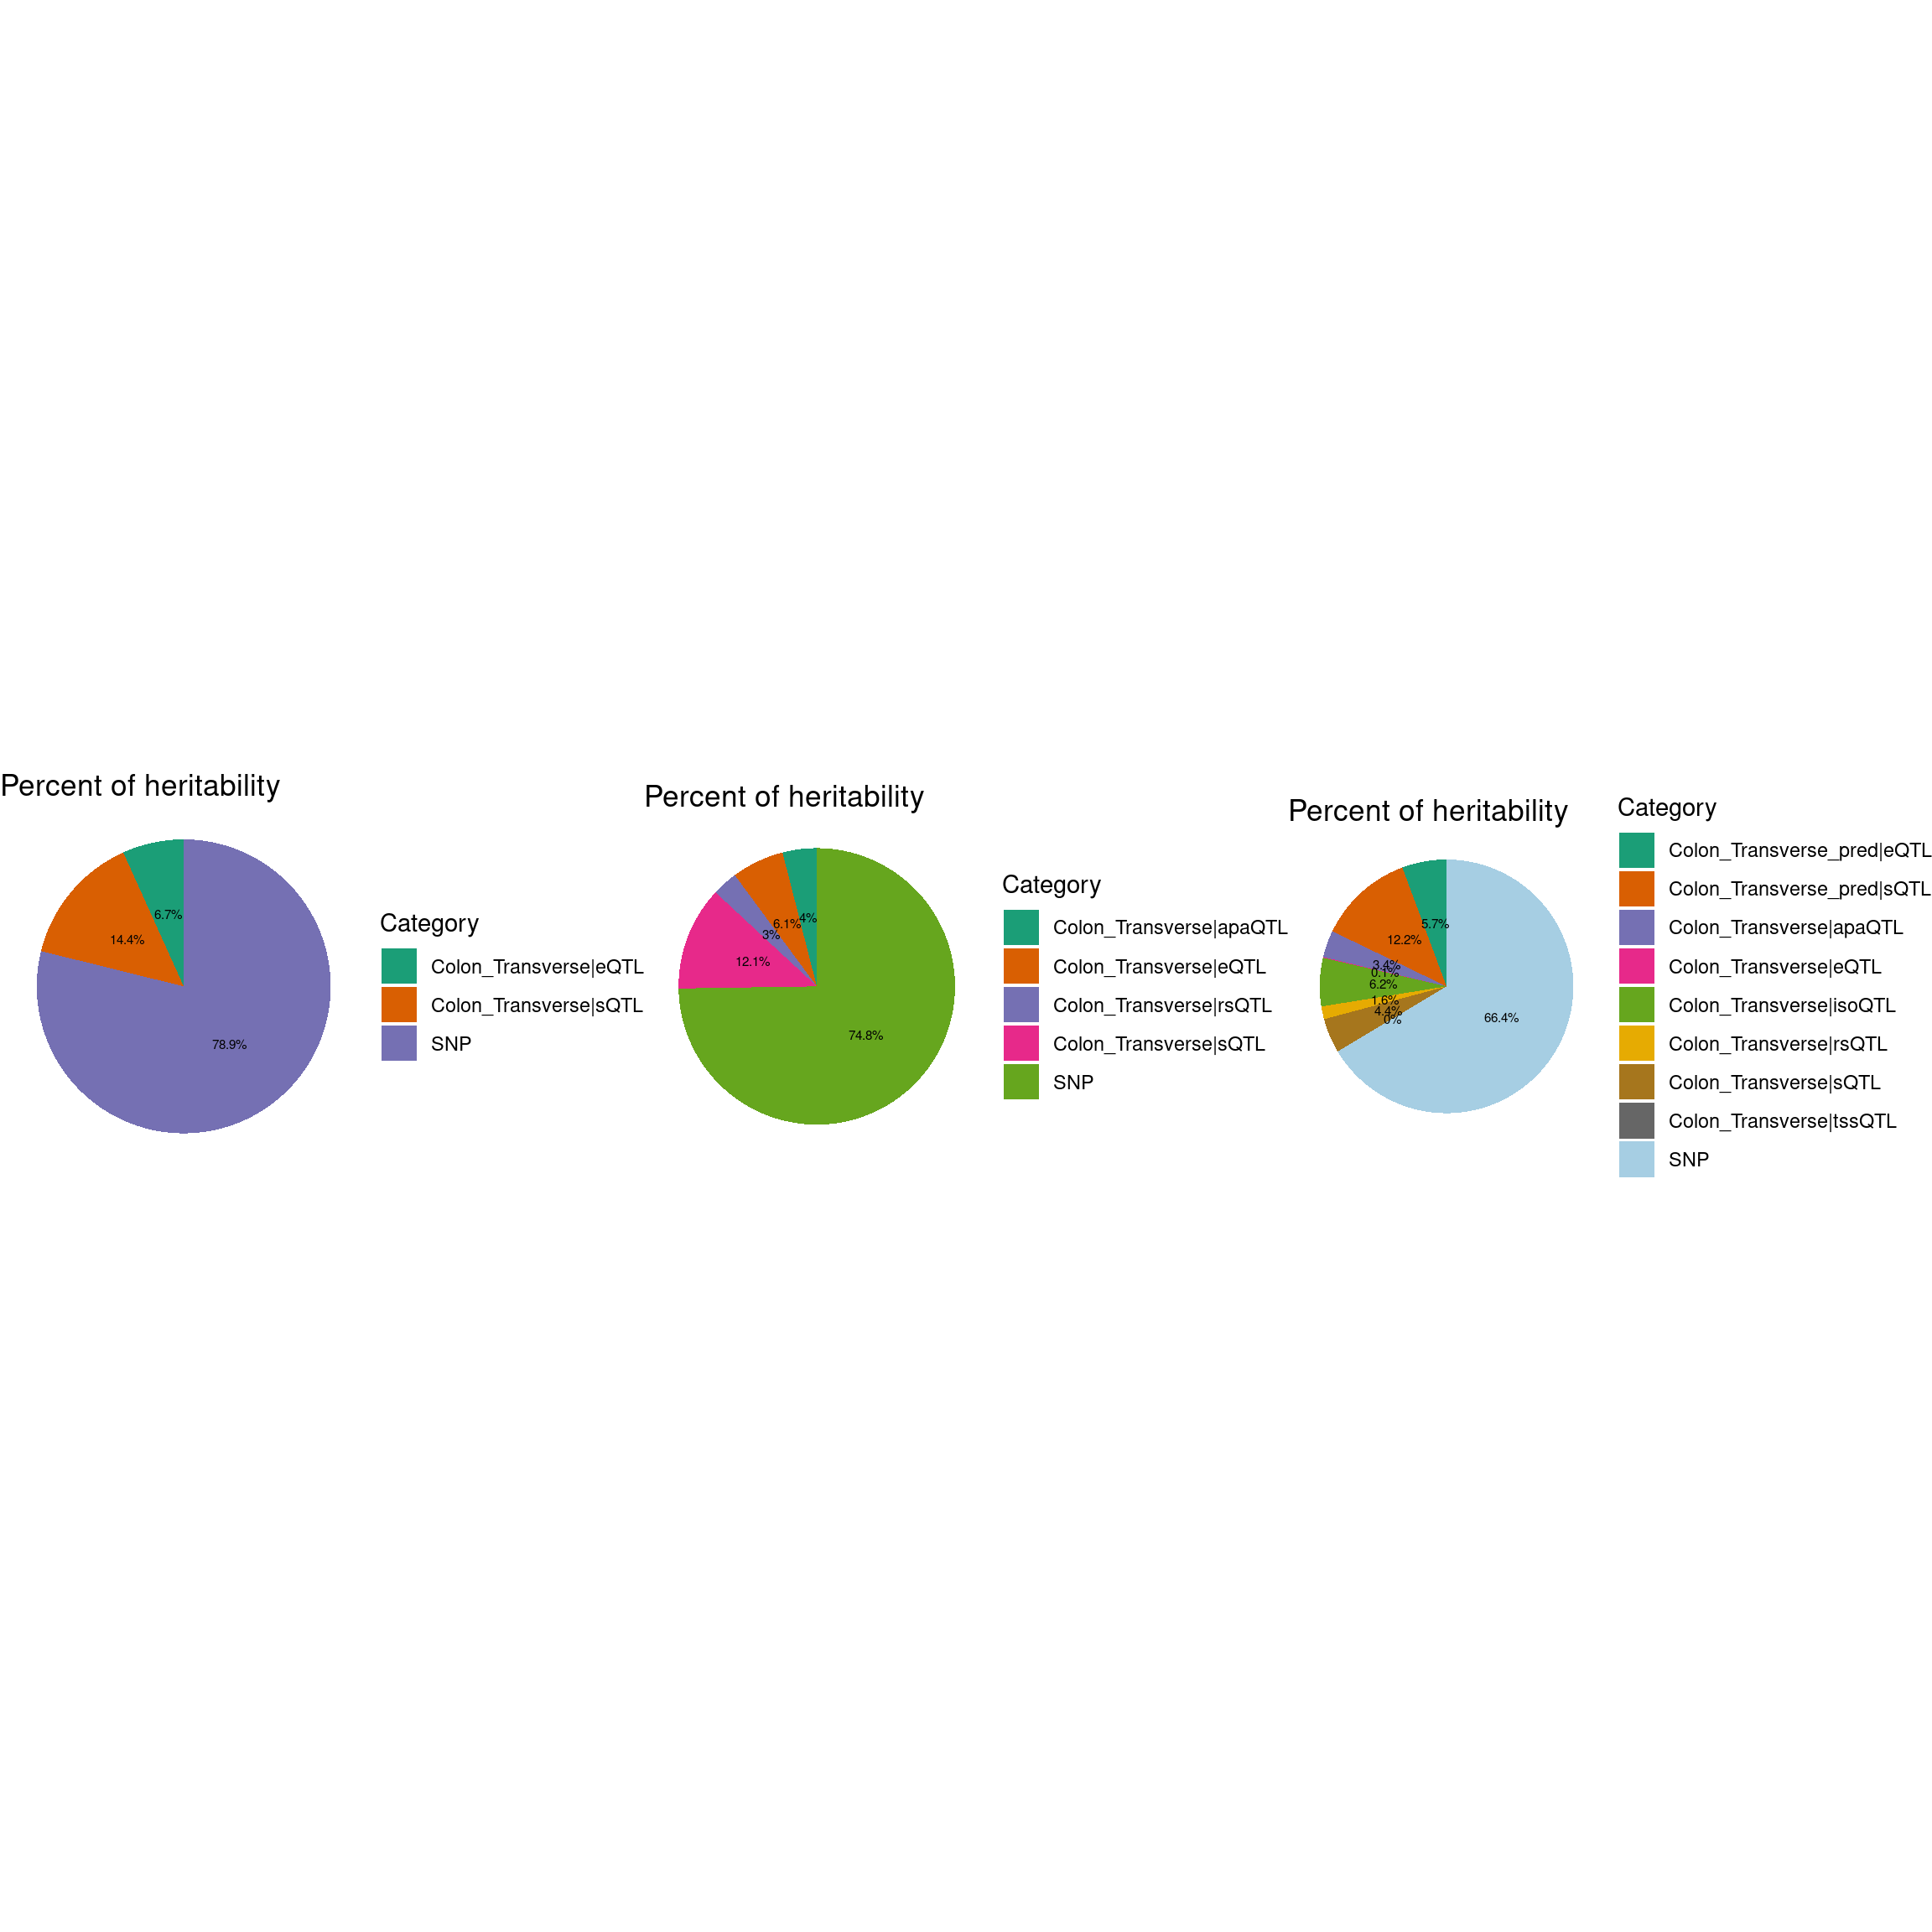
Comparing apaQTL and rsQTL
gene_apa <- unique(finemap_res_4W[finemap_res_4W$type == "apaQTL",]$gene_name)
gene_rs <- unique(finemap_res_4W[finemap_res_4W$type == "rsQTL",]$gene_name)
gene_overlap_rsapa <- intersect(gene_apa,gene_rs)
plot_venn_apars(gene_apa = gene_apa,gene_rs = gene_rs,gene_overlap = gene_overlap_rsapa)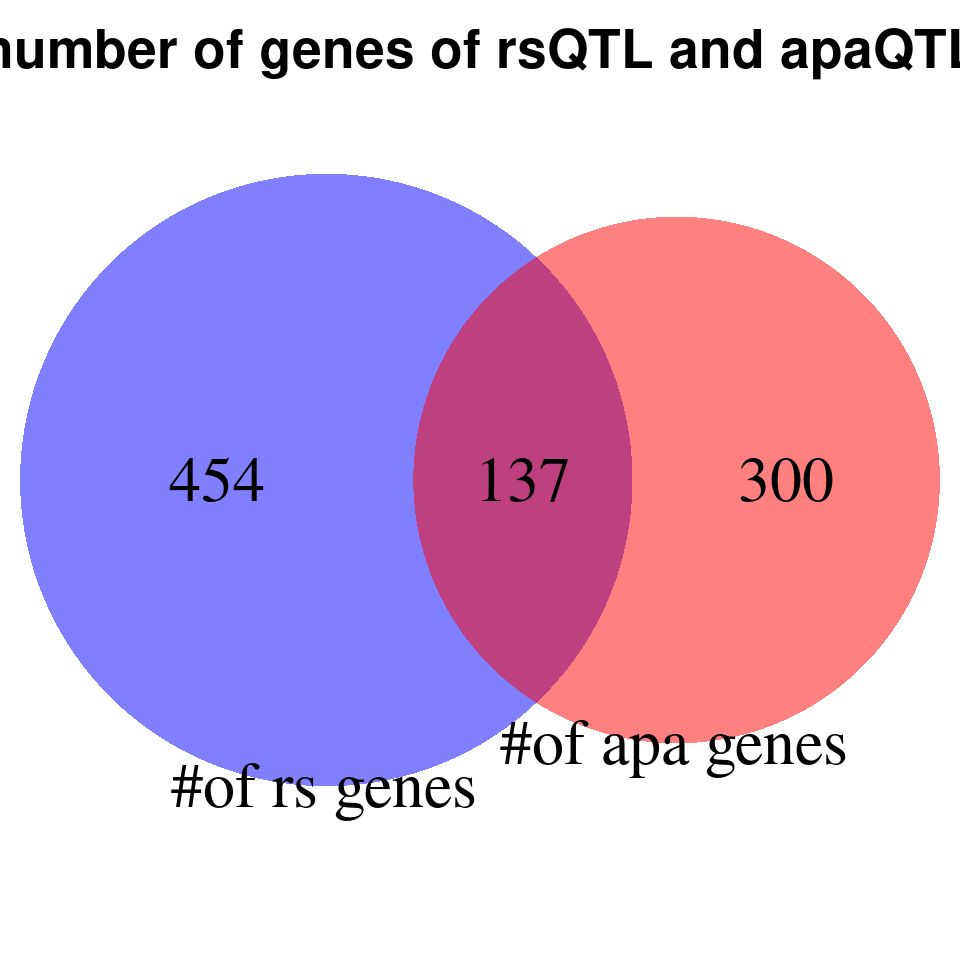
| Version | Author | Date |
|---|---|---|
| b00c776 | XSun | 2024-10-03 |
rs_apa_overlap_merged <- process_data_rsapa(finemap_res = finemap_res_4W)
plot_scatter_rsapa(rs_apa_overlap_merged = rs_apa_overlap_merged)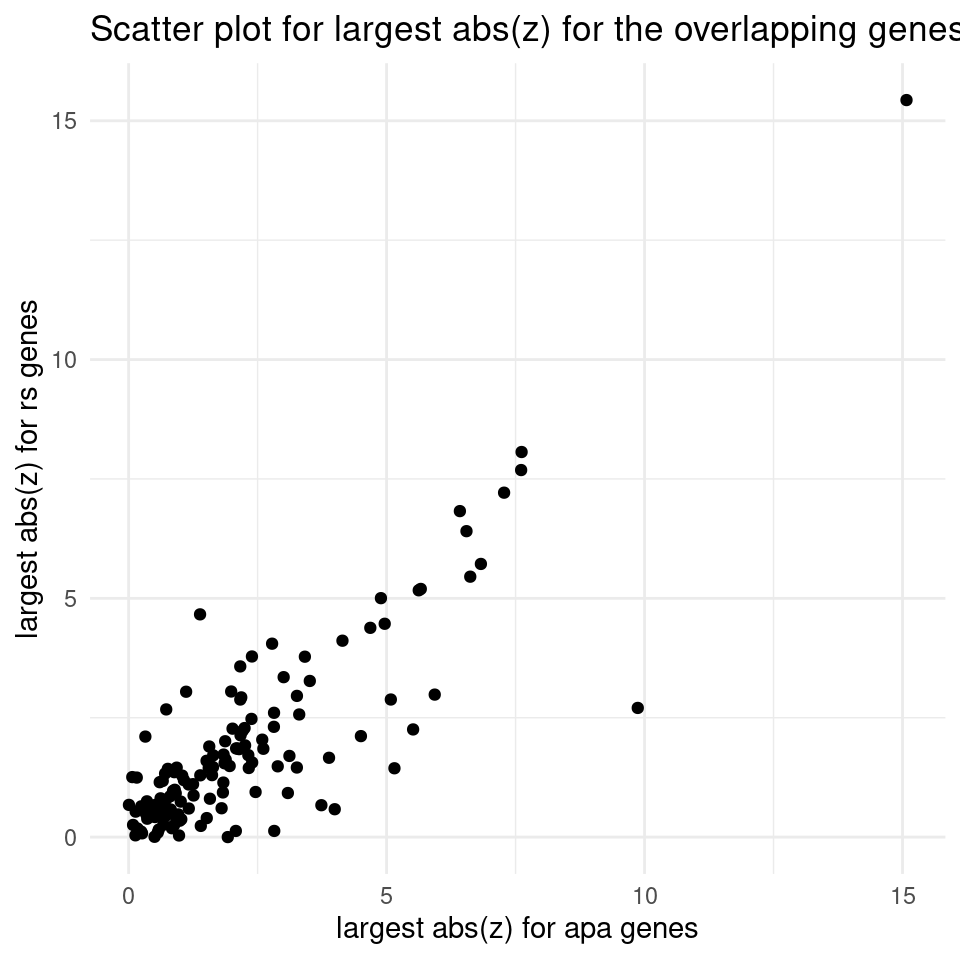 ### Fine-mapping results
combined_sig_espred <- combined_pip_by_type_espred[combined_pip_by_type_espred$combined_pip > 0.8,]
combined_sig_4W <- combined_pip_by_type_4W[combined_pip_by_type_4W$combined_pip > 0.8,]
combined_sig_8W <- combined_pip_by_type_8W[combined_pip_by_type_8W$combined_pip > 0.8,]

sprintf("# of genes with PIP > 0.8 = %s -- predictdb e +s", nrow(combined_sig_espred))
[1] "# of genes with PIP > 0.8 = 17 -- predictdb e +s"sprintf("# of genes with PIP > 0.8 = %s -- predictdb e + s + Munro apa + rs", nrow(combined_sig_4W))[1] "# of genes with PIP > 0.8 = 24 -- predictdb e + s + Munro apa + rs"sprintf("# of genes with PIP > 0.8 = %s -- all 8 weights", nrow(combined_sig_8W))[1] "# of genes with PIP > 0.8 = 43 -- all 8 weights"# DT::datatable(combined_sig_espred,caption = htmltools::tags$caption( style = 'caption-side: topleft; text-align = left; color:black;','High PIP genes -- predictdb e+s'),options = list(pageLength = 10) )
# DT::datatable(combined_sig_4W,caption = htmltools::tags$caption( style = 'caption-side: topleft; text-align = left; color:black;','High PIP genes -- predictdb e+s + Munro apa + rs'),options = list(pageLength = 10) )
# DT::datatable(combined_sig_8W,caption = htmltools::tags$caption( style = 'caption-side: topleft; text-align = left; color:black;','High PIP genes -- all 8 weights'),options = list(pageLength = 10) )
venn.plot <- plot_3venn(es = combined_sig_espred$gene_name,esra = combined_sig_4W$gene_name,all8 = combined_sig_8W$gene_name)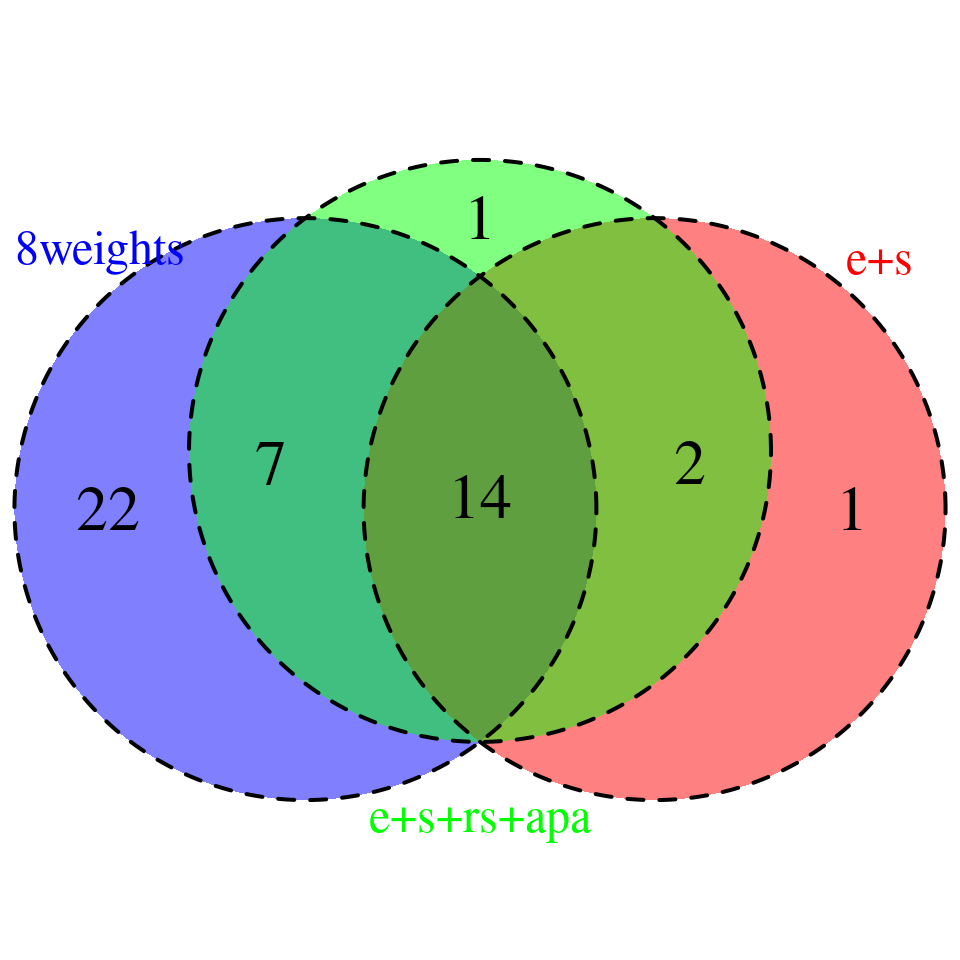
###1
heatmap_data <- combined_sig_8W[!combined_sig_8W$gene_name %in%combined_sig_espred$gene_name, ]
column_order <- c("gene_name","combined_pip",
                  "eQTL_pred_pip", "sQTL_pred_pip", "rsQTL_pip","apaQTL_pip",
                  "isoQTL_pip", "eQTL_pip","tssQTL_pip","sQTL_pip")
heatmap_data <- rename_heatmap_columns(heatmap_data = heatmap_data, column_order = column_order)
p1 <- plot_heatmap(heatmap_data = heatmap_data,main = "PIP partition for the genes reported by 8weight setting but not by e+s setting")

###2
heatmap_data <- combined_sig_4W[!combined_sig_4W$gene_name %in%combined_sig_espred$gene_name, ]
column_order <- c("gene_name","combined_pip",
                  "eQTL_pip", "sQTL_pip", "rsQTL_pip","apaQTL_pip")
heatmap_data <- rename_heatmap_columns(heatmap_data = heatmap_data, column_order = column_order)
p2 <- plot_heatmap(heatmap_data = heatmap_data,main = "PIP partition for the genes reported by 4weight setting but not by e+s setting")

###3
heatmap_data <- combined_sig_8W[!combined_sig_8W$gene_name %in%combined_sig_4W$gene_name, ]
column_order <- c("gene_name","combined_pip",
                  "eQTL_pred_pip", "sQTL_pred_pip", "rsQTL_pip","apaQTL_pip",
                  "isoQTL_pip", "eQTL_pip","tssQTL_pip","sQTL_pip")
heatmap_data <- rename_heatmap_columns(heatmap_data = heatmap_data, column_order = column_order)


p3 <- plot_heatmap(heatmap_data = heatmap_data,main = "PIP partition for the genes reported by 8weight setting but not by 4weight setting")

g1 <- p1$gtable
g2 <- p2$gtable
g3 <- p3$gtable
grid.arrange(g1, g2, g3, ncol=3)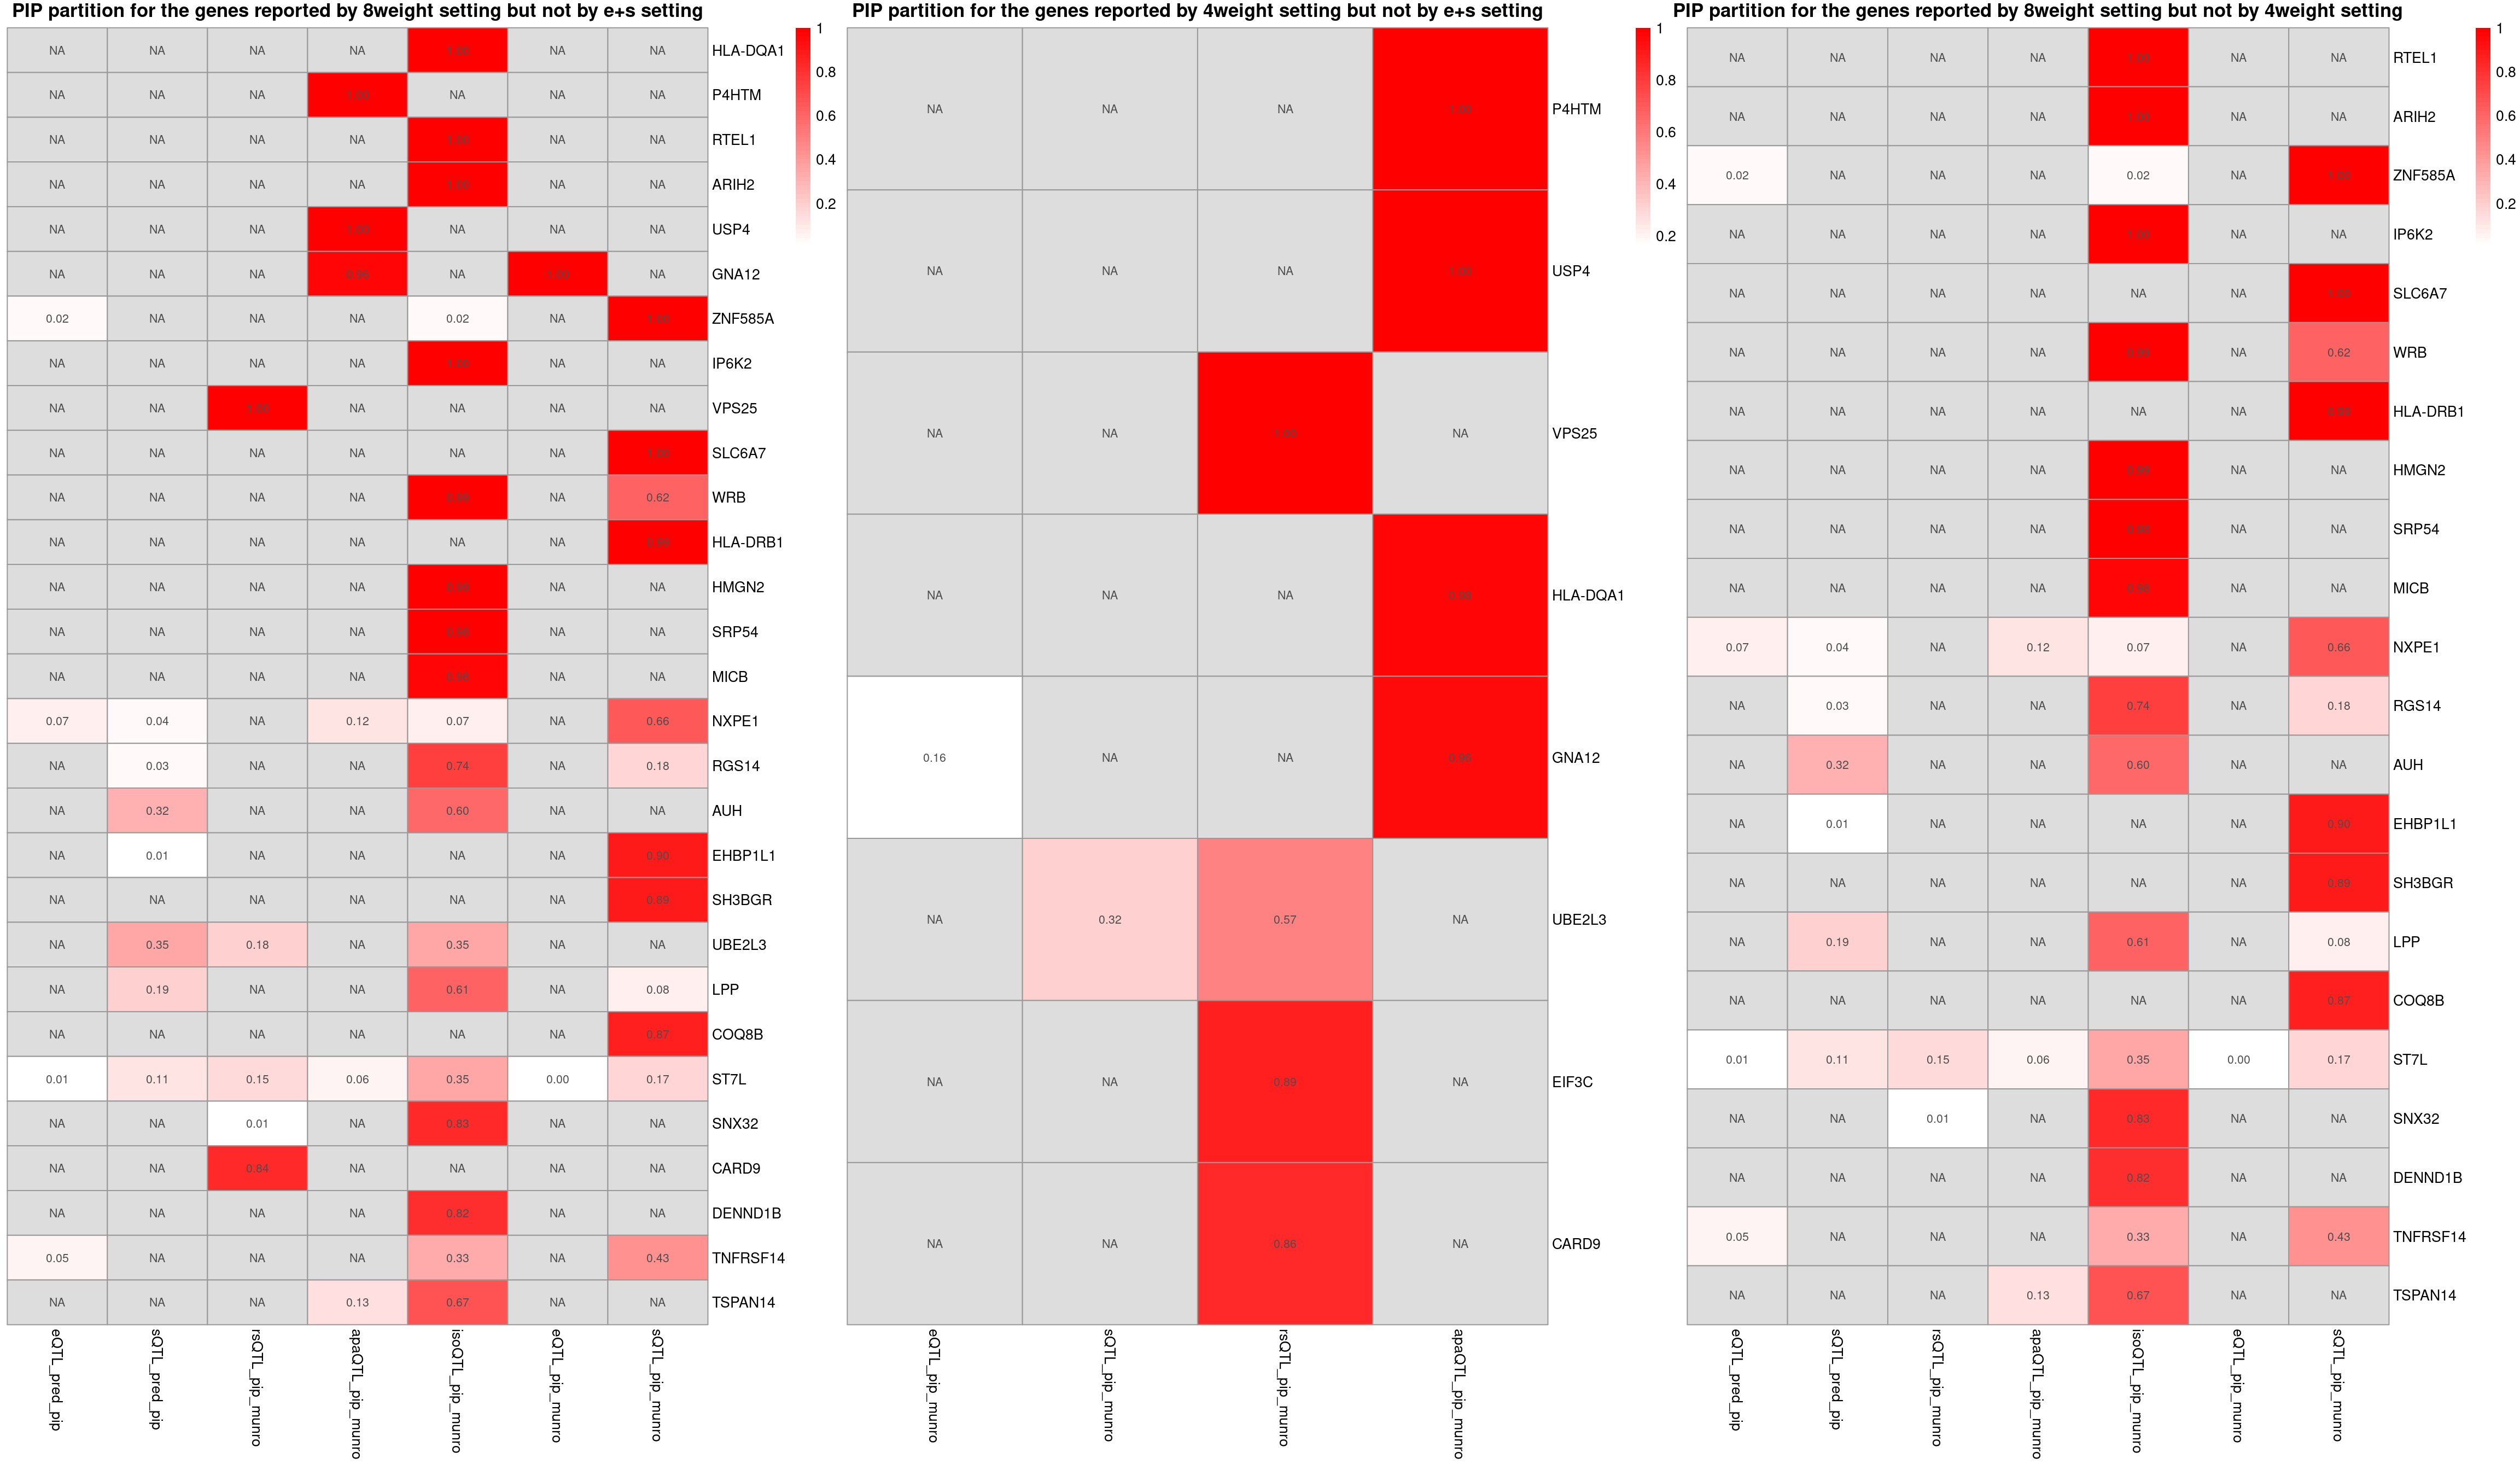
SBP-ukb-a-360
Comparing predictdb eQTL VS munro eQTL
trait <- "SBP-ukb-a-360"
tissue <- "Artery_Tibial"

### predictdb
results_dir_epred <- paste0("/project/xinhe/xsun/multi_group_ctwas/9.deciding_weights_4traits/results/",trait,"/epred/")

ctwas_res_epred <- readRDS(paste0(results_dir_epred,trait,".ctwas.res.RDS"))
snp_map_epred  <- readRDS(paste0(results_dir_epred,trait,".snp_map.RDS"))
finemap_res_epred <- ctwas_res_epred$finemap_res
finemap_res_epred$molecular_id <- get_molecular_ids(finemap_res_epred)

finemap_res_epred <- anno_finemap_res(finemap_res_epred,
                              snp_map = snp_map_epred,
                              mapping_table = mapping_predictdb,
                              add_gene_annot = TRUE,
                              map_by = "molecular_id",
                              drop_unmapped = TRUE,
                              add_position = TRUE,
                              use_gene_pos = "mid")
2024-10-07 15:30:28 INFO::Annotating fine-mapping result ...
2024-10-07 15:30:28 INFO::Map molecular traits to genes
2024-10-07 15:30:37 INFO::Add gene positions
2024-10-07 15:30:37 INFO::Add SNP positionsfinemap_res_gene_epred <- finemap_res_epred[finemap_res_epred$type !="SNP",]
### munro
results_dir_emunro <- paste0("/project/xinhe/xsun/multi_group_ctwas/9.deciding_weights_4traits/results/",trait,"/emunro/")
ctwas_res_emunro <- readRDS(paste0(results_dir_emunro,trait,".ctwas.res.RDS"))
snp_map_emunro <- readRDS(paste0(results_dir_emunro,trait,".snp_map.RDS"))
finemap_res_emunro <- ctwas_res_emunro$finemap_res
finemap_res_emunro$molecular_id <- get_molecular_ids(finemap_res_emunro)
finemap_res_emunro <- anno_finemap_res(finemap_res_emunro,
snp_map = snp_map_emunro,
mapping_table = mapping_munro,
add_gene_annot = TRUE,
map_by = "molecular_id",
drop_unmapped = TRUE,
add_position = TRUE,
use_gene_pos = "mid")2024-10-07 15:31:33 INFO::Annotating fine-mapping result ...
2024-10-07 15:31:36 INFO::Map molecular traits to genes
2024-10-07 15:31:44 INFO::Add gene positions
2024-10-07 15:31:44 INFO::Add SNP positionsfinemap_res_gene_emunro <- finemap_res_emunro[finemap_res_emunro$type !="SNP",]
overlap <- merge(finemap_res_gene_epred, finemap_res_gene_emunro, by = "gene_name")
overlap <- overlap[,c("gene_name","type.x","context.x","region_id.x","z.x","susie_pip.x","z.y","susie_pip.y")]
colnames(overlap) <- c("gene_name","type","context","region_id","z_predictdb","susie_pip_predictdb","z_munro","susie_pip_munro")
DT::datatable(overlap,caption = htmltools::tags$caption( style = 'caption-side: topleft; text-align = left; color:black;','overlapping genes'),options = list(pageLength = 10) )venn <- plot_venn(npred = nrow(finemap_res_gene_epred), nmunro = nrow(finemap_res_gene_emunro), noverlap = nrow(overlap))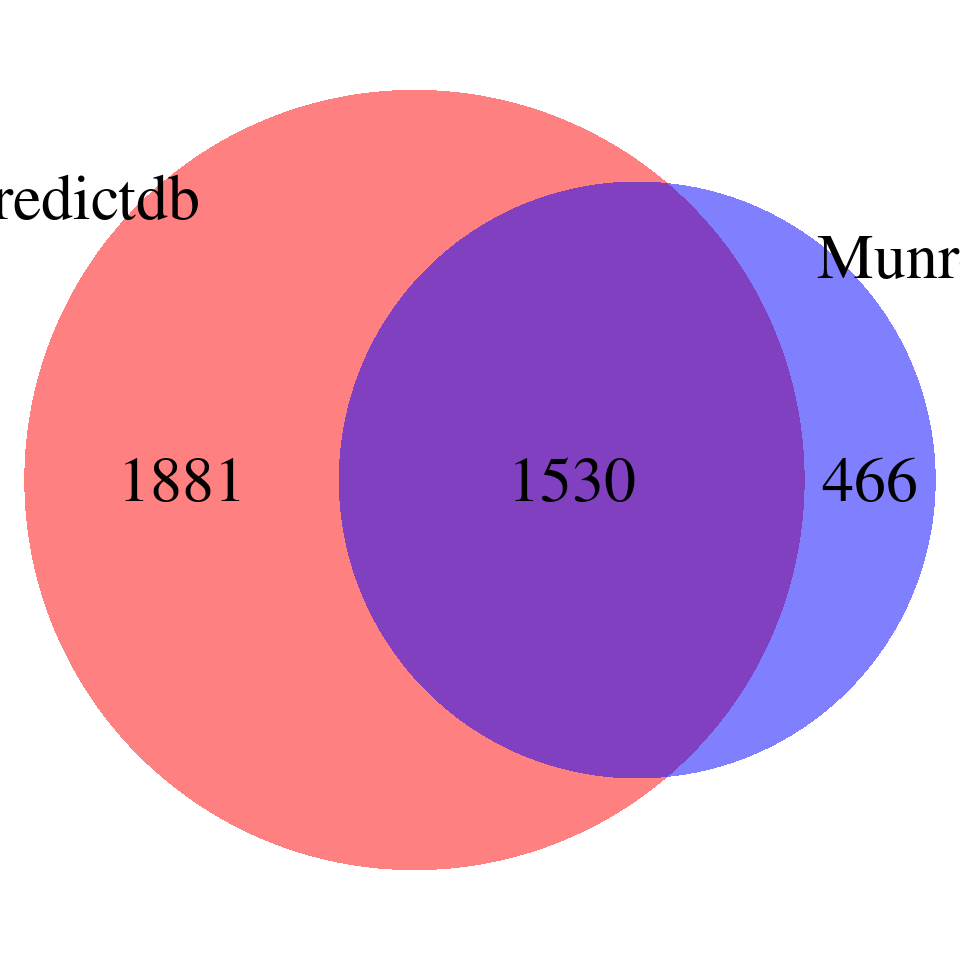
print("For the overlapping genes")[1] "For the overlapping genes"scatter_plot <- plot_scatter(overlap = overlap)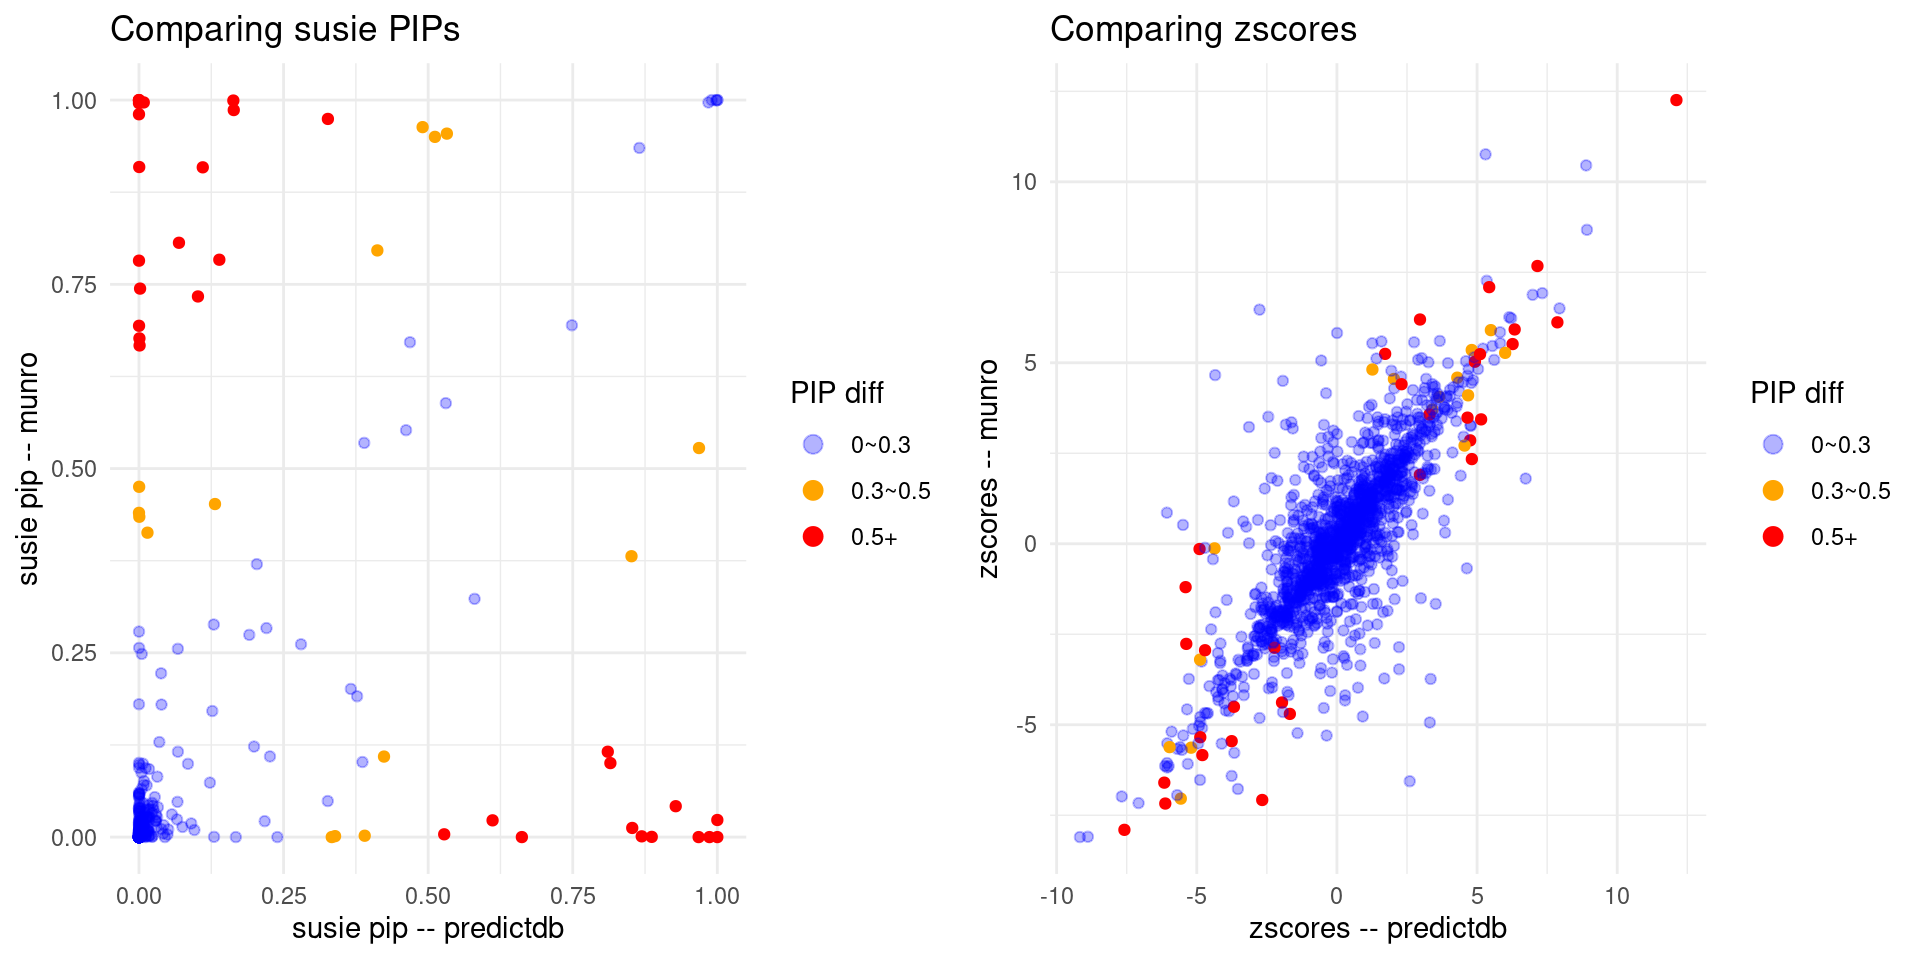
Comparing predictdb e+s VS predictdb e+s + Munro rs+apa VS all 8 weights
gwas_n <- samplesize[trait]

results_dir_espred <- paste0("/project/xinhe/xsun/multi_group_ctwas/9.deciding_weights_4traits/results/",trait,"/espred/")

snp_map_espred <- readRDS(paste0(results_dir_espred,trait,".snp_map.RDS"))
ctwas_res_espred <- readRDS(paste0(results_dir_espred,trait,".ctwas.res.RDS"))

param_espred <- ctwas_res_espred$param
finemap_res_espred <- ctwas_res_espred$finemap_res


p_conv_espred <- make_convergence_plots(param_espred, gwas_n, ncol = 1, colors = colors)
ctwas_parameters_espred <- summarize_param(param_espred, gwas_n)
pve_pie_espred <- plot_piechart(ctwas_parameters = ctwas_parameters_espred, colors = colors)

finemap_res_espred$molecular_id <- get_molecular_ids(finemap_res_espred)
finemap_res_espred <- anno_finemap_res(finemap_res_espred,
                              snp_map = snp_map_espred,
                              mapping_table = mapping_two,
                              add_gene_annot = TRUE,
                              map_by = "molecular_id",
                              drop_unmapped = TRUE,
                              add_position = TRUE,
                              use_gene_pos = "mid")
2024-10-07 15:32:46 INFO::Annotating fine-mapping result ...
2024-10-07 15:32:46 INFO::Map molecular traits to genes
2024-10-07 15:32:48 INFO::Split PIPs for molecular traits mapped to multiple genes
2024-10-07 15:32:57 INFO::Add gene positions
2024-10-07 15:32:57 INFO::Add SNP positionscombined_pip_by_type_espred <- combine_gene_pips(finemap_res =finemap_res_espred,
group_by = "gene_name",
by = "type",
method = "combine_cs",
filter_cs = T )2024-10-07 15:33:17 INFO::Limit gene results to credible setsresults_dir_4W <- paste0("/project/xinhe/xsun/multi_group_ctwas/9.deciding_weights_4traits/results/",trait,"/4W/")
snp_map_4W <- readRDS(paste0(results_dir_4W,trait,".snp_map.RDS"))
ctwas_res_4W <- readRDS(paste0(results_dir_4W,trait,".ctwas.res.RDS"))
param_4W <- ctwas_res_4W$param
finemap_res_4W <- ctwas_res_4W$finemap_res
p_conv_4W <- make_convergence_plots(param_4W, gwas_n, ncol = 1, colors = colors)
ctwas_parameters_4W <- summarize_param(param_4W, gwas_n)
pve_pie_4W <- plot_piechart(ctwas_parameters = ctwas_parameters_4W, colors = colors)
finemap_res_4W$molecular_id <- get_molecular_ids(finemap_res_4W)
finemap_res_4W <- anno_finemap_res(finemap_res_4W,
snp_map = snp_map_4W,
mapping_table = mapping_two,
add_gene_annot = TRUE,
map_by = "molecular_id",
drop_unmapped = TRUE,
add_position = TRUE,
use_gene_pos = "mid")2024-10-07 15:34:03 INFO::Annotating fine-mapping result ...
2024-10-07 15:34:03 INFO::Map molecular traits to genes
2024-10-07 15:34:04 INFO::Split PIPs for molecular traits mapped to multiple genes
2024-10-07 15:34:14 INFO::Add gene positions
2024-10-07 15:34:15 INFO::Add SNP positionscombined_pip_by_type_4W <- combine_gene_pips(finemap_res =finemap_res_4W,
group_by = "gene_name",
by = "type",
method = "combine_cs",
filter_cs = T )2024-10-07 15:34:43 INFO::Limit gene results to credible setsresults_dir_8W <- paste0("/project/xinhe/xsun/multi_group_ctwas/9.deciding_weights_4traits/results/",trait,"/8W/")
snp_map_8W <- readRDS(paste0(results_dir_8W,trait,".snp_map.RDS"))
ctwas_res_8W <- readRDS(paste0(results_dir_8W,trait,".ctwas.res.RDS"))
param_8W <- ctwas_res_8W$param
finemap_res_8W <- ctwas_res_8W$finemap_res
p_conv_8W <- make_convergence_plots(param_8W, gwas_n, ncol = 1, colors = colors)
ctwas_parameters_8W <- summarize_param(param_8W, gwas_n)
pve_pie_8W <- plot_piechart(ctwas_parameters = ctwas_parameters_8W, colors = colors)
finemap_res_8W$molecular_id <- get_molecular_ids(finemap_res_8W)
finemap_res_8W <- anno_finemap_res(finemap_res_8W,
snp_map = snp_map_8W,
mapping_table = mapping_two,
add_gene_annot = TRUE,
map_by = "molecular_id",
drop_unmapped = TRUE,
add_position = TRUE,
use_gene_pos = "mid")2024-10-07 15:35:29 INFO::Annotating fine-mapping result ...
2024-10-07 15:35:29 INFO::Map molecular traits to genes
2024-10-07 15:35:30 INFO::Split PIPs for molecular traits mapped to multiple genes
2024-10-07 15:35:42 INFO::Add gene positions
2024-10-07 15:35:46 INFO::Add SNP positionsfinemap_res_8W$type <- ifelse(grepl("_pred$", finemap_res_8W$context),
paste0(finemap_res_8W$type, "_pred"),
finemap_res_8W$type)
combined_pip_by_type_8W <- combine_gene_pips(finemap_res =finemap_res_8W,
group_by = "gene_name",
by = "type",
method = "combine_cs",
filter_cs = T )2024-10-07 15:36:15 INFO::Limit gene results to credible setsParameters
print("each row represents one setting: predictdb e+s, predictdb e+s + Munro apa+rs, all 8 weights accordingly")[1] "each row represents one setting: predictdb e+s, predictdb e+s + Munro apa+rs, all 8 weights accordingly"grid.arrange(p_conv_espred,p_conv_4W,p_conv_8W, ncol = 3)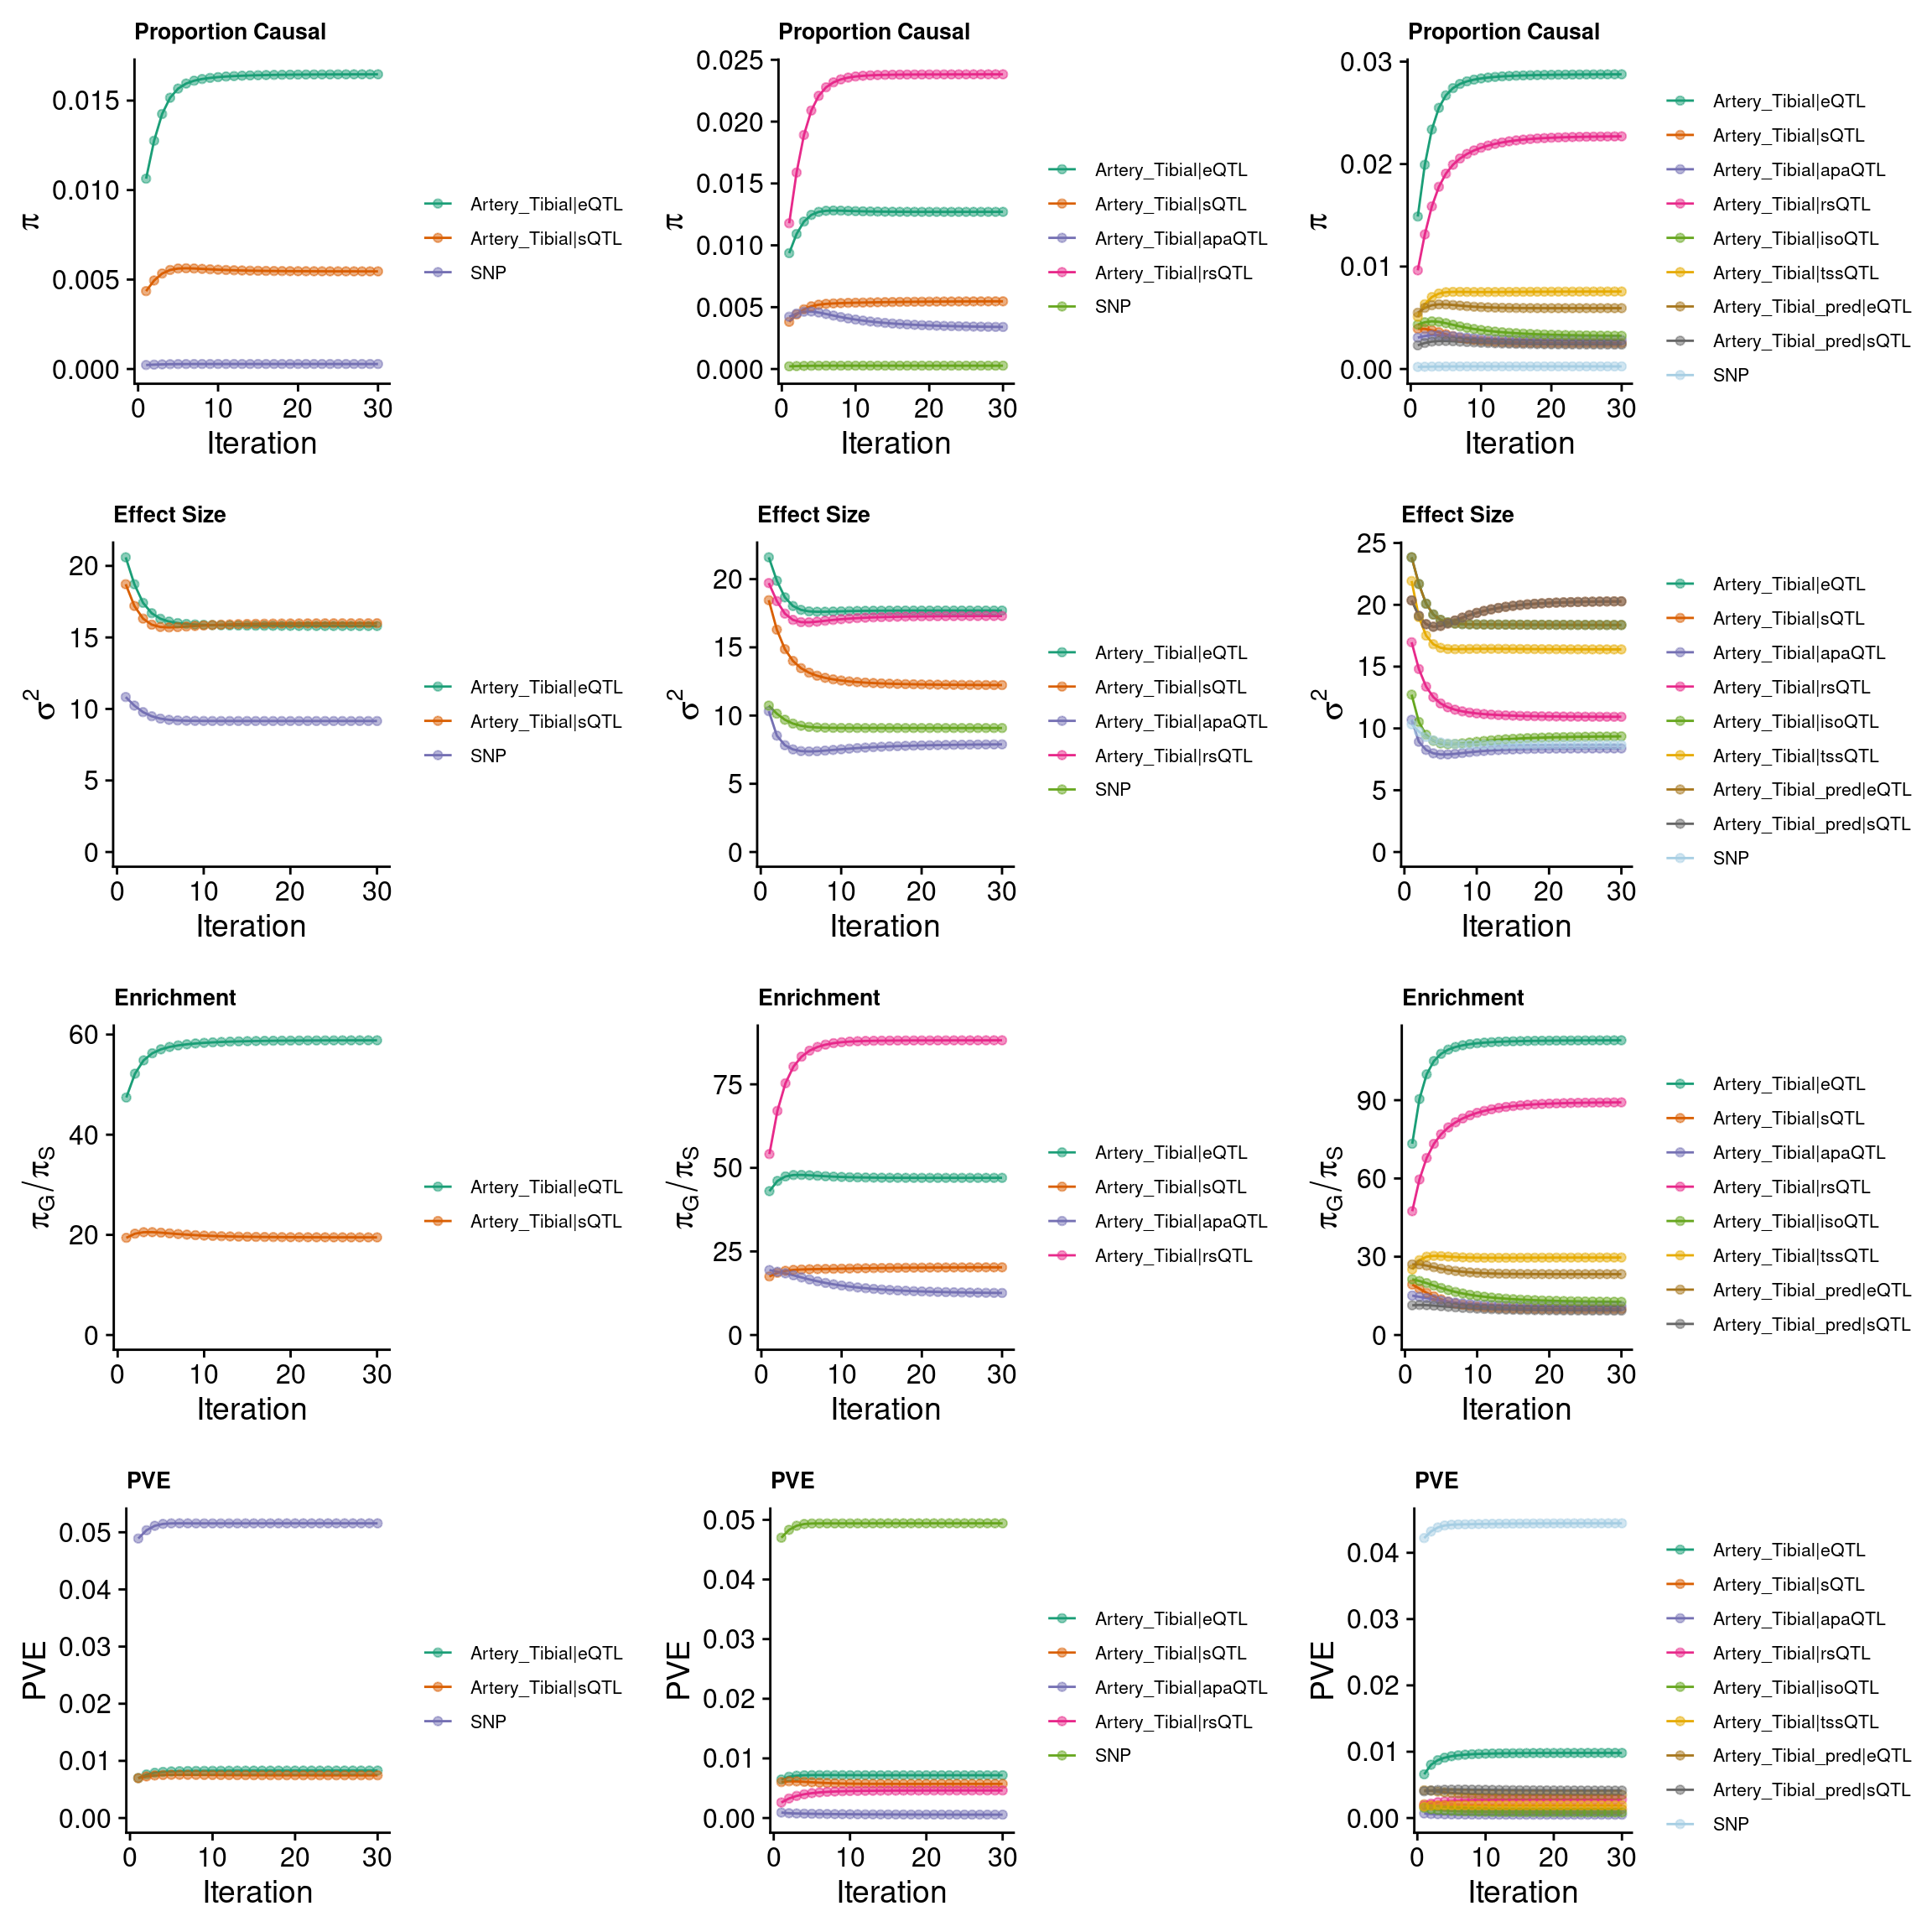
| Version | Author | Date |
|---|---|---|
| b00c776 | XSun | 2024-10-03 |
######pve
group_pve_espred <- ctwas_parameters_espred$group_pve
group_pve_espred <- group_pve_espred[-length(group_pve_espred)]
group_pve_espred <- c(group_pve_espred, rep(NA,6))
group_pve_espred <- c(group_pve_espred, ctwas_parameters_espred$total_pve)
names(group_pve_espred) <- c("eQTL_pred","sQTL_pred","apaQTL_munro","rsQTL_munro","isoQTL_munro","tssQTL_munro","eQTL_munro","sQTL_munro","TOTAL")

group_pve_4W <- ctwas_parameters_4W$group_pve
group_pve_4W <- group_pve_4W[-length(group_pve_4W)]
group_pve_4W <- c(group_pve_4W, rep(NA,4))
group_pve_4W <- c(group_pve_4W, ctwas_parameters_4W$total_pve)
names(group_pve_4W) <- c("eQTL_pred","sQTL_pred","apaQTL_munro","rsQTL_munro","isoQTL_munro","tssQTL_munro","eQTL_munro","sQTL_munro","TOTAL")

group_pve_8W <- ctwas_parameters_8W$group_pve
group_pve_8W <- group_pve_8W[-length(group_pve_8W)]
group_pve_8W <- group_pve_8W[c(paste0(tissue,"_pred|eQTL"),paste0(tissue,"_pred|sQTL"),paste0(tissue,"|apaQTL"),paste0(tissue,"|rsQTL"),paste0(tissue,"|isoQTL"),paste0(tissue,"|tssQTL"),paste0(tissue,"|eQTL"),paste0(tissue,"|sQTL"))]
group_pve_8W <- c(group_pve_8W, ctwas_parameters_8W$total_pve)
names(group_pve_8W) <- c("eQTL_pred","sQTL_pred","apaQTL_munro","rsQTL_munro","isoQTL_munro","tssQTL_munro","eQTL_munro","sQTL_munro","TOTAL")

grouppve <- cbind(group_pve_espred,group_pve_4W,group_pve_8W)
grouppve <- round(grouppve,digits = 4)

######size
group_size_espred <- ctwas_parameters_espred$group_size
group_size_espred <- group_size_espred[-length(group_size_espred)]
group_size_espred <- c(group_size_espred, rep(NA,6))
names(group_size_espred) <- c("eQTL_pred","sQTL_pred","apaQTL_munro","rsQTL_munro","isoQTL_munro","tssQTL_munro","eQTL_munro","sQTL_munro")

group_size_4W <- ctwas_parameters_4W$group_size
group_size_4W <- group_size_4W[-length(group_size_4W)]
group_size_4W <- c(group_size_4W, rep(NA,4))
names(group_size_4W) <- c("eQTL_pred","sQTL_pred","apaQTL_munro","rsQTL_munro","isoQTL_munro","tssQTL_munro","eQTL_munro","sQTL_munro")

group_size_8W <- ctwas_parameters_8W$group_size
group_size_8W <- group_size_8W[-length(group_size_8W)]
group_size_8W <- group_size_8W[c(paste0(tissue,"_pred|eQTL"),paste0(tissue,"_pred|sQTL"),paste0(tissue,"|apaQTL"),paste0(tissue,"|rsQTL"),paste0(tissue,"|isoQTL"),paste0(tissue,"|tssQTL"),paste0(tissue,"|eQTL"),paste0(tissue,"|sQTL"))]
names(group_size_8W) <- c("eQTL_pred","sQTL_pred","apaQTL_munro","rsQTL_munro","isoQTL_munro","tssQTL_munro","eQTL_munro","sQTL_munro")

groupsize <- cbind(group_size_espred,group_size_4W,group_size_8W)

group_info <- cbind(grouppve,rbind(groupsize,c(rep(NA,3))))

DT::datatable(group_info,caption = htmltools::tags$caption( style = 'caption-side: topleft; text-align = left; color:black;','Group PVE and Group Size'),options = list(pageLength = 10) )
print("each pie chart represents one setting: predictdb e+s, predictdb e+s + Munro apa+rs, all 8 weights accordingly")[1] "each pie chart represents one setting: predictdb e+s, predictdb e+s + Munro apa+rs, all 8 weights accordingly"grid.arrange(pve_pie_espred,pve_pie_4W,pve_pie_8W, ncol =3)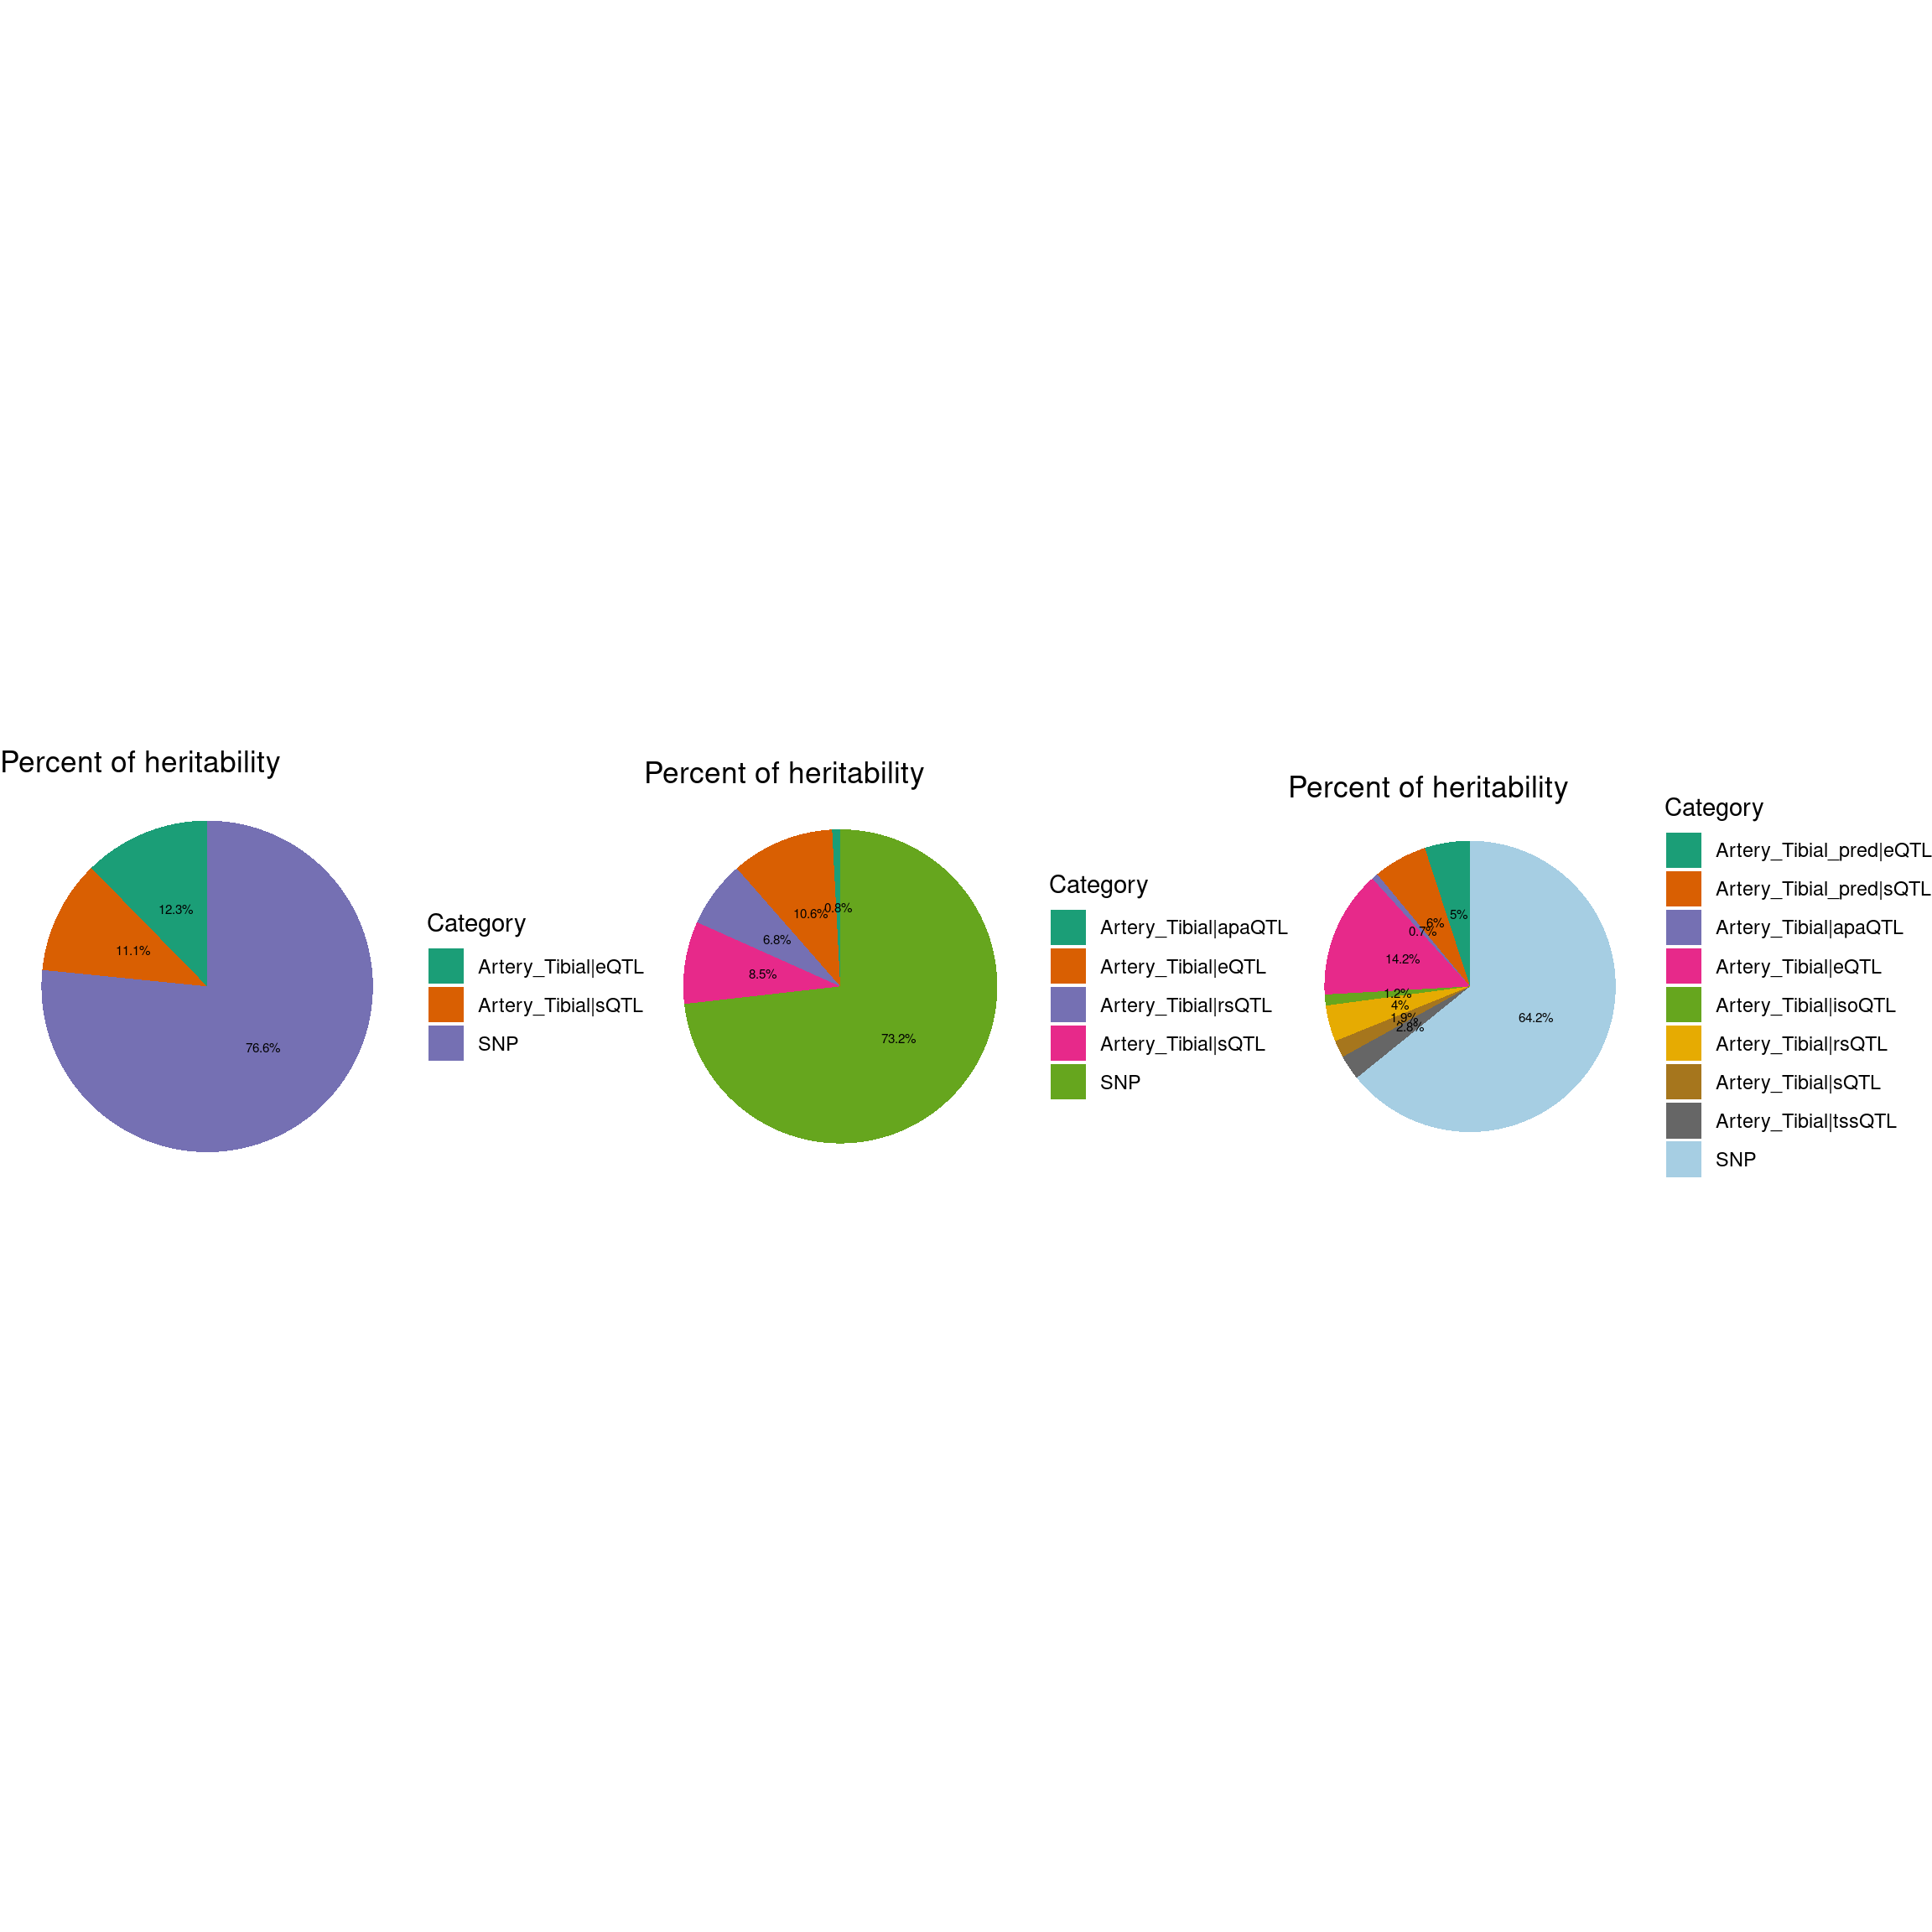
Comparing apaQTL and rsQTL
gene_apa <- unique(finemap_res_4W[finemap_res_4W$type == "apaQTL",]$gene_name)
gene_rs <- unique(finemap_res_4W[finemap_res_4W$type == "rsQTL",]$gene_name)
gene_overlap_rsapa <- intersect(gene_apa,gene_rs)
plot_venn_apars(gene_apa = gene_apa,gene_rs = gene_rs,gene_overlap = gene_overlap_rsapa)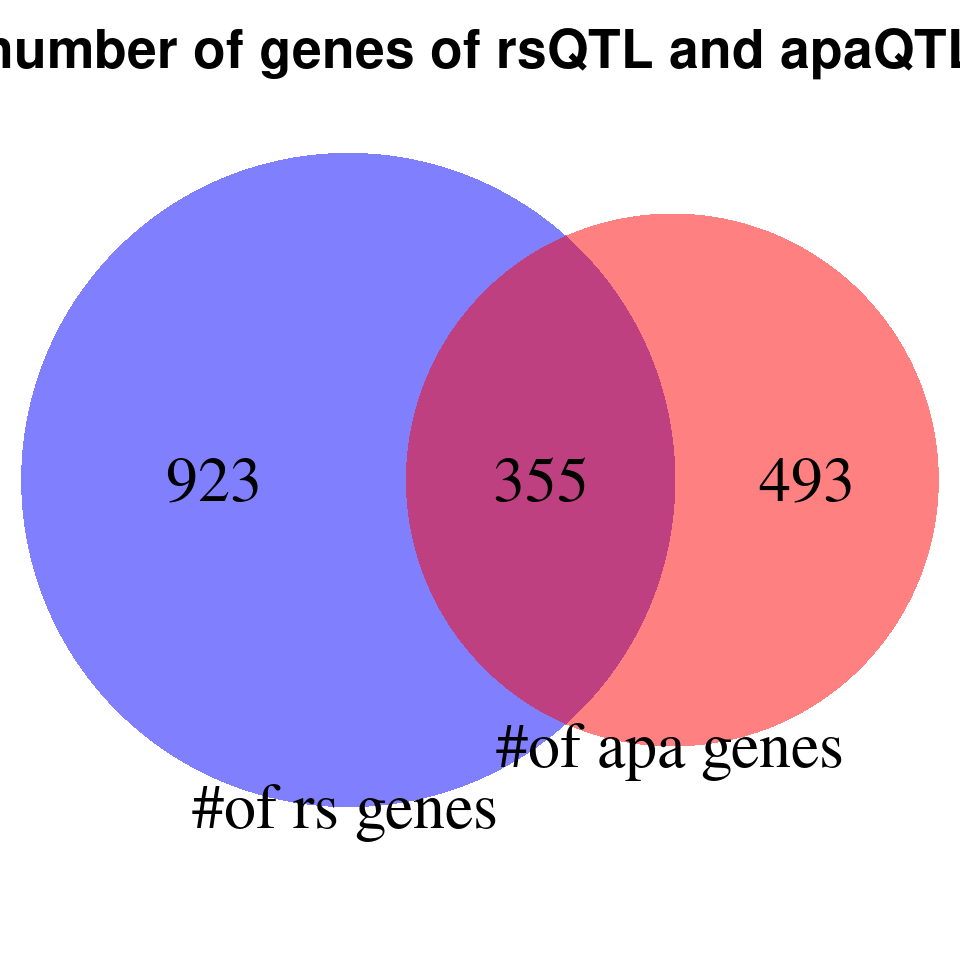
rs_apa_overlap_merged <- process_data_rsapa(finemap_res = finemap_res_4W)
plot_scatter_rsapa(rs_apa_overlap_merged = rs_apa_overlap_merged)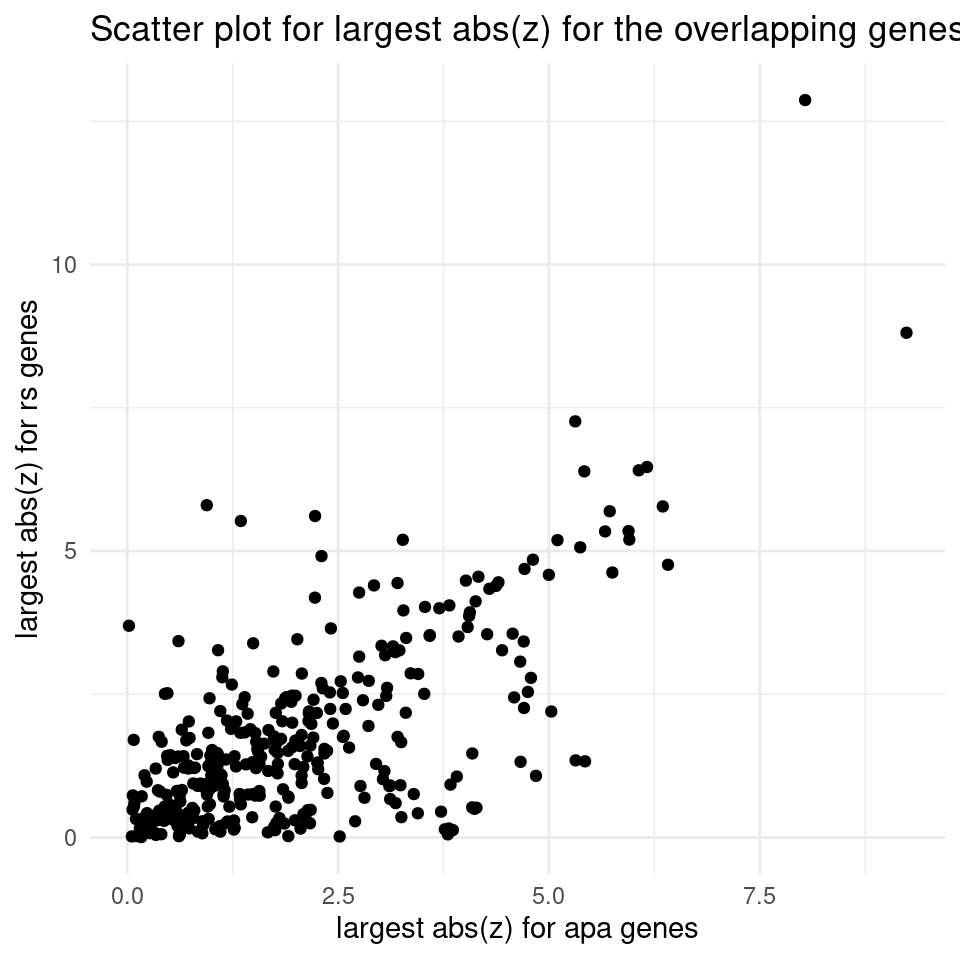
| Version | Author | Date |
|---|---|---|
| b00c776 | XSun | 2024-10-03 |
Fine-mapping results
combined_sig_espred <- combined_pip_by_type_espred[combined_pip_by_type_espred$combined_pip > 0.8,]
combined_sig_4W <- combined_pip_by_type_4W[combined_pip_by_type_4W$combined_pip > 0.8,]
combined_sig_8W <- combined_pip_by_type_8W[combined_pip_by_type_8W$combined_pip > 0.8,]

sprintf("# of genes with PIP > 0.8 = %s -- predictdb e +s", nrow(combined_sig_espred))
[1] "# of genes with PIP > 0.8 = 38 -- predictdb e +s"sprintf("# of genes with PIP > 0.8 = %s -- predictdb e + s + Munro apa + rs", nrow(combined_sig_4W))[1] "# of genes with PIP > 0.8 = 46 -- predictdb e + s + Munro apa + rs"sprintf("# of genes with PIP > 0.8 = %s -- all 8 weights", nrow(combined_sig_8W))[1] "# of genes with PIP > 0.8 = 70 -- all 8 weights"# DT::datatable(combined_sig_espred,caption = htmltools::tags$caption( style = 'caption-side: topleft; text-align = left; color:black;','High PIP genes -- predictdb e+s'),options = list(pageLength = 10) )
# DT::datatable(combined_sig_4W,caption = htmltools::tags$caption( style = 'caption-side: topleft; text-align = left; color:black;','High PIP genes -- predictdb e+s + Munro apa + rs'),options = list(pageLength = 10) )
# DT::datatable(combined_sig_8W,caption = htmltools::tags$caption( style = 'caption-side: topleft; text-align = left; color:black;','High PIP genes -- all 8 weights'),options = list(pageLength = 10) )
venn.plot <- plot_3venn(es = combined_sig_espred$gene_name,esra = combined_sig_4W$gene_name,all8 = combined_sig_8W$gene_name)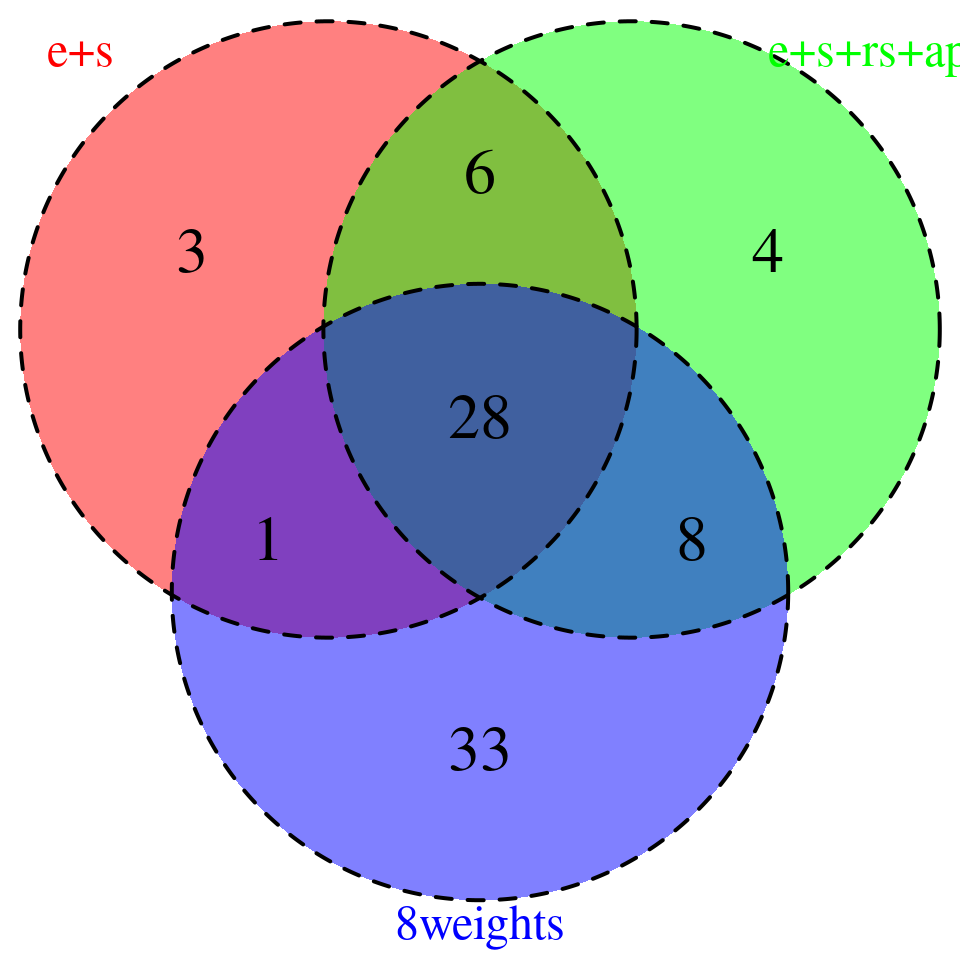
###1
heatmap_data <- combined_sig_8W[!combined_sig_8W$gene_name %in%combined_sig_espred$gene_name, ]
column_order <- c("gene_name","combined_pip",
                  "eQTL_pred_pip", "sQTL_pred_pip", "rsQTL_pip","apaQTL_pip",
                  "isoQTL_pip", "eQTL_pip","tssQTL_pip","sQTL_pip")
heatmap_data <- rename_heatmap_columns(heatmap_data = heatmap_data, column_order = column_order)
p1 <- plot_heatmap(heatmap_data = heatmap_data,main = "PIP partition for the genes reported by 8weight setting but not by e+s setting")

###2
heatmap_data <- combined_sig_4W[!combined_sig_4W$gene_name %in%combined_sig_espred$gene_name, ]
column_order <- c("gene_name","combined_pip",
                  "eQTL_pip", "sQTL_pip", "rsQTL_pip","apaQTL_pip")
heatmap_data <- rename_heatmap_columns(heatmap_data = heatmap_data, column_order = column_order)
p2 <- plot_heatmap(heatmap_data = heatmap_data,main = "PIP partition for the genes reported by 4weight setting but not by e+s setting")

###3
heatmap_data <- combined_sig_8W[!combined_sig_8W$gene_name %in%combined_sig_4W$gene_name, ]
column_order <- c("gene_name","combined_pip",
                  "eQTL_pred_pip", "sQTL_pred_pip", "rsQTL_pip","apaQTL_pip",
                  "isoQTL_pip", "eQTL_pip","tssQTL_pip","sQTL_pip")
heatmap_data <- rename_heatmap_columns(heatmap_data = heatmap_data, column_order = column_order)


p3 <- plot_heatmap(heatmap_data = heatmap_data,main = "PIP partition for the genes reported by 8weight setting but not by 4weight setting")

g1 <- p1$gtable
g2 <- p2$gtable
g3 <- p3$gtable
grid.arrange(g1, g2, g3, ncol=3)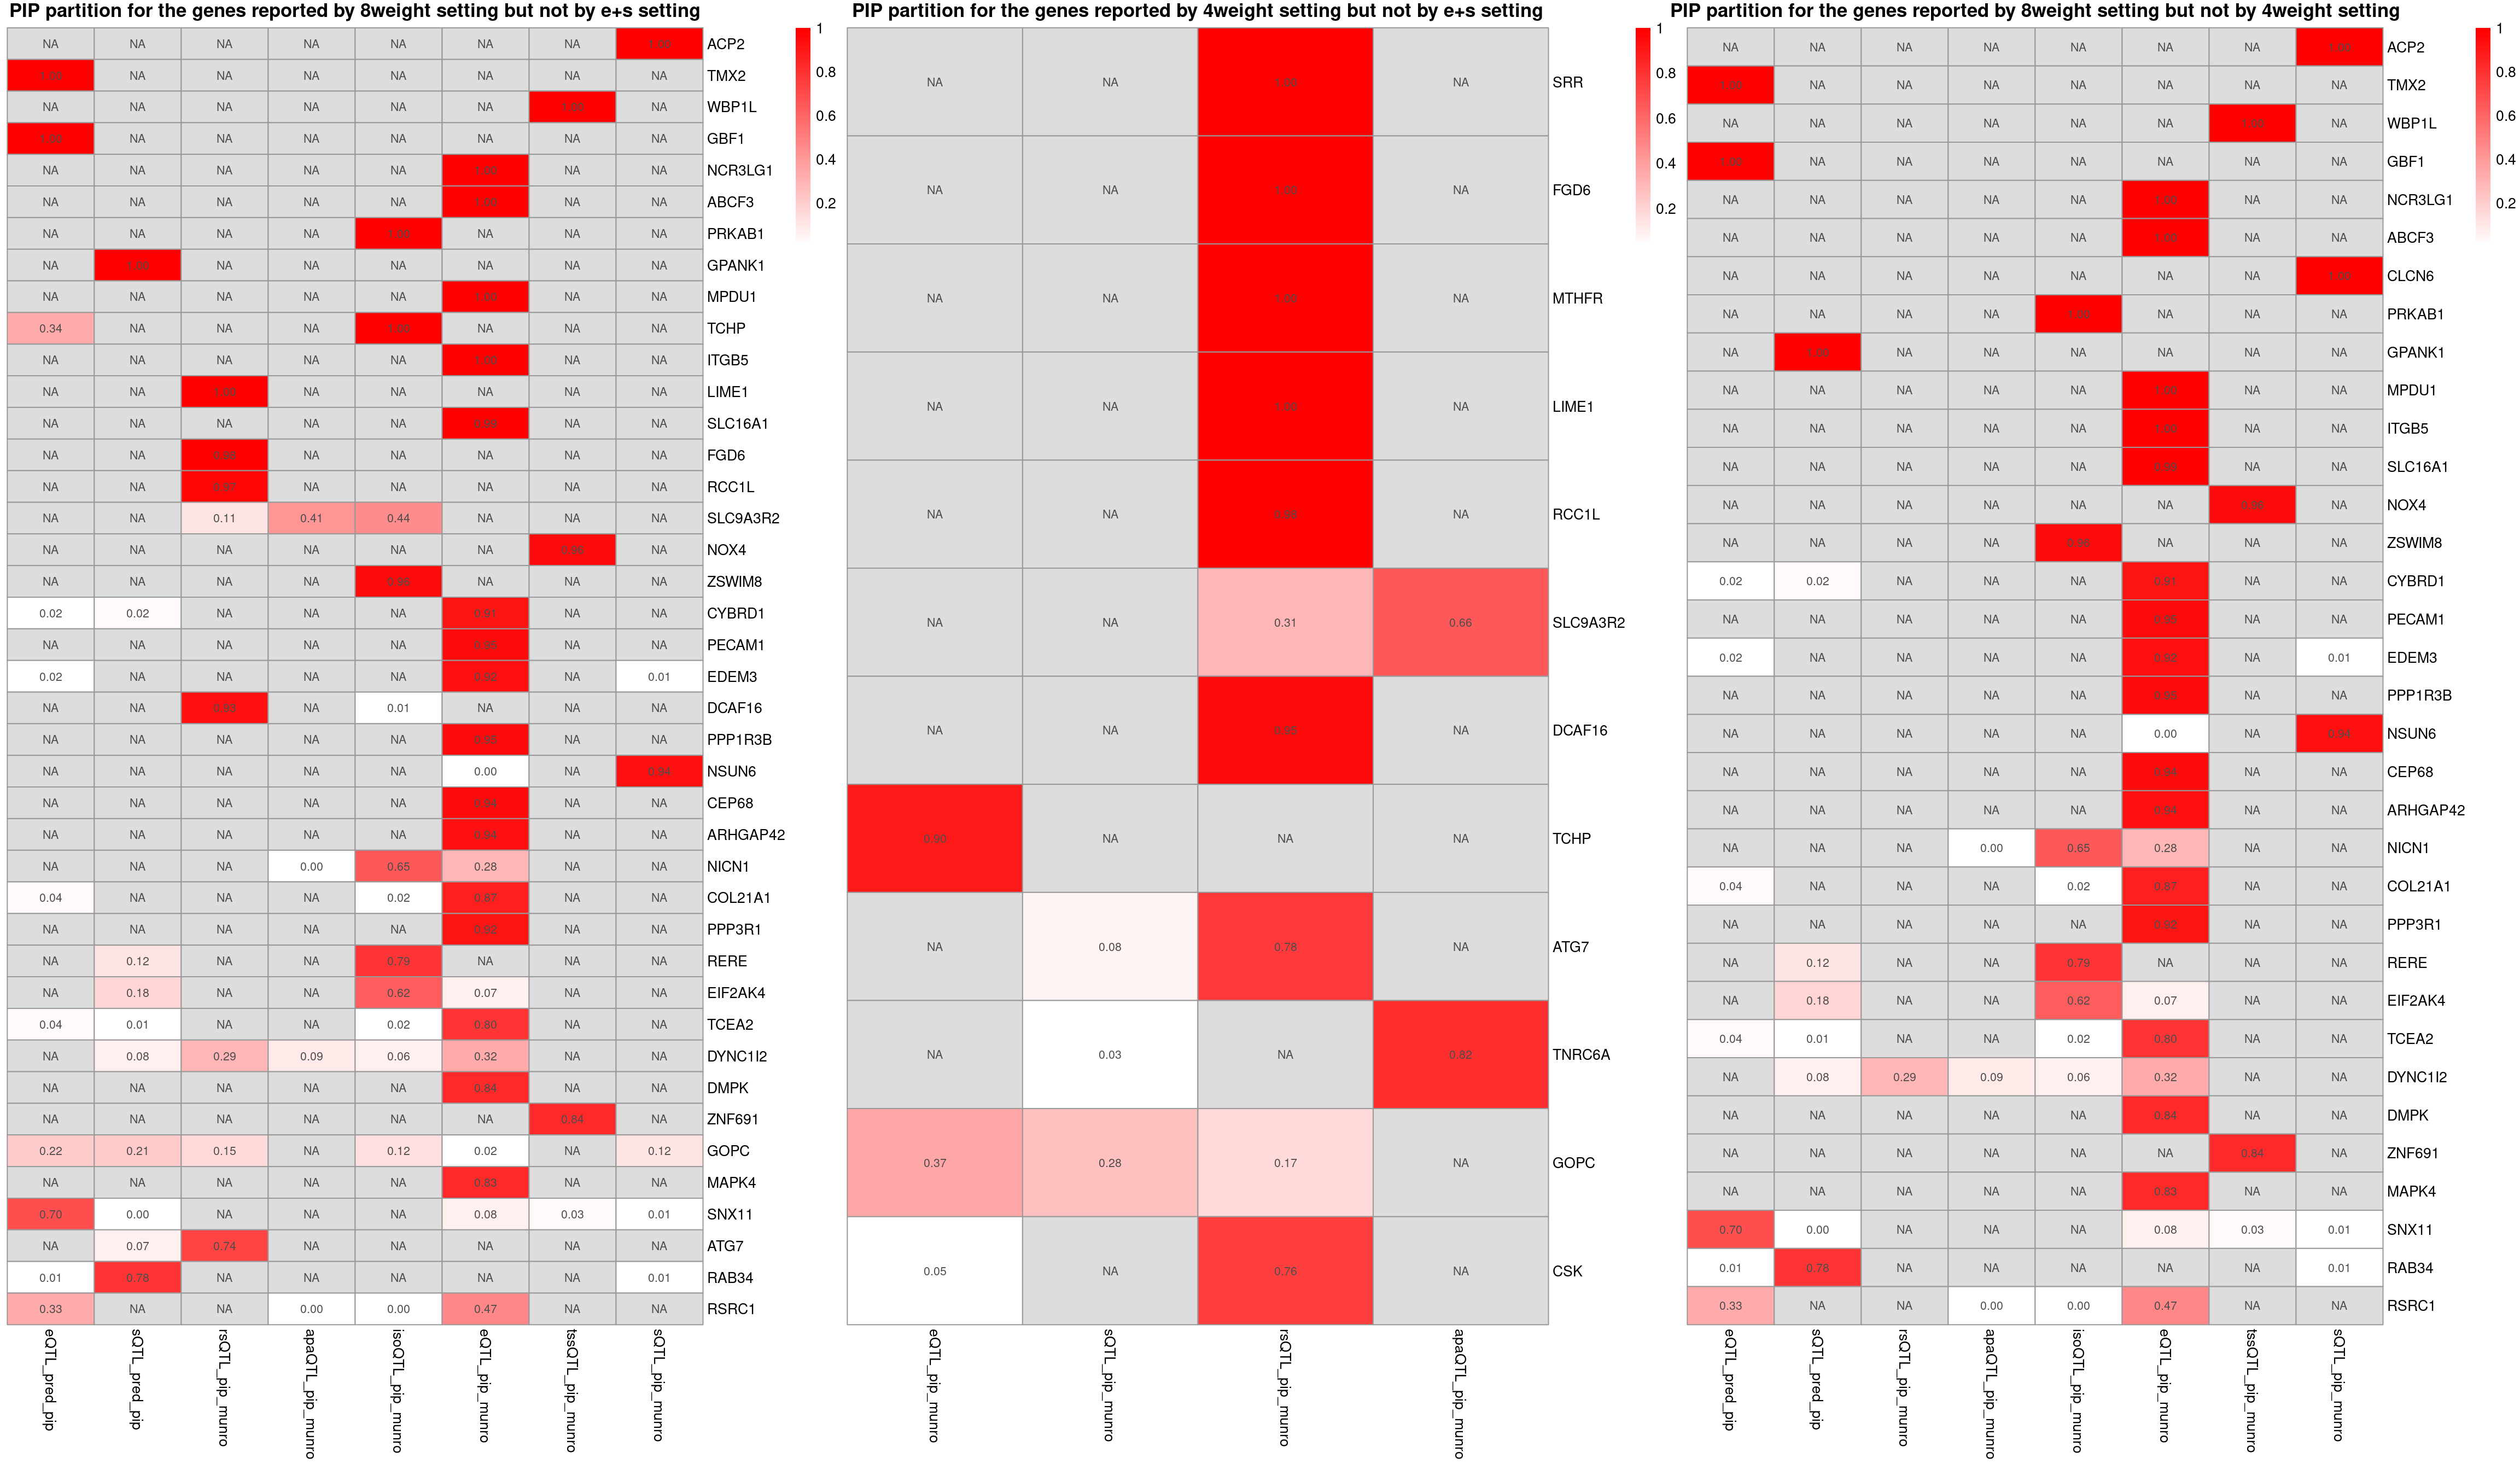
WBC-ieu-b-30
Comparing predictdb eQTL VS munro eQTL
trait <- "WBC-ieu-b-30"
tissue <- "Whole_Blood"
### predictdb
results_dir_epred <- paste0("/project/xinhe/xsun/multi_group_ctwas/9.deciding_weights_4traits/results/",trait,"/epred/")

ctwas_res_epred <- readRDS(paste0(results_dir_epred,trait,".ctwas.res.RDS"))
snp_map_epred  <- readRDS(paste0(results_dir_epred,trait,".snp_map.RDS"))
finemap_res_epred <- ctwas_res_epred$finemap_res
finemap_res_epred$molecular_id <- get_molecular_ids(finemap_res_epred)

finemap_res_epred <- anno_finemap_res(finemap_res_epred,
                              snp_map = snp_map_epred,
                              mapping_table = mapping_predictdb,
                              add_gene_annot = TRUE,
                              map_by = "molecular_id",
                              drop_unmapped = TRUE,
                              add_position = TRUE,
                              use_gene_pos = "mid")
2024-10-07 15:37:29 INFO::Annotating fine-mapping result ...
2024-10-07 15:37:29 INFO::Map molecular traits to genes
2024-10-07 15:37:46 INFO::Add gene positions
2024-10-07 15:37:46 INFO::Add SNP positionsfinemap_res_gene_epred <- finemap_res_epred[finemap_res_epred$type !="SNP",]
### munro
results_dir_emunro <- paste0("/project/xinhe/xsun/multi_group_ctwas/9.deciding_weights_4traits/results/",trait,"/emunro/")
ctwas_res_emunro <- readRDS(paste0(results_dir_emunro,trait,".ctwas.res.RDS"))
snp_map_emunro <- readRDS(paste0(results_dir_emunro,trait,".snp_map.RDS"))
finemap_res_emunro <- ctwas_res_emunro$finemap_res
finemap_res_emunro$molecular_id <- get_molecular_ids(finemap_res_emunro)
finemap_res_emunro <- anno_finemap_res(finemap_res_emunro,
snp_map = snp_map_emunro,
mapping_table = mapping_munro,
add_gene_annot = TRUE,
map_by = "molecular_id",
drop_unmapped = TRUE,
add_position = TRUE,
use_gene_pos = "mid")2024-10-07 15:39:18 INFO::Annotating fine-mapping result ...
2024-10-07 15:39:18 INFO::Map molecular traits to genes
2024-10-07 15:39:35 INFO::Add gene positions
2024-10-07 15:39:35 INFO::Add SNP positionsfinemap_res_gene_emunro <- finemap_res_emunro[finemap_res_emunro$type !="SNP",]
overlap <- merge(finemap_res_gene_epred, finemap_res_gene_emunro, by = "gene_name")
overlap <- overlap[,c("gene_name","type.x","context.x","region_id.x","z.x","susie_pip.x","z.y","susie_pip.y")]
colnames(overlap) <- c("gene_name","type","context","region_id","z_predictdb","susie_pip_predictdb","z_munro","susie_pip_munro")
DT::datatable(overlap,caption = htmltools::tags$caption( style = 'caption-side: topleft; text-align = left; color:black;','overlapping genes'),options = list(pageLength = 10) )venn <- plot_venn(npred = nrow(finemap_res_gene_epred), nmunro = nrow(finemap_res_gene_emunro), noverlap = nrow(overlap))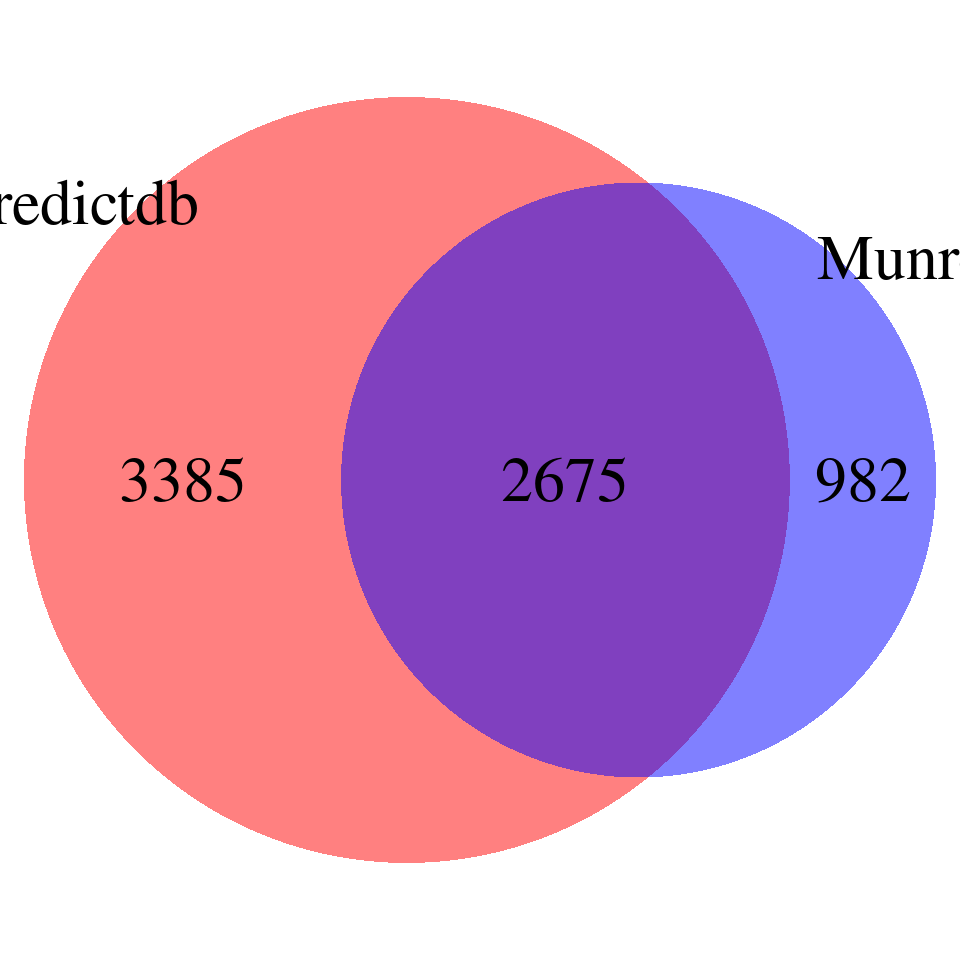
print("For the overlapping genes")[1] "For the overlapping genes"scatter_plot <- plot_scatter(overlap = overlap)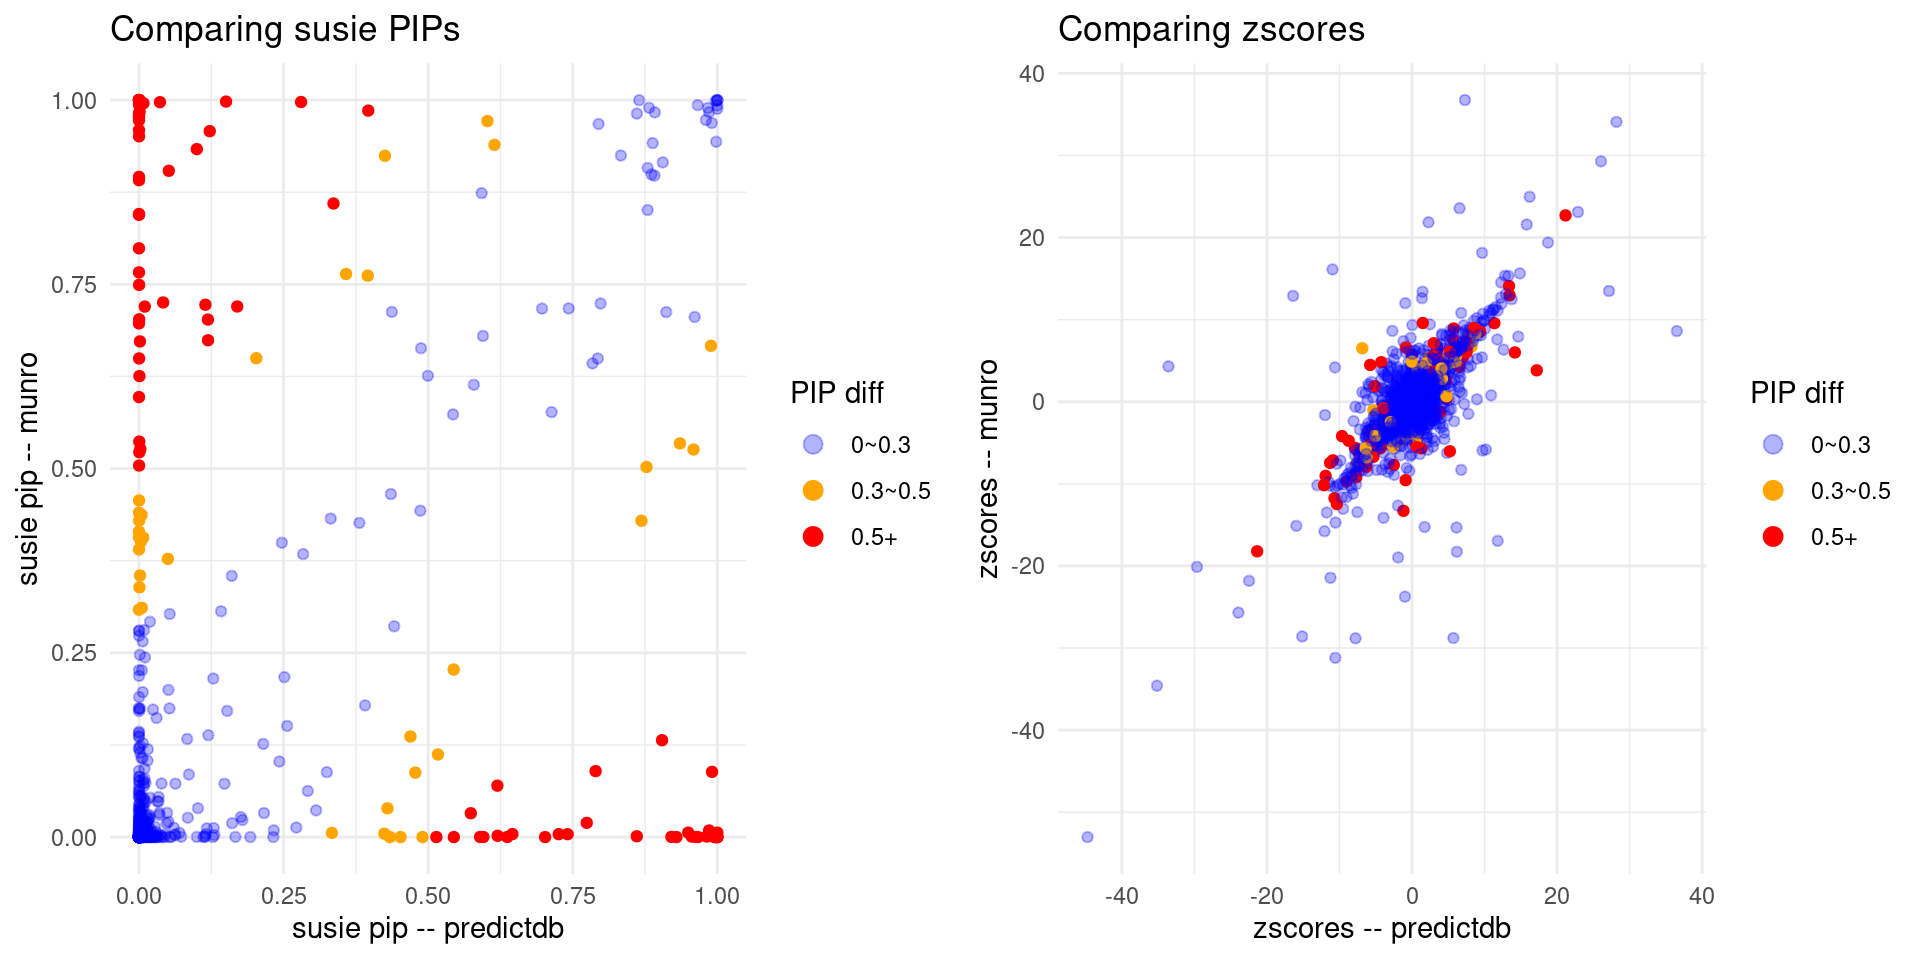
Comparing predictdb e+s VS predictdb e+s + Munro rs+apa VS all 8 weights
gwas_n <- samplesize[trait]

results_dir_espred <- paste0("/project/xinhe/xsun/multi_group_ctwas/9.deciding_weights_4traits/results/",trait,"/espred/")

snp_map_espred <- readRDS(paste0(results_dir_espred,trait,".snp_map.RDS"))
ctwas_res_espred <- readRDS(paste0(results_dir_espred,trait,".ctwas.res.RDS"))

param_espred <- ctwas_res_espred$param
finemap_res_espred <- ctwas_res_espred$finemap_res


p_conv_espred <- make_convergence_plots(param_espred, gwas_n, ncol = 1, colors = colors)
ctwas_parameters_espred <- summarize_param(param_espred, gwas_n)
pve_pie_espred <- plot_piechart(ctwas_parameters = ctwas_parameters_espred, colors = colors)

finemap_res_espred$molecular_id <- get_molecular_ids(finemap_res_espred)
finemap_res_espred <- anno_finemap_res(finemap_res_espred,
                              snp_map = snp_map_espred,
                              mapping_table = mapping_two,
                              add_gene_annot = TRUE,
                              map_by = "molecular_id",
                              drop_unmapped = TRUE,
                              add_position = TRUE,
                              use_gene_pos = "mid")
2024-10-07 15:41:05 INFO::Annotating fine-mapping result ...
2024-10-07 15:41:05 INFO::Map molecular traits to genes
2024-10-07 15:41:07 INFO::Split PIPs for molecular traits mapped to multiple genes
2024-10-07 15:41:26 INFO::Add gene positions
2024-10-07 15:41:27 INFO::Add SNP positionscombined_pip_by_type_espred <- combine_gene_pips(finemap_res =finemap_res_espred,
group_by = "gene_name",
by = "type",
method = "combine_cs",
filter_cs = T )2024-10-07 15:41:49 INFO::Limit gene results to credible setsresults_dir_4W <- paste0("/project/xinhe/xsun/multi_group_ctwas/9.deciding_weights_4traits/results/",trait,"/4W/")
snp_map_4W <- readRDS(paste0(results_dir_4W,trait,".snp_map.RDS"))
ctwas_res_4W <- readRDS(paste0(results_dir_4W,trait,".ctwas.res.RDS"))
param_4W <- ctwas_res_4W$param
finemap_res_4W <- ctwas_res_4W$finemap_res
p_conv_4W <- make_convergence_plots(param_4W, gwas_n, ncol = 1, colors = colors)
ctwas_parameters_4W <- summarize_param(param_4W, gwas_n)
pve_pie_4W <- plot_piechart(ctwas_parameters = ctwas_parameters_4W, colors = colors)
finemap_res_4W$molecular_id <- get_molecular_ids(finemap_res_4W)
finemap_res_4W <- anno_finemap_res(finemap_res_4W,
snp_map = snp_map_4W,
mapping_table = mapping_two,
add_gene_annot = TRUE,
map_by = "molecular_id",
drop_unmapped = TRUE,
add_position = TRUE,
use_gene_pos = "mid")2024-10-07 15:42:59 INFO::Annotating fine-mapping result ...
2024-10-07 15:42:59 INFO::Map molecular traits to genes
2024-10-07 15:43:00 INFO::Split PIPs for molecular traits mapped to multiple genes
2024-10-07 15:43:17 INFO::Add gene positions
2024-10-07 15:43:18 INFO::Add SNP positionscombined_pip_by_type_4W <- combine_gene_pips(finemap_res =finemap_res_4W,
group_by = "gene_name",
by = "type",
method = "combine_cs",
filter_cs = T )2024-10-07 15:43:38 INFO::Limit gene results to credible setsresults_dir_8W <- paste0("/project/xinhe/xsun/multi_group_ctwas/9.deciding_weights_4traits/results/",trait,"/8W/")
snp_map_8W <- readRDS(paste0(results_dir_8W,trait,".snp_map.RDS"))
ctwas_res_8W <- readRDS(paste0(results_dir_8W,trait,".ctwas.res.RDS"))
param_8W <- ctwas_res_8W$param
finemap_res_8W <- ctwas_res_8W$finemap_res
p_conv_8W <- make_convergence_plots(param_8W, gwas_n, ncol = 1, colors = colors)
ctwas_parameters_8W <- summarize_param(param_8W, gwas_n)
pve_pie_8W <- plot_piechart(ctwas_parameters = ctwas_parameters_8W, colors = colors)
finemap_res_8W$molecular_id <- get_molecular_ids(finemap_res_8W)
finemap_res_8W <- anno_finemap_res(finemap_res_8W,
snp_map = snp_map_8W,
mapping_table = mapping_two,
add_gene_annot = TRUE,
map_by = "molecular_id",
drop_unmapped = TRUE,
add_position = TRUE,
use_gene_pos = "mid")2024-10-07 15:44:37 INFO::Annotating fine-mapping result ...
2024-10-07 15:44:37 INFO::Map molecular traits to genes
2024-10-07 15:44:38 INFO::Split PIPs for molecular traits mapped to multiple genes
2024-10-07 15:45:03 INFO::Add gene positions
2024-10-07 15:45:04 INFO::Add SNP positionsfinemap_res_8W$type <- ifelse(grepl("_pred$", finemap_res_8W$context),
paste0(finemap_res_8W$type, "_pred"),
finemap_res_8W$type)
combined_pip_by_type_8W <- combine_gene_pips(finemap_res =finemap_res_8W,
group_by = "gene_name",
by = "type",
method = "combine_cs",
filter_cs = T )2024-10-07 15:45:30 INFO::Limit gene results to credible setsParameters
print("each row represents one setting: predictdb e+s, predictdb e+s + Munro apa+rs, all 8 weights accordingly")[1] "each row represents one setting: predictdb e+s, predictdb e+s + Munro apa+rs, all 8 weights accordingly"grid.arrange(p_conv_espred,p_conv_4W,p_conv_8W, ncol = 3)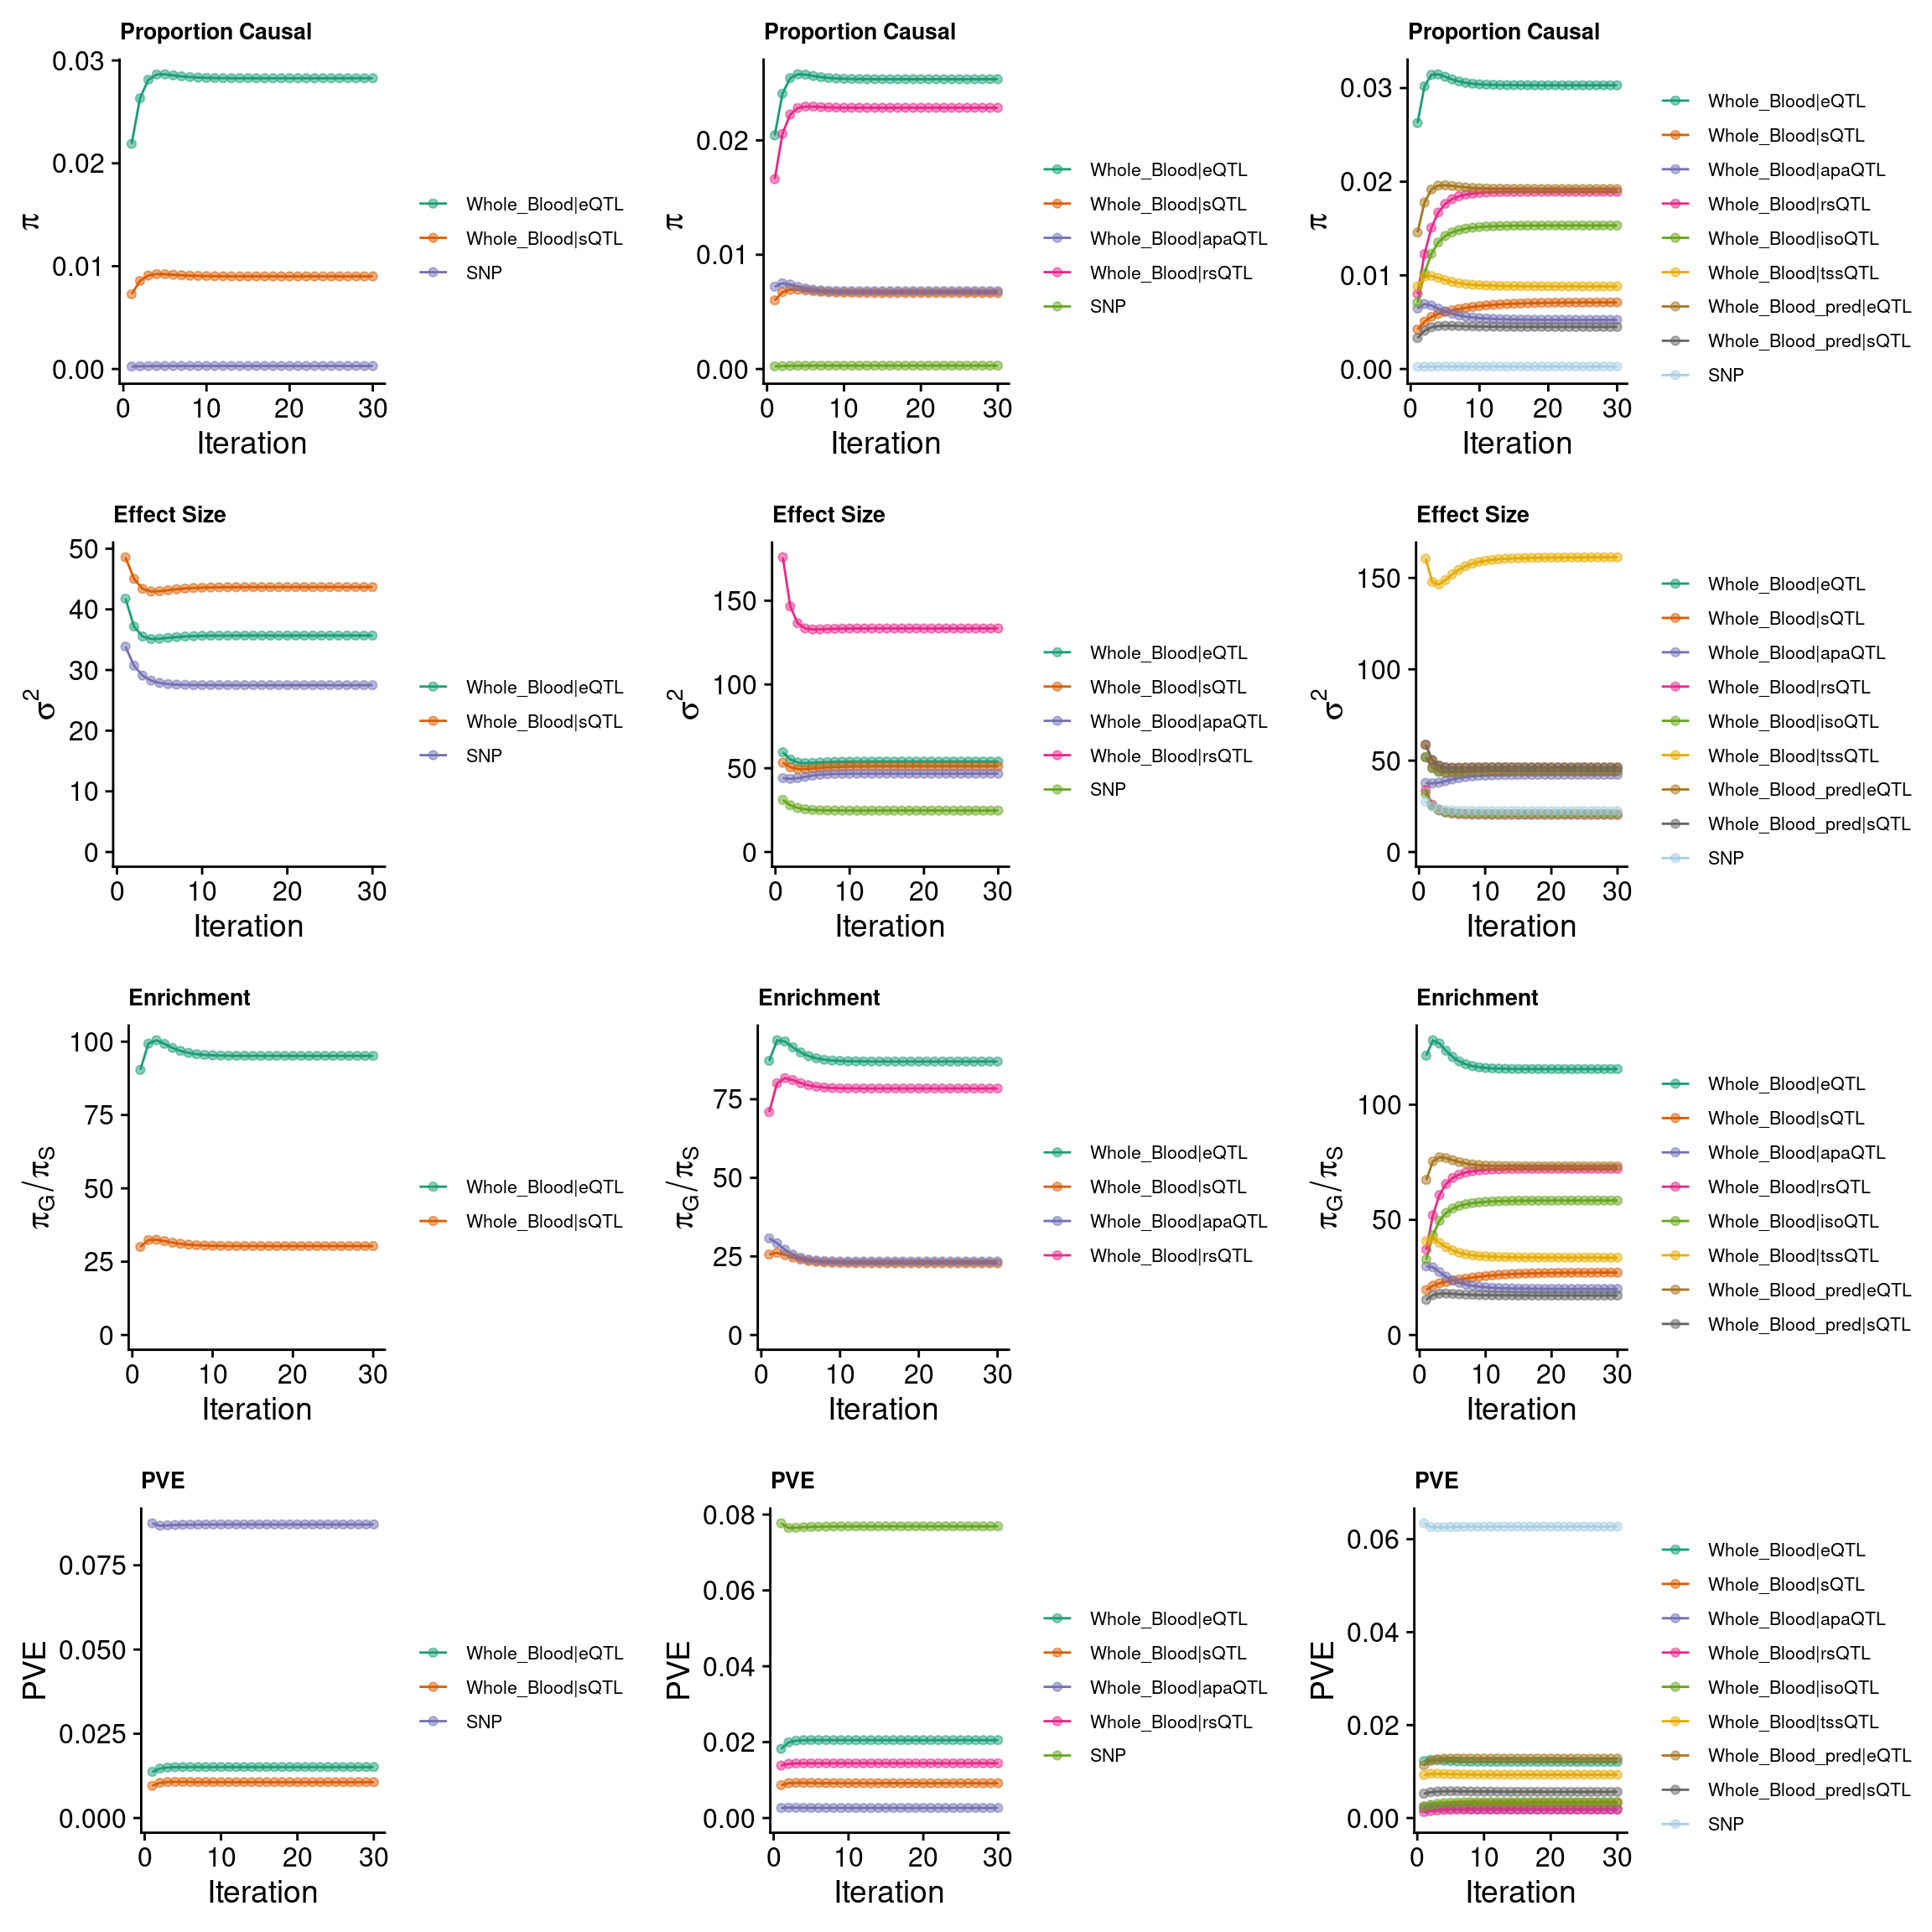
######pve
group_pve_espred <- ctwas_parameters_espred$group_pve
group_pve_espred <- group_pve_espred[-length(group_pve_espred)]
group_pve_espred <- c(group_pve_espred, rep(NA,6))
group_pve_espred <- c(group_pve_espred, ctwas_parameters_espred$total_pve)
names(group_pve_espred) <- c("eQTL_pred","sQTL_pred","apaQTL_munro","rsQTL_munro","isoQTL_munro","tssQTL_munro","eQTL_munro","sQTL_munro","TOTAL")

group_pve_4W <- ctwas_parameters_4W$group_pve
group_pve_4W <- group_pve_4W[-length(group_pve_4W)]
group_pve_4W <- c(group_pve_4W, rep(NA,4))
group_pve_4W <- c(group_pve_4W, ctwas_parameters_4W$total_pve)
names(group_pve_4W) <- c("eQTL_pred","sQTL_pred","apaQTL_munro","rsQTL_munro","isoQTL_munro","tssQTL_munro","eQTL_munro","sQTL_munro","TOTAL")

group_pve_8W <- ctwas_parameters_8W$group_pve
group_pve_8W <- group_pve_8W[-length(group_pve_8W)]
group_pve_8W <- group_pve_8W[c(paste0(tissue,"_pred|eQTL"),paste0(tissue,"_pred|sQTL"),paste0(tissue,"|apaQTL"),paste0(tissue,"|rsQTL"),paste0(tissue,"|isoQTL"),paste0(tissue,"|tssQTL"),paste0(tissue,"|eQTL"),paste0(tissue,"|sQTL"))]
group_pve_8W <- c(group_pve_8W, ctwas_parameters_8W$total_pve)
names(group_pve_8W) <- c("eQTL_pred","sQTL_pred","apaQTL_munro","rsQTL_munro","isoQTL_munro","tssQTL_munro","eQTL_munro","sQTL_munro","TOTAL")

grouppve <- cbind(group_pve_espred,group_pve_4W,group_pve_8W)
grouppve <- round(grouppve,digits = 4)

######size
group_size_espred <- ctwas_parameters_espred$group_size
group_size_espred <- group_size_espred[-length(group_size_espred)]
group_size_espred <- c(group_size_espred, rep(NA,6))
names(group_size_espred) <- c("eQTL_pred","sQTL_pred","apaQTL_munro","rsQTL_munro","isoQTL_munro","tssQTL_munro","eQTL_munro","sQTL_munro")

group_size_4W <- ctwas_parameters_4W$group_size
group_size_4W <- group_size_4W[-length(group_size_4W)]
group_size_4W <- c(group_size_4W, rep(NA,4))
names(group_size_4W) <- c("eQTL_pred","sQTL_pred","apaQTL_munro","rsQTL_munro","isoQTL_munro","tssQTL_munro","eQTL_munro","sQTL_munro")

group_size_8W <- ctwas_parameters_8W$group_size
group_size_8W <- group_size_8W[-length(group_size_8W)]
group_size_8W <- group_size_8W[c(paste0(tissue,"_pred|eQTL"),paste0(tissue,"_pred|sQTL"),paste0(tissue,"|apaQTL"),paste0(tissue,"|rsQTL"),paste0(tissue,"|isoQTL"),paste0(tissue,"|tssQTL"),paste0(tissue,"|eQTL"),paste0(tissue,"|sQTL"))]
names(group_size_8W) <- c("eQTL_pred","sQTL_pred","apaQTL_munro","rsQTL_munro","isoQTL_munro","tssQTL_munro","eQTL_munro","sQTL_munro")

groupsize <- cbind(group_size_espred,group_size_4W,group_size_8W)

group_info <- cbind(grouppve,rbind(groupsize,c(rep(NA,3))))

DT::datatable(group_info,caption = htmltools::tags$caption( style = 'caption-side: topleft; text-align = left; color:black;','Group PVE and Group Size'),options = list(pageLength = 10) )
print("each pie chart represents one setting: predictdb e+s, predictdb e+s + Munro apa+rs, all 8 weights accordingly")[1] "each pie chart represents one setting: predictdb e+s, predictdb e+s + Munro apa+rs, all 8 weights accordingly"grid.arrange(pve_pie_espred,pve_pie_4W,pve_pie_8W, ncol =3)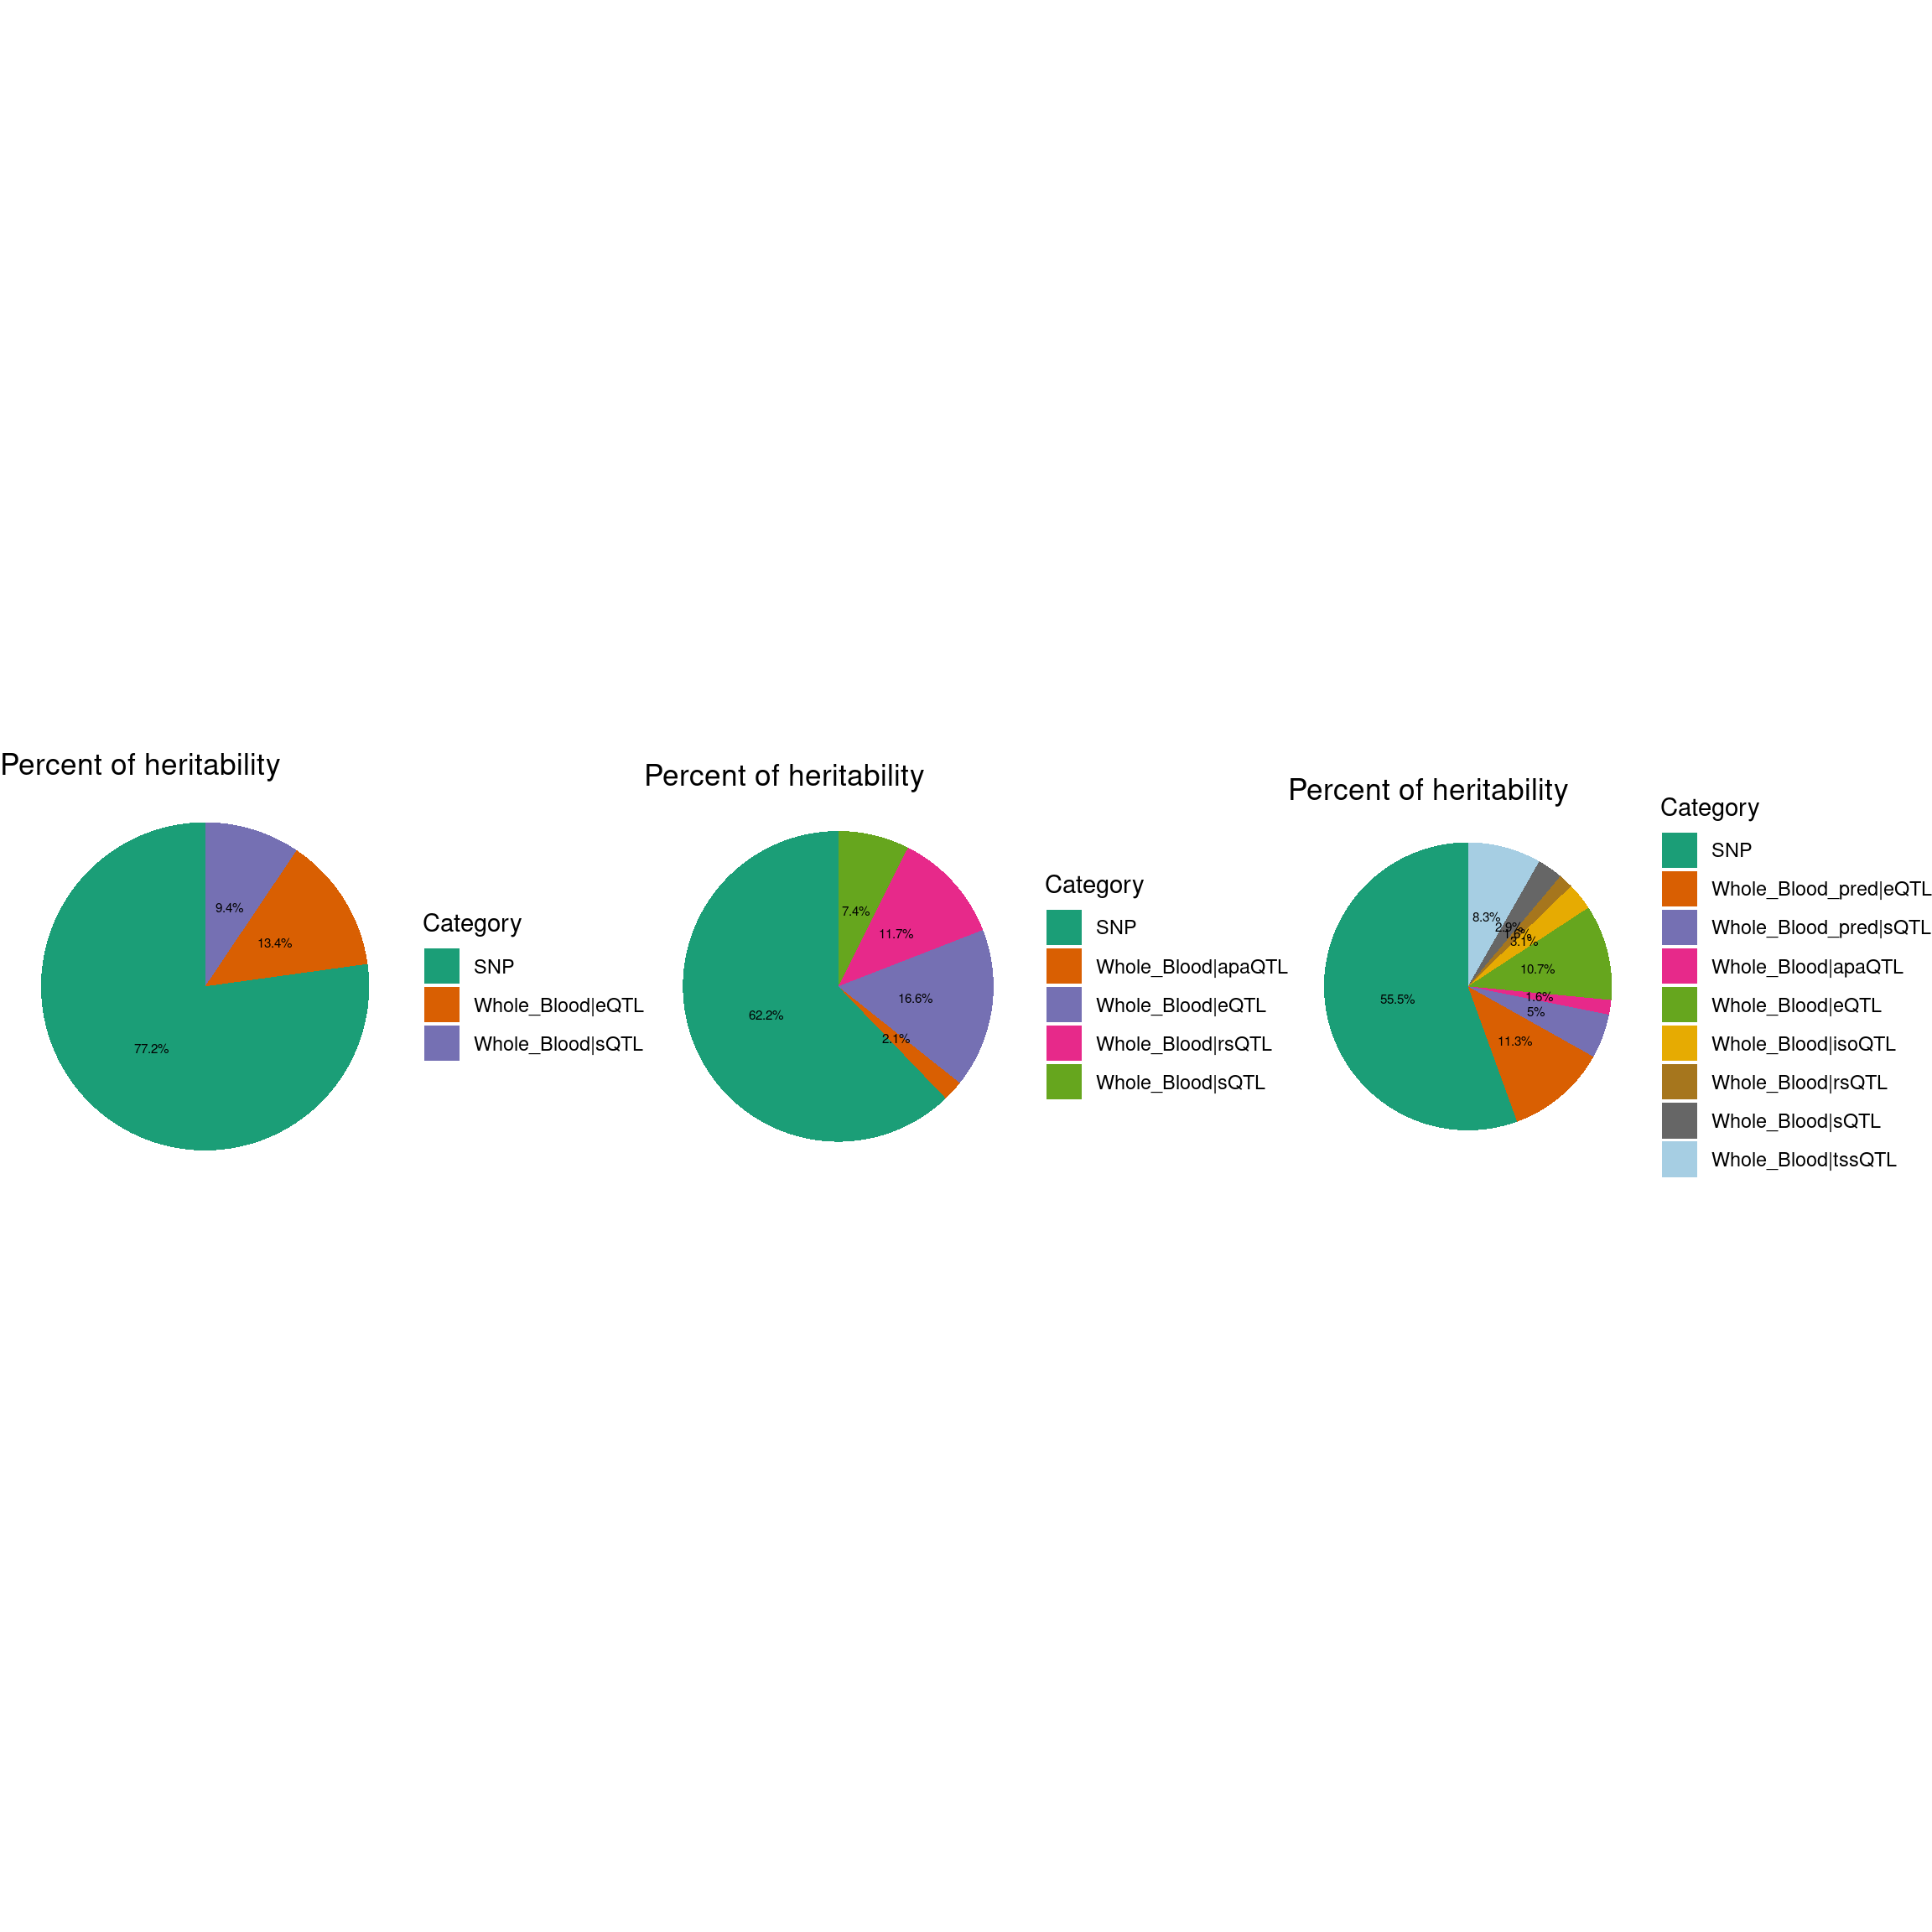
Comparing apaQTL and rsQTL
gene_apa <- unique(finemap_res_4W[finemap_res_4W$type == "apaQTL",]$gene_name)
gene_rs <- unique(finemap_res_4W[finemap_res_4W$type == "rsQTL",]$gene_name)
gene_overlap_rsapa <- intersect(gene_apa,gene_rs)
plot_venn_apars(gene_apa = gene_apa,gene_rs = gene_rs,gene_overlap = gene_overlap_rsapa)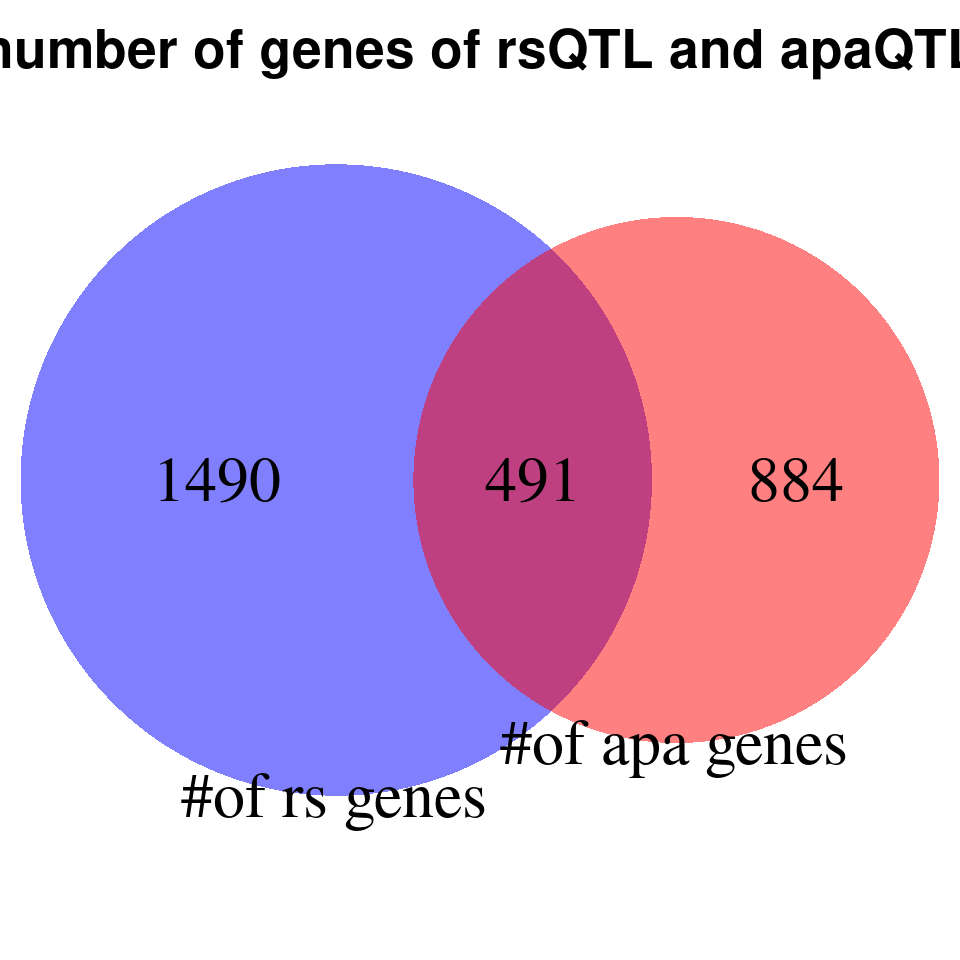
rs_apa_overlap_merged <- process_data_rsapa(finemap_res = finemap_res_4W)
plot_scatter_rsapa(rs_apa_overlap_merged = rs_apa_overlap_merged)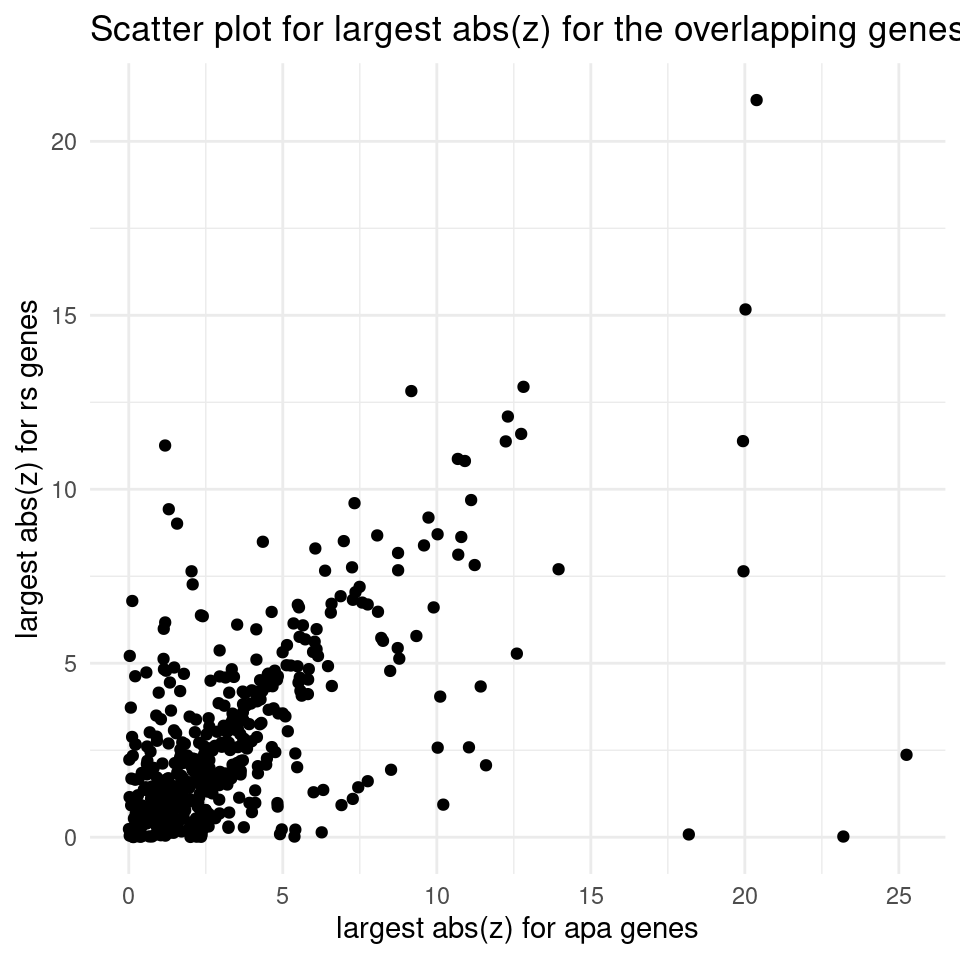
Fine-mapping results
combined_sig_espred <- combined_pip_by_type_espred[combined_pip_by_type_espred$combined_pip > 0.8,]
combined_sig_4W <- combined_pip_by_type_4W[combined_pip_by_type_4W$combined_pip > 0.8,]
combined_sig_8W <- combined_pip_by_type_8W[combined_pip_by_type_8W$combined_pip > 0.8,]

sprintf("# of genes with PIP > 0.8 = %s -- predictdb e +s", nrow(combined_sig_espred))
[1] "# of genes with PIP > 0.8 = 121 -- predictdb e +s"sprintf("# of genes with PIP > 0.8 = %s -- predictdb e + s + Munro apa + rs", nrow(combined_sig_4W))[1] "# of genes with PIP > 0.8 = 147 -- predictdb e + s + Munro apa + rs"sprintf("# of genes with PIP > 0.8 = %s -- all 8 weights", nrow(combined_sig_8W))[1] "# of genes with PIP > 0.8 = 232 -- all 8 weights"# DT::datatable(combined_sig_espred,caption = htmltools::tags$caption( style = 'caption-side: topleft; text-align = left; color:black;','High PIP genes -- predictdb e+s'),options = list(pageLength = 10) )
# DT::datatable(combined_sig_4W,caption = htmltools::tags$caption( style = 'caption-side: topleft; text-align = left; color:black;','High PIP genes -- predictdb e+s + Munro apa + rs'),options = list(pageLength = 10) )
# DT::datatable(combined_sig_8W,caption = htmltools::tags$caption( style = 'caption-side: topleft; text-align = left; color:black;','High PIP genes -- all 8 weights'),options = list(pageLength = 10) )
venn.plot <- plot_3venn(es = combined_sig_espred$gene_name,esra = combined_sig_4W$gene_name,all8 = combined_sig_8W$gene_name)
###1
heatmap_data <- combined_sig_8W[!combined_sig_8W$gene_name %in%combined_sig_espred$gene_name, ]
column_order <- c("gene_name","combined_pip",
                  "eQTL_pred_pip", "sQTL_pred_pip", "rsQTL_pip","apaQTL_pip",
                  "isoQTL_pip", "eQTL_pip","tssQTL_pip","sQTL_pip")
heatmap_data <- rename_heatmap_columns(heatmap_data = heatmap_data, column_order = column_order)
p1 <- plot_heatmap(heatmap_data = heatmap_data,main = "PIP partition for the genes reported by 8weight setting but not by e+s setting")

###2
heatmap_data <- combined_sig_4W[!combined_sig_4W$gene_name %in%combined_sig_espred$gene_name, ]
column_order <- c("gene_name","combined_pip",
                  "eQTL_pip", "sQTL_pip", "rsQTL_pip","apaQTL_pip")
heatmap_data <- rename_heatmap_columns(heatmap_data = heatmap_data, column_order = column_order)
p2 <- plot_heatmap(heatmap_data = heatmap_data,main = "PIP partition for the genes reported by 4weight setting but not by e+s setting")

###3
heatmap_data <- combined_sig_8W[!combined_sig_8W$gene_name %in%combined_sig_4W$gene_name, ]
column_order <- c("gene_name","combined_pip",
                  "eQTL_pred_pip", "sQTL_pred_pip", "rsQTL_pip","apaQTL_pip",
                  "isoQTL_pip", "eQTL_pip","tssQTL_pip","sQTL_pip")
heatmap_data <- rename_heatmap_columns(heatmap_data = heatmap_data, column_order = column_order)


p3 <- plot_heatmap(heatmap_data = heatmap_data,main = "PIP partition for the genes reported by 8weight setting but not by 4weight setting")

g1 <- p1$gtable
g2 <- p2$gtable
g3 <- p3$gtable
grid.arrange(g1, g2, g3, ncol=3)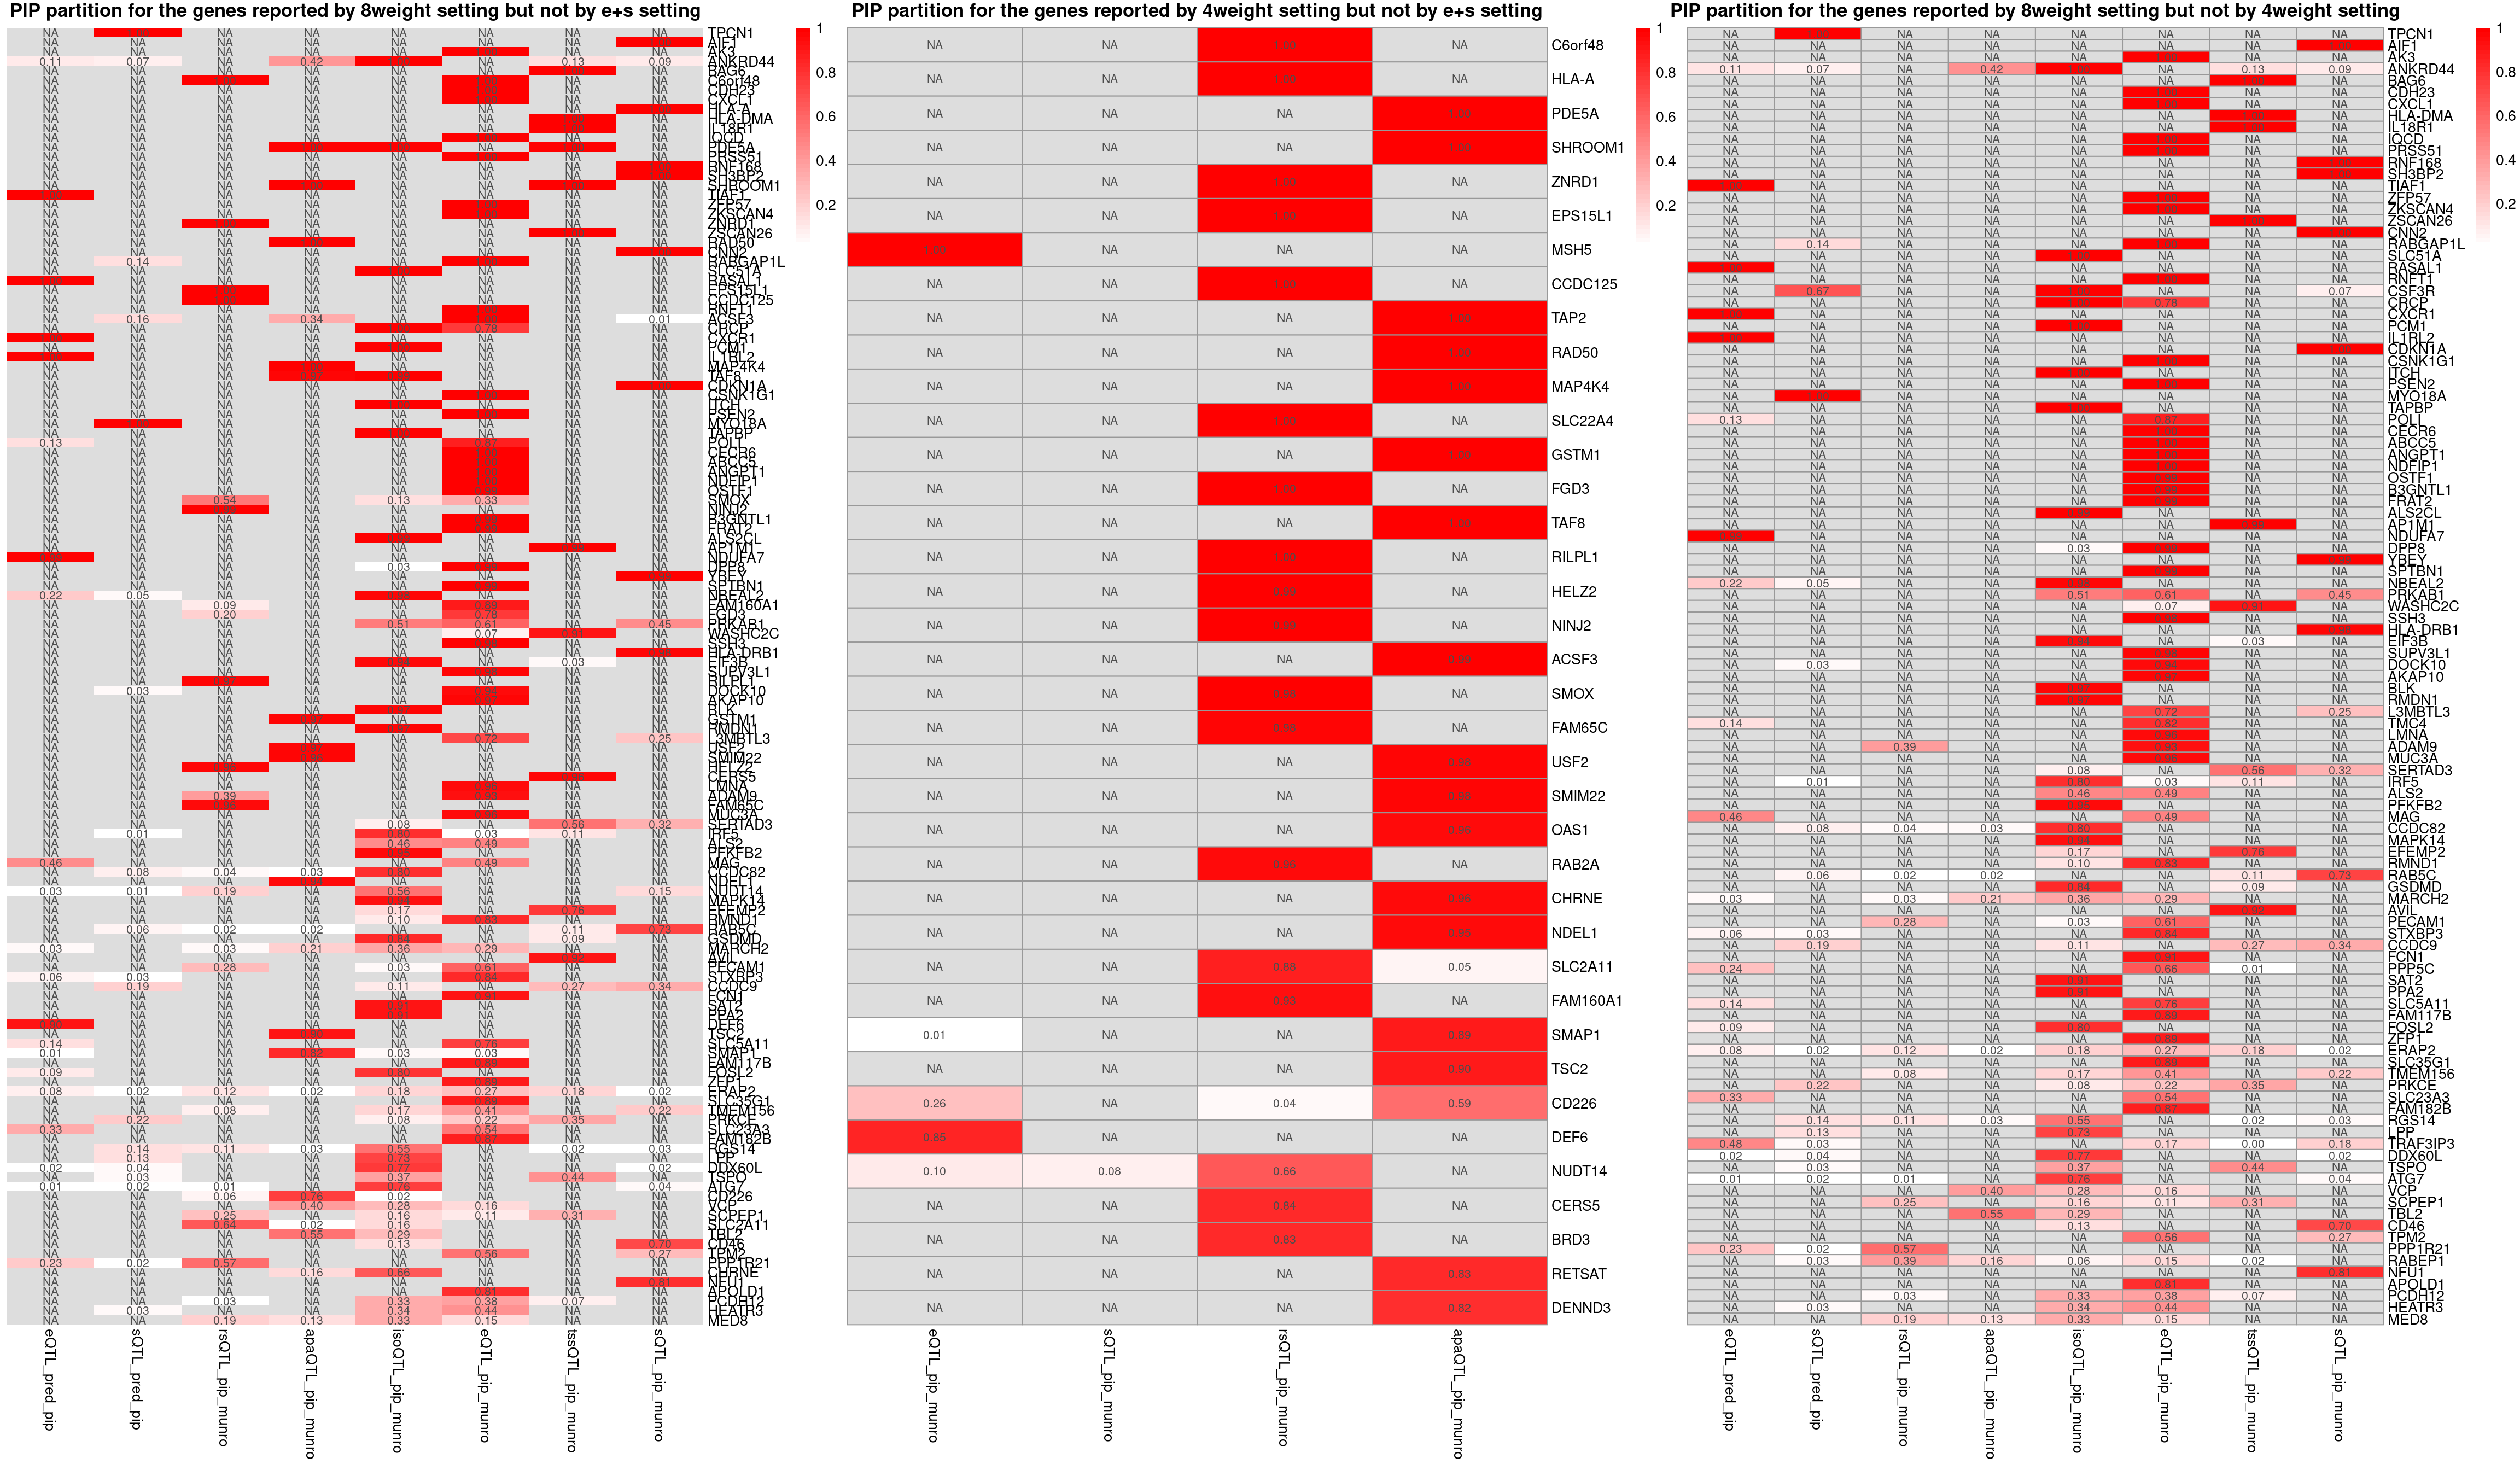
sessionInfo()R version 4.2.0 (2022-04-22)
Platform: x86_64-pc-linux-gnu (64-bit)
Running under: CentOS Linux 7 (Core)
Matrix products: default
BLAS/LAPACK: /software/openblas-0.3.13-el7-x86_64/lib/libopenblas_haswellp-r0.3.13.so
locale:
[1] LC_CTYPE=en_US.UTF-8 LC_NUMERIC=C
[3] LC_TIME=en_US.UTF-8 LC_COLLATE=en_US.UTF-8
[5] LC_MONETARY=en_US.UTF-8 LC_MESSAGES=en_US.UTF-8
[7] LC_PAPER=en_US.UTF-8 LC_NAME=C
[9] LC_ADDRESS=C LC_TELEPHONE=C
[11] LC_MEASUREMENT=en_US.UTF-8 LC_IDENTIFICATION=C
attached base packages:
[1] grid stats4 stats graphics grDevices utils datasets
[8] methods base
other attached packages:
[1] dplyr_1.1.4 pheatmap_1.0.12
[3] gridExtra_2.3 ggplot2_3.5.1
[5] VennDiagram_1.7.3 futile.logger_1.4.3
[7] EnsDb.Hsapiens.v86_2.99.0 ensembldb_2.20.2
[9] AnnotationFilter_1.20.0 GenomicFeatures_1.48.3
[11] AnnotationDbi_1.58.0 Biobase_2.56.0
[13] GenomicRanges_1.48.0 GenomeInfoDb_1.39.9
[15] IRanges_2.30.0 S4Vectors_0.34.0
[17] BiocGenerics_0.42.0 ctwas_0.4.14
loaded via a namespace (and not attached):
[1] colorspace_2.0-3 rjson_0.2.21
[3] ellipsis_0.3.2 rprojroot_2.0.3
[5] XVector_0.36.0 locuszoomr_0.2.1
[7] fs_1.5.2 rstudioapi_0.13
[9] farver_2.1.0 DT_0.22
[11] ggrepel_0.9.1 bit64_4.0.5
[13] fansi_1.0.3 xml2_1.3.3
[15] codetools_0.2-18 logging_0.10-108
[17] cachem_1.0.6 knitr_1.39
[19] jsonlite_1.8.0 workflowr_1.7.0
[21] Rsamtools_2.12.0 dbplyr_2.1.1
[23] png_0.1-7 readr_2.1.2
[25] compiler_4.2.0 httr_1.4.3
[27] assertthat_0.2.1 Matrix_1.5-3
[29] fastmap_1.1.0 lazyeval_0.2.2
[31] cli_3.6.1 formatR_1.12
[33] later_1.3.0 htmltools_0.5.2
[35] prettyunits_1.1.1 tools_4.2.0
[37] gtable_0.3.0 glue_1.6.2
[39] GenomeInfoDbData_1.2.8 rappdirs_0.3.3
[41] Rcpp_1.0.12 jquerylib_0.1.4
[43] vctrs_0.6.5 Biostrings_2.64.0
[45] rtracklayer_1.56.0 crosstalk_1.2.0
[47] xfun_0.41 stringr_1.5.1
[49] lifecycle_1.0.4 irlba_2.3.5
[51] restfulr_0.0.14 XML_3.99-0.14
[53] zlibbioc_1.42.0 zoo_1.8-10
[55] scales_1.3.0 gggrid_0.2-0
[57] hms_1.1.1 promises_1.2.0.1
[59] MatrixGenerics_1.8.0 ProtGenerics_1.28.0
[61] parallel_4.2.0 SummarizedExperiment_1.26.1
[63] RColorBrewer_1.1-3 lambda.r_1.2.4
[65] LDlinkR_1.2.3 yaml_2.3.5
[67] curl_4.3.2 memoise_2.0.1
[69] sass_0.4.1 biomaRt_2.54.1
[71] stringi_1.7.6 RSQLite_2.3.1
[73] highr_0.9 BiocIO_1.6.0
[75] filelock_1.0.2 BiocParallel_1.30.3
[77] rlang_1.1.2 pkgconfig_2.0.3
[79] matrixStats_0.62.0 bitops_1.0-7
[81] evaluate_0.15 lattice_0.20-45
[83] purrr_1.0.2 labeling_0.4.2
[85] GenomicAlignments_1.32.0 htmlwidgets_1.5.4
[87] cowplot_1.1.1 bit_4.0.4
[89] tidyselect_1.2.0 magrittr_2.0.3
[91] R6_2.5.1 generics_0.1.2
[93] DelayedArray_0.22.0 DBI_1.2.2
[95] withr_2.5.0 pgenlibr_0.3.3
[97] pillar_1.9.0 whisker_0.4
[99] KEGGREST_1.36.3 RCurl_1.98-1.7
[101] mixsqp_0.3-43 tibble_3.2.1
[103] crayon_1.5.1 futile.options_1.0.1
[105] utf8_1.2.2 BiocFileCache_2.4.0
[107] plotly_4.10.0 tzdb_0.4.0
[109] rmarkdown_2.25 progress_1.2.2
[111] data.table_1.14.2 blob_1.2.3
[113] git2r_0.30.1 digest_0.6.29
[115] tidyr_1.3.0 httpuv_1.6.5
[117] munsell_0.5.0 viridisLite_0.4.0
[119] bslib_0.3.1