LDL analysis after postprocessing
XSun
2025-01-05
Last updated: 2025-02-06
Checks: 6 1
Knit directory: multigroup_ctwas_analysis/
This reproducible R Markdown analysis was created with workflowr (version 1.7.0). The Checks tab describes the reproducibility checks that were applied when the results were created. The Past versions tab lists the development history.
The R Markdown file has unstaged changes. To know which version of
the R Markdown file created these results, you’ll want to first commit
it to the Git repo. If you’re still working on the analysis, you can
ignore this warning. When you’re finished, you can run
wflow_publish to commit the R Markdown file and build the
HTML.
Great job! The global environment was empty. Objects defined in the global environment can affect the analysis in your R Markdown file in unknown ways. For reproduciblity it’s best to always run the code in an empty environment.
The command set.seed(20231112) was run prior to running
the code in the R Markdown file. Setting a seed ensures that any results
that rely on randomness, e.g. subsampling or permutations, are
reproducible.
Great job! Recording the operating system, R version, and package versions is critical for reproducibility.
Nice! There were no cached chunks for this analysis, so you can be confident that you successfully produced the results during this run.
Great job! Using relative paths to the files within your workflowr project makes it easier to run your code on other machines.
Great! You are using Git for version control. Tracking code development and connecting the code version to the results is critical for reproducibility.
The results in this page were generated with repository version a88da38. See the Past versions tab to see a history of the changes made to the R Markdown and HTML files.
Note that you need to be careful to ensure that all relevant files for
the analysis have been committed to Git prior to generating the results
(you can use wflow_publish or
wflow_git_commit). workflowr only checks the R Markdown
file, but you know if there are other scripts or data files that it
depends on. Below is the status of the Git repository when the results
were generated:
Ignored files:
    Ignored:    .Rhistory

Untracked files:
    Untracked:  VennDiagram.2025-02-06_16-54-41.log
    Untracked:  analysis/VennDiagram.2025-02-06_16-43-35.log
    Untracked:  analysis/VennDiagram.2025-02-06_16-44-20.log
    Untracked:  analysis/VennDiagram.2025-02-06_16-45-04.log

Unstaged changes:
    Modified:   analysis/LDL_silver_standard.Rmd
Note that any generated files, e.g. HTML, png, CSS, etc., are not included in this status report because it is ok for generated content to have uncommitted changes.
These are the previous versions of the repository in which changes were
made to the R Markdown (analysis/LDL_silver_standard.Rmd)
and HTML (docs/LDL_silver_standard.html) files. If you’ve
configured a remote Git repository (see ?wflow_git_remote),
click on the hyperlinks in the table below to view the files as they
were in that past version.
| File | Version | Author | Date | Message |
|---|---|---|---|---|
| Rmd | a88da38 | XSun | 2025-01-31 | update |
| html | a88da38 | XSun | 2025-01-31 | update |
| Rmd | 5393b0c | XSun | 2025-01-24 | update |
| html | 5393b0c | XSun | 2025-01-24 | update |
| Rmd | 6c7c5cb | XSun | 2025-01-22 | update |
| html | 6c7c5cb | XSun | 2025-01-22 | update |
| Rmd | 0189bd3 | XSun | 2025-01-22 | update |
| html | 0189bd3 | XSun | 2025-01-22 | update |
| Rmd | 10833df | XSun | 2025-01-14 | update |
| html | 10833df | XSun | 2025-01-14 | update |
| Rmd | 450f341 | XSun | 2025-01-13 | update |
| html | 450f341 | XSun | 2025-01-13 | update |
| Rmd | 80e204a | XSun | 2025-01-10 | update |
| html | 80e204a | XSun | 2025-01-10 | update |
Introduction
We used the LDL genes reported by multi-group analysis after postprocess to do some downstream analysiss.
library(ctwas)
library(dplyr)
library(EnsDb.Hsapiens.v86)
library(pheatmap)
library(ggplot2)
library(VennDiagram)
ens_db <- EnsDb.Hsapiens.v86

mapping_predictdb <- readRDS("/project2/xinhe/shared_data/multigroup_ctwas/weights/mapping_files/PredictDB_mapping.RDS")
mapping_munro <- readRDS("/project2/xinhe/shared_data/multigroup_ctwas/weights/mapping_files/Munro_mapping.RDS")
mapping_two <- rbind(mapping_predictdb,mapping_munro)


plot_heatmap_byomics <- function(heatmap_data, main) {

  rownames(heatmap_data) <- heatmap_data$gene_name
  heatmap_data <- heatmap_data %>% dplyr::select(-gene_name, -combined_pip)

  if(nrow(heatmap_data) ==1){

    heatmap_data <- rbind(heatmap_data,rep(0,ncol(heatmap_data)))
    rownames(heatmap_data)[2] <- "fake_gene_for_plotting"

  }

  heatmap_matrix <- as.matrix(heatmap_data)

  p <- pheatmap(heatmap_matrix,
                cluster_rows = F,   # Cluster the rows (genes)
                cluster_cols = F,   # Cluster the columns (QTL types)
                color = colorRampPalette(c("white", "red"))(50), # Color gradient
                display_numbers = TRUE, # Display numbers in cells
                main = main,labels_row = rownames(heatmap_data), silent = T)

  return(p)
}

plot_heatmap_bytissue <- function(heatmap_data, main, tissues) {

  rownames(heatmap_data) <- heatmap_data$gene_name
  heatmap_data <- heatmap_data %>% dplyr::select(-gene_name, -combined_pip)

  pip_types <- c("|eQTL_pip", "|sQTL_pip", "|stQTL_pip")

  combinations <- expand.grid(pip_types, tissues)
  order <- paste0(combinations$Var2, combinations$Var1)

  heatmap_data <- heatmap_data[,order]

  if(nrow(heatmap_data) ==1){

    heatmap_data <- rbind(heatmap_data,rep(0,ncol(heatmap_data)))
    rownames(heatmap_data)[2] <- "fake_gene_for_plotting"

  }

  heatmap_matrix <- as.matrix(heatmap_data)

  p <- pheatmap(heatmap_matrix,
                cluster_rows = F,   # Cluster the rows (genes)
                cluster_cols = F,   # Cluster the columns (QTL types)
                color = colorRampPalette(c("white", "red"))(50), # Color gradient
                display_numbers = TRUE, # Display numbers in cells
                main = main,labels_row = rownames(heatmap_data), silent = T)

  return(p)
}


get_ctwas_file <- function(trait, tissue = NULL, folder_results) {
  # Build file paths
  if (is.null(tissue)) {
    file_ctwas_res_origin <- paste0(folder_results, "/", trait, "/", trait, ".finemap_regions_res.RDS")
    file_ctwas_res_regionmerge <- paste0(folder_results, "/", trait, "/", trait, ".regionmerge_finemap_regions_res.RDS")
    file_ctwas_res_ldmismatch <- paste0(folder_results, "/", trait, "/", trait, ".ldmismatch_finemap_regions_res.RDS")
  } else {
    file_ctwas_res_origin <- paste0(folder_results, "/", trait, "/", trait, "_", tissue, ".finemap_regions_res.RDS")
    file_ctwas_res_regionmerge <- paste0(folder_results, "/", trait, "/", trait, "_", tissue, ".regionmerge_finemap_regions_res.RDS")
    file_ctwas_res_ldmismatch <- paste0(folder_results, "/", trait, "/", trait, "_", tissue, ".ldmismatch_finemap_regions_res.RDS")
  }

  # Determine which file exists
  file_ctwas_result <- if (file.exists(file_ctwas_res_ldmismatch)) {
    file_ctwas_res_ldmismatch
  } else if (file.exists(file_ctwas_res_regionmerge)) {
    file_ctwas_res_regionmerge
  } else {
    file_ctwas_res_origin
  }

  return(file_ctwas_result)
}
Fine-mapping results
Single eQTL analysis results – pre-estimate L
trait <- "LDL-ukb-d-30780_irnt"
tissue <- "Liver"

folder_single_results <- "/project/xinhe/shengqian/single_tissue_screen/processed_weights/expression_weights/"

file_ctwas_result <- get_ctwas_file(trait, tissue, folder_single_results)

ctwas_res_single_post <- readRDS(file_ctwas_result)

z_gene_single <-readRDS(paste0(folder_single_results,"/",trait,"/",trait,"_",tissue,".z_gene.RDS"))

susie_alpha_res_single_post <- ctwas_res_single_post$susie_alpha_res
susie_alpha_res_single_post <- anno_susie_alpha_res(susie_alpha_res_single_post,
                                        mapping_table = mapping_two,
                                        map_by = "molecular_id",
                                        drop_unmapped = TRUE)
2025-02-06 21:48:39 INFO::Annotating susie alpha result ...
2025-02-06 21:48:39 INFO::Map molecular traits to genescombined_pip_by_group_single <- combine_gene_pips(susie_alpha_res_single_post,
group_by = "gene_name",
by = "group",
method = "combine_cs",
filter_cs = TRUE,
include_cs_id = F)
combined_pip_sig_single <- subset(combined_pip_by_group_single, combined_pip > 0.8)
DT::datatable(combined_pip_sig_single,caption = htmltools::tags$caption( style = 'caption-side: left; text-align: left; color:black; font-size:150% ;','Genes with PIP > 0.8 in single eQTL analysis, cs filtered'),options = list(pageLength = 5) )z_gene_single <- z_gene_single %>%
mutate(molecular_id = sub("\\|.*", "", id)) %>% # Extract ENSG ID from id
left_join(mapping_two %>% dplyr::select(molecular_id, gene_name), by = "molecular_id")Single eQTL analysis results – L=5 – eQTL, SNP different variance
trait <- "LDL-ukb-d-30780_irnt"
tissue <- "Liver"
folder_single_results_L5 <- "/project/xinhe/shengqian/single_tissue_screen/processed_weights_L5/expression_weights"
file_ctwas_result_L5 <- get_ctwas_file(trait, tissue, folder_single_results_L5)
ctwas_res_single_post_L5 <- readRDS(file_ctwas_result_L5)
z_gene_single_L5 <-readRDS(paste0(folder_single_results_L5,"/",trait,"/",trait,"_",tissue,".z_gene.RDS"))
susie_alpha_res_single_post_L5 <- ctwas_res_single_post_L5$susie_alpha_res
susie_alpha_res_single_post_L5 <- anno_susie_alpha_res(susie_alpha_res_single_post_L5,
mapping_table = mapping_two,
map_by = "molecular_id",
drop_unmapped = TRUE)2025-02-06 21:48:45 INFO::Annotating susie alpha result ...
2025-02-06 21:48:45 INFO::Map molecular traits to genescombined_pip_by_group_single_L5 <- combine_gene_pips(susie_alpha_res_single_post_L5,
group_by = "gene_name",
by = "group",
method = "combine_cs",
filter_cs = TRUE,
include_cs_id = F)
combined_pip_sig_single_L5 <- subset(combined_pip_by_group_single_L5, combined_pip > 0.8)
DT::datatable(combined_pip_sig_single_L5,caption = htmltools::tags$caption( style = 'caption-side: left; text-align: left; color:black; font-size:150% ;','Genes with PIP > 0.8 in single eQTL analysis, cs filtered'),options = list(pageLength = 5) )z_gene_single_L5 <- z_gene_single_L5 %>%
mutate(molecular_id = sub("\\|.*", "", id)) %>% # Extract ENSG ID from id
left_join(mapping_two %>% dplyr::select(molecular_id, gene_name), by = "molecular_id")Single eQTL analysis results – L=5 – same variance
trait <- "LDL-ukb-d-30780_irnt"
tissue <- "Liver"
folder_single_results_sharedvar_L5 <- "/project/xinhe/shengqian/single_tissue_screen/processed_weights_samevariance_L5/expression_weights/"
file_ctwas_result_sharedvar_L5 <- get_ctwas_file(trait, tissue, folder_single_results_sharedvar_L5)
ctwas_res_single_post_sharedvar_L5 <- readRDS(file_ctwas_result_sharedvar_L5)
z_gene_single_sharedvar_L5 <-readRDS(paste0(folder_single_results_sharedvar_L5,"/",trait,"/",trait,"_",tissue,".z_gene.RDS"))
susie_alpha_res_single_post_sharedvar_L5 <- ctwas_res_single_post_sharedvar_L5$susie_alpha_res
susie_alpha_res_single_post_sharedvar_L5 <- anno_susie_alpha_res(susie_alpha_res_single_post_sharedvar_L5,
mapping_table = mapping_two,
map_by = "molecular_id",
drop_unmapped = TRUE)2025-02-06 21:48:51 INFO::Annotating susie alpha result ...
2025-02-06 21:48:51 INFO::Map molecular traits to genescombined_pip_by_group_single_sharedvar_L5 <- combine_gene_pips(susie_alpha_res_single_post_sharedvar_L5,
group_by = "gene_name",
by = "group",
method = "combine_cs",
filter_cs = TRUE,
include_cs_id = F)
combined_pip_sig_single_sharedvar_L5 <- subset(combined_pip_by_group_single_sharedvar_L5, combined_pip > 0.8)
DT::datatable(combined_pip_sig_single_sharedvar_L5,caption = htmltools::tags$caption( style = 'caption-side: left; text-align: left; color:black; font-size:150% ;','Genes with PIP > 0.8 in single eQTL analysis, cs filtered'),options = list(pageLength = 5) )z_gene_single_sharedvar_L5 <- z_gene_single_sharedvar_L5 %>%
mutate(molecular_id = sub("\\|.*", "", id)) %>% # Extract ENSG ID from id
left_join(mapping_two %>% dplyr::select(molecular_id, gene_name), by = "molecular_id")Comparing with silver standard genes
We followed the analysis in ctwas paper. The silver standard genes for LDL are:
LDL_silver <- readxl::read_excel("/project/xinhe/xsun/multi_group_ctwas/data/LDL_silver.xlsx")
LDL_silver_known <- LDL_silver[LDL_silver$annotation == "known",]
LDL_silver_bystand <- LDL_silver[LDL_silver$annotation != "known",]
DT::datatable(LDL_silver,caption = htmltools::tags$caption( style = 'caption-side: left; text-align: left; color:black; font-size:150% ;','The silver standard genes for LDL (from ctwas paper, table S2)'),options = list(pageLength = 5) )stats <- data.frame(
analysis = c("ctwas paper",
"ctwasV2 - single eQTL - eQTL,SNP different variance, preL",
"ctwasV2 - single eQTL - eQTL,SNP different variance - L=5",
"ctwasV2 - single eQTL - eQTL,SNP share variance - L=5",
"ctwasV2 - multigroup - QTL share variance, preL",
"ctwasV2 - multigroup - all share variance, preL",
"ctwasV2 - multigroup - QTL share variance, L=5",
"ctwasV2 - multigroup - all share variance, L=5"),
num_gene_pip08 = c(35,
nrow(combined_pip_sig_single),
nrow(combined_pip_sig_single_L5),
nrow(combined_pip_sig_single_sharedvar_L5),
nrow(combined_pip_sig_multi),
nrow(combined_pip_sig_multi_samevar),
nrow(combined_pip_sig_multi_L5),
nrow(combined_pip_sig_multi_samevar_L5)),
num_gene_known_imputable = c("46 of 69 known",
sum(LDL_silver_known$genename %in% z_gene_single$gene_name),
sum(LDL_silver_known$genename %in% z_gene_single_L5$gene_name),
sum(LDL_silver_known$genename %in% z_gene_single_sharedvar_L5$gene_name),
sum(LDL_silver_known$genename %in% z_gene_multi$gene_name),
sum(LDL_silver_known$genename %in% z_gene_multi_samevar$gene_name),
sum(LDL_silver_known$genename %in% z_gene_multi_L5$gene_name),
sum(LDL_silver_known$genename %in% z_gene_multi_samevar_L5$gene_name)),
num_gene_known_pip08 = c(6,
sum(LDL_silver_known$genename %in% combined_pip_sig_single$gene_name),
sum(LDL_silver_known$genename %in% combined_pip_sig_single_L5$gene_name),
sum(LDL_silver_known$genename %in% combined_pip_sig_single_sharedvar_L5$gene_name),
sum(LDL_silver_known$genename %in% combined_pip_sig_multi$gene_name),
sum(LDL_silver_known$genename %in% combined_pip_sig_multi_samevar$gene_name),
sum(LDL_silver_known$genename %in% combined_pip_sig_multi_L5$gene_name),
sum(LDL_silver_known$genename %in% combined_pip_sig_multi_samevar_L5$gene_name)),
num_gene_bystander_imputable = c("539 of 539 bystander",
sum(LDL_silver_bystand$genename %in% z_gene_single$gene_name),
sum(LDL_silver_bystand$genename %in% z_gene_single_L5$gene_name),
sum(LDL_silver_bystand$genename %in% z_gene_single_sharedvar_L5$gene_name),
sum(LDL_silver_bystand$genename %in% z_gene_multi$gene_name),
sum(LDL_silver_bystand$genename %in% z_gene_multi_samevar$gene_name),
sum(LDL_silver_bystand$genename %in% z_gene_multi_L5$gene_name),
sum(LDL_silver_bystand$genename %in% z_gene_multi_samevar_L5$gene_name)),
num_gene_bystander_pip08 = c(2,
sum(LDL_silver_bystand$genename %in% combined_pip_sig_single$gene_name),
sum(LDL_silver_bystand$genename %in% combined_pip_sig_single_L5$gene_name),
sum(LDL_silver_bystand$genename %in% combined_pip_sig_single_sharedvar_L5$gene_name),
sum(LDL_silver_bystand$genename %in% combined_pip_sig_multi$gene_name),
sum(LDL_silver_bystand$genename %in% combined_pip_sig_multi_samevar$gene_name),
sum(LDL_silver_bystand$genename %in% combined_pip_sig_multi_L5$gene_name),
sum(LDL_silver_bystand$genename %in% combined_pip_sig_multi_samevar_L5$gene_name))
)
stats$TP <- stats$num_gene_known_pip08 / (stats$num_gene_known_pip08 + stats$num_gene_bystander_pip08)
DT::datatable(stats,caption = htmltools::tags$caption( style = 'caption-side: left; text-align: left; color:black; font-size:150% ;',''),options = list(pageLength = 10) )Checking why some silver standard genes are missed – single eQTL, pre-estimate L
LDL_silver_known_sig <- LDL_silver_known[as.numeric(LDL_silver_known$PIP) > 0.8 & LDL_silver_known$PIP !="NA",]
LDL_silver_known_sig <- LDL_silver_known_sig[,c("genename","cs_index","PIP","z","num_eqtl","region_tag")]
# check z_scores
z_gene_single <- readRDS(paste0(folder_single_results,"/",trait,"/",trait,"_",tissue,".z_gene.RDS"))
z_gene_single <- z_gene_single %>%
  mutate(molecular_id = sub("\\|.*", "", id)) %>%  # Extract ENSG ID from id
  left_join(mapping_two %>% dplyr::select(molecular_id, gene_name), by = "molecular_id")
z_gene_single <- z_gene_single[,c("gene_name","z")]
z_gene_selected <- z_gene_single[z_gene_single$gene_name %in% LDL_silver_known_sig$genename,]
LDL_silver_known_sig <- merge(LDL_silver_known_sig,z_gene_selected, by.x ="genename", by.y = "gene_name",all.x=T)
# check pre-estimated L
screened_region_L <- readRDS(paste0(folder_single_results,"/",trait,"/",trait,"_",tissue,".screened_region_L.RDS"))
region_info <- readRDS("/project2/xinhe/shared_data/multigroup_ctwas/LD_region_info/region_info.RDS")
LDL_silver_known_sig$tag1 <- unlist(strsplit(LDL_silver_known_sig$region_tag,split = "_"))[seq(1,2*nrow(LDL_silver_known_sig), by =2)]
LDL_silver_known_sig$tag2 <- unlist(strsplit(LDL_silver_known_sig$region_tag,split = "_"))[seq(2,2*nrow(LDL_silver_known_sig), by =2)]
LDL_silver_known_sig$regionid <- ctwas:::convert_region_tags_to_region_id(region_info, LDL_silver_known_sig$tag1, LDL_silver_known_sig$tag2)
LDL_silver_known_sig$screened_region_L_newversion <- screened_region_L[LDL_silver_known_sig$regionid]
combined_pip_by_group_single_nocs <- combine_gene_pips(susie_alpha_res_single_post,
group_by = "gene_name",
by = "group",
method = "combine_cs",
filter_cs = F,
include_cs_id = T)
LDL_silver_known_sig <- merge(LDL_silver_known_sig, combined_pip_by_group_single_nocs, by.x = "genename", by.y = "gene_name", all.x = T)
LDL_silver_known_sig <- LDL_silver_known_sig[,c("genename","cs_index","PIP","z.x","z.y","screened_region_L_newversion","combined_cs_id","combined_pip")]
colnames(LDL_silver_known_sig) <- c("genename","cs_index_old","PIP_old","z_old","z_new","screened_region_L_new","cs_id_new","PIP_new")
refinemap <- readRDS("/project/xinhe/xsun/multi_group_ctwas/13.post_processing_0103/results_other/ldl_silver_finemap_region.RDS")
LDL_silver_known_sig <- merge(LDL_silver_known_sig,refinemap, by.x = "genename", by.y = "gene_name", all.x=T)
LDL_silver_known_sig <- LDL_silver_known_sig[,1:ncol(LDL_silver_known_sig)-1]
colnames(LDL_silver_known_sig)[ncol(LDL_silver_known_sig)] <- "PIP_finemap_with_L=5"
DT::datatable(LDL_silver_known_sig,caption = htmltools::tags$caption( style = 'caption-side: left; text-align: left; color:black; font-size:150% ;','Comparing the old results and new results for the silver standard genes'),options = list(pageLength = 10) )print("ABCG8 weights")[1] "ABCG8 weights"weights_single <- readRDS(paste0(folder_single_results,"/",trait,"/",trait,"_",tissue,".preprocessed.weights.E.RDS"))
weights_gene <- weights_single[["ENSG00000143921.6"]]
print(weights_gene)NULLsnp_map <- readRDS("/project2/xinhe/shared_data/multigroup_ctwas/LD_region_info/snp_map.RDS")
finemap_res_single <- ctwas_res_single_post$finemap_res
finemap_res_single <- anno_finemap_res(finemap_res_single,
snp_map = snp_map,
mapping_table = mapping_two,
add_gene_annot = TRUE,
map_by = "molecular_id",
drop_unmapped = TRUE,
add_position = TRUE,
use_gene_pos = "mid")2025-02-06 21:50:28 INFO::Annotating fine-mapping result ...
2025-02-06 21:50:35 INFO::Map molecular traits to genes
2025-02-06 21:50:47 INFO::Add gene positions
2025-02-06 21:50:48 INFO::Add SNP positionsprint("PLTP")[1] "PLTP"region_id <- "20_44051536_46210417"
make_locusplot(finemap_res_single,
region_id = region_id,
ens_db = ens_db,
weights = weights_single,
highlight_pip = 0.8,
filter_protein_coding_genes = TRUE,
filter_cs = TRUE,
color_pval_by = "cs",
color_pip_by = "cs",panel.heights = c(4,4,1,1))2025-02-06 21:51:09 INFO::Limit to protein coding genes
2025-02-06 21:51:09 INFO::focal id: ENSG00000100979.14|Liver_eQTL
2025-02-06 21:51:09 INFO::focal molecular trait: PLTP Liver eQTL
2025-02-06 21:51:09 INFO::Range of locus: chr20:44052014-46210287
2025-02-06 21:51:13 INFO::focal molecular trait QTL positions: 45906012
2025-02-06 21:51:13 INFO::Limit PIPs to credible sets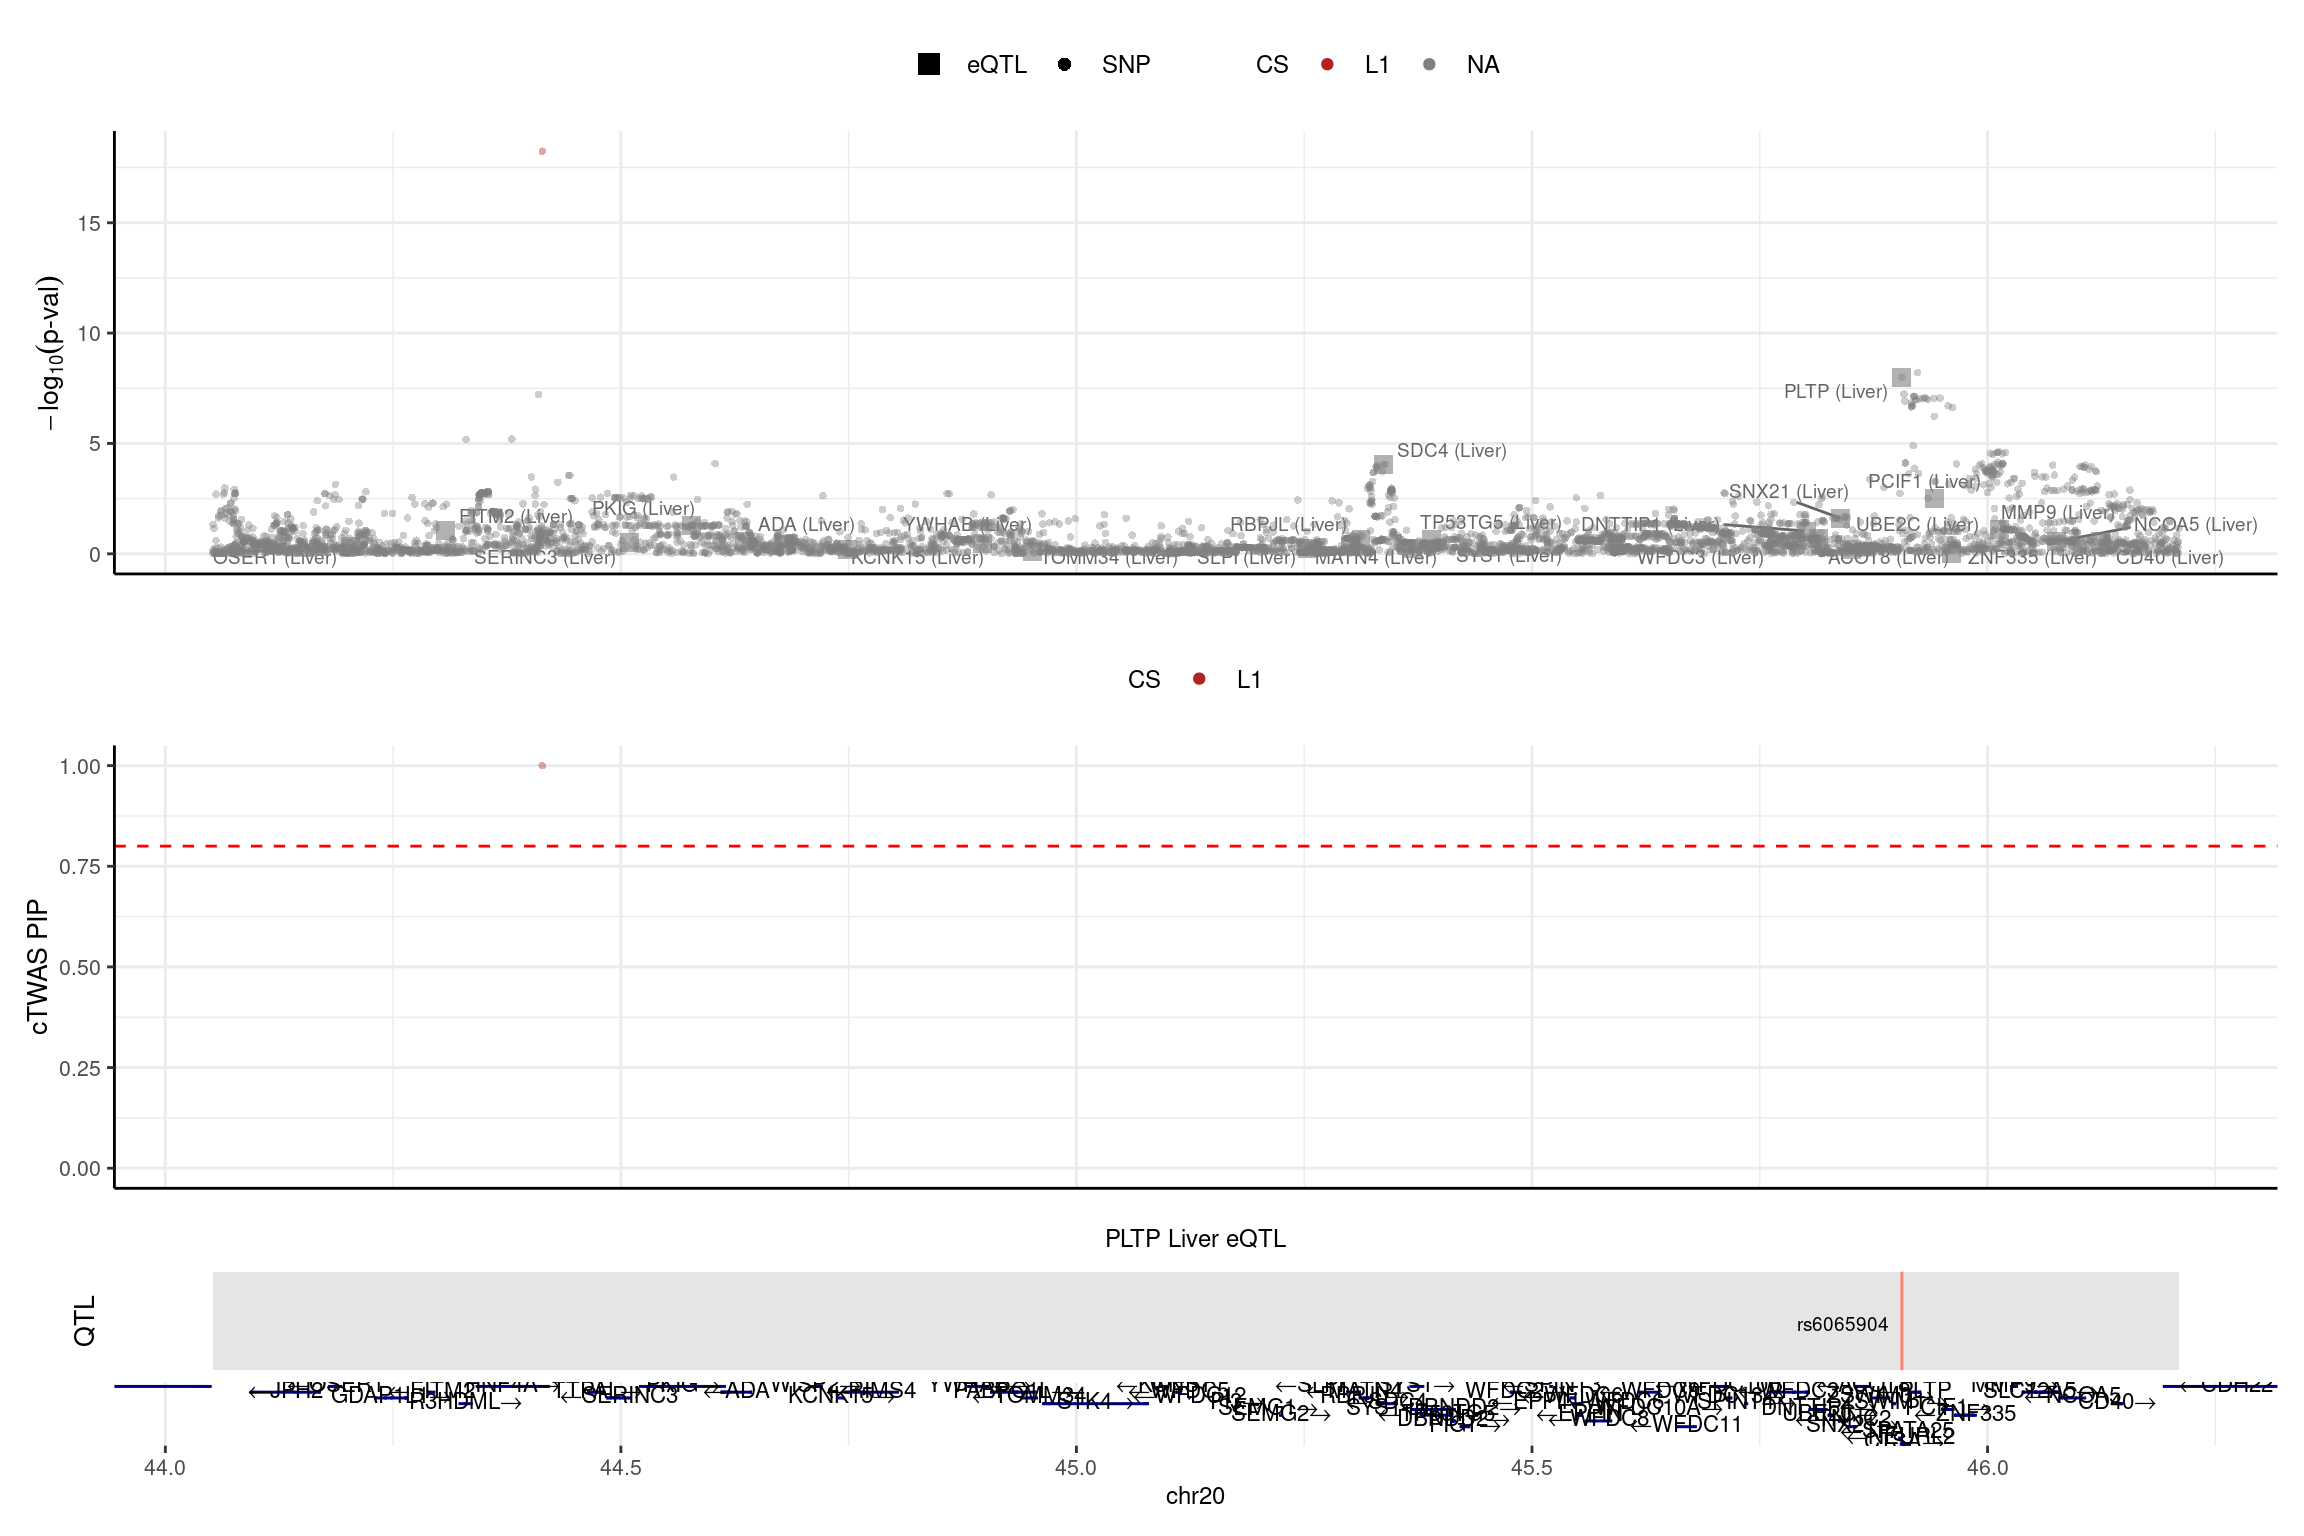
print("ABCA1")[1] "ABCA1"region_id <- "9_104819468_106536473"
make_locusplot(finemap_res_single,
region_id = region_id,
ens_db = ens_db,
weights = weights_single,
highlight_pip = 0.8,
filter_protein_coding_genes = TRUE,
filter_cs = TRUE,
color_pval_by = "cs",
color_pip_by = "cs",panel.heights = c(4,4,1,1))2025-02-06 21:51:23 INFO::Limit to protein coding genes
2025-02-06 21:51:23 INFO::focal id: ENSG00000165029.15|Liver_eQTL
2025-02-06 21:51:23 INFO::focal molecular trait: ABCA1 Liver eQTL
2025-02-06 21:51:23 INFO::Range of locus: chr9:104819368-106535859
2025-02-06 21:51:24 INFO::focal molecular trait QTL positions: 104906792
2025-02-06 21:51:24 INFO::Limit PIPs to credible sets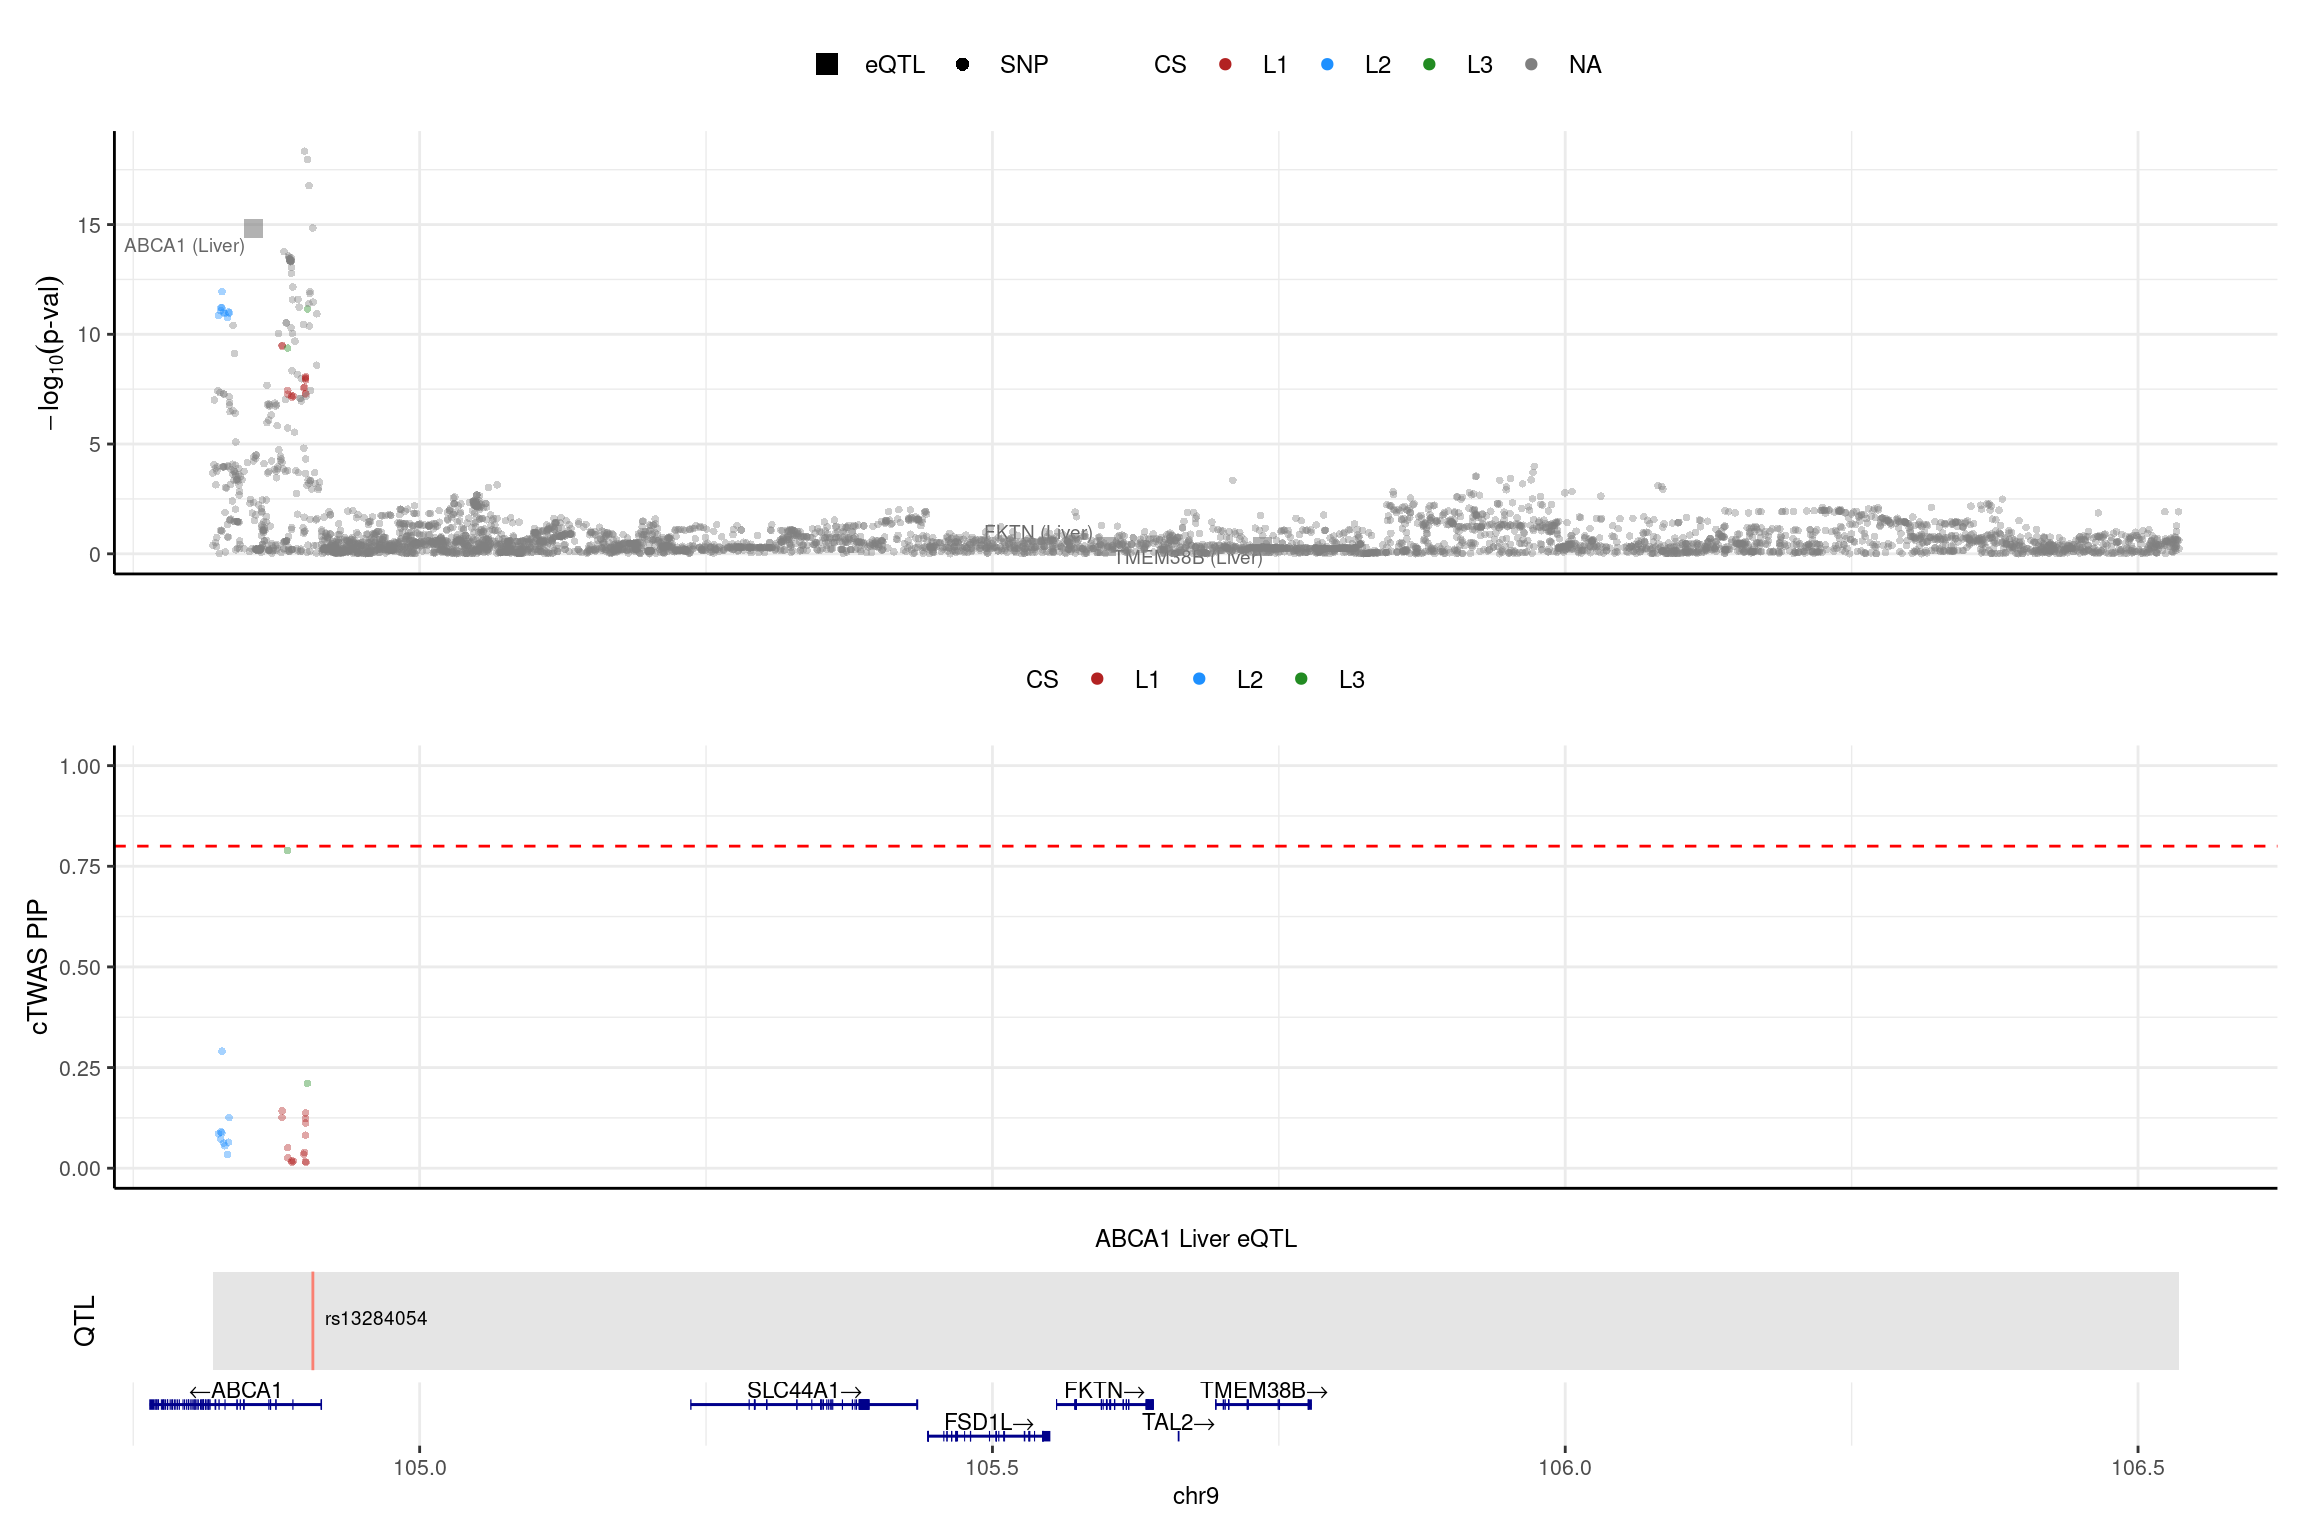
| Version | Author | Date |
|---|---|---|
| a88da38 | XSun | 2025-01-31 |
print("NPC1L1")[1] "NPC1L1"region_id <- "7_43119475_44724229"
make_locusplot(finemap_res_single,
region_id = region_id,
ens_db = ens_db,
weights = weights_single,
highlight_pip = 0.8,
filter_protein_coding_genes = TRUE,
filter_cs = TRUE,
color_pval_by = "cs",
color_pip_by = "cs",panel.heights = c(4,4,1,1))2025-02-06 21:51:25 INFO::Limit to protein coding genes
2025-02-06 21:51:25 INFO::focal id: ENSG00000136271.10|Liver_eQTL
2025-02-06 21:51:25 INFO::focal molecular trait: DDX56 Liver eQTL
2025-02-06 21:51:25 INFO::Range of locus: chr7:43119604-44723797
2025-02-06 21:51:25 INFO::focal molecular trait QTL positions: 44575121,44575587
2025-02-06 21:51:25 INFO::Limit PIPs to credible sets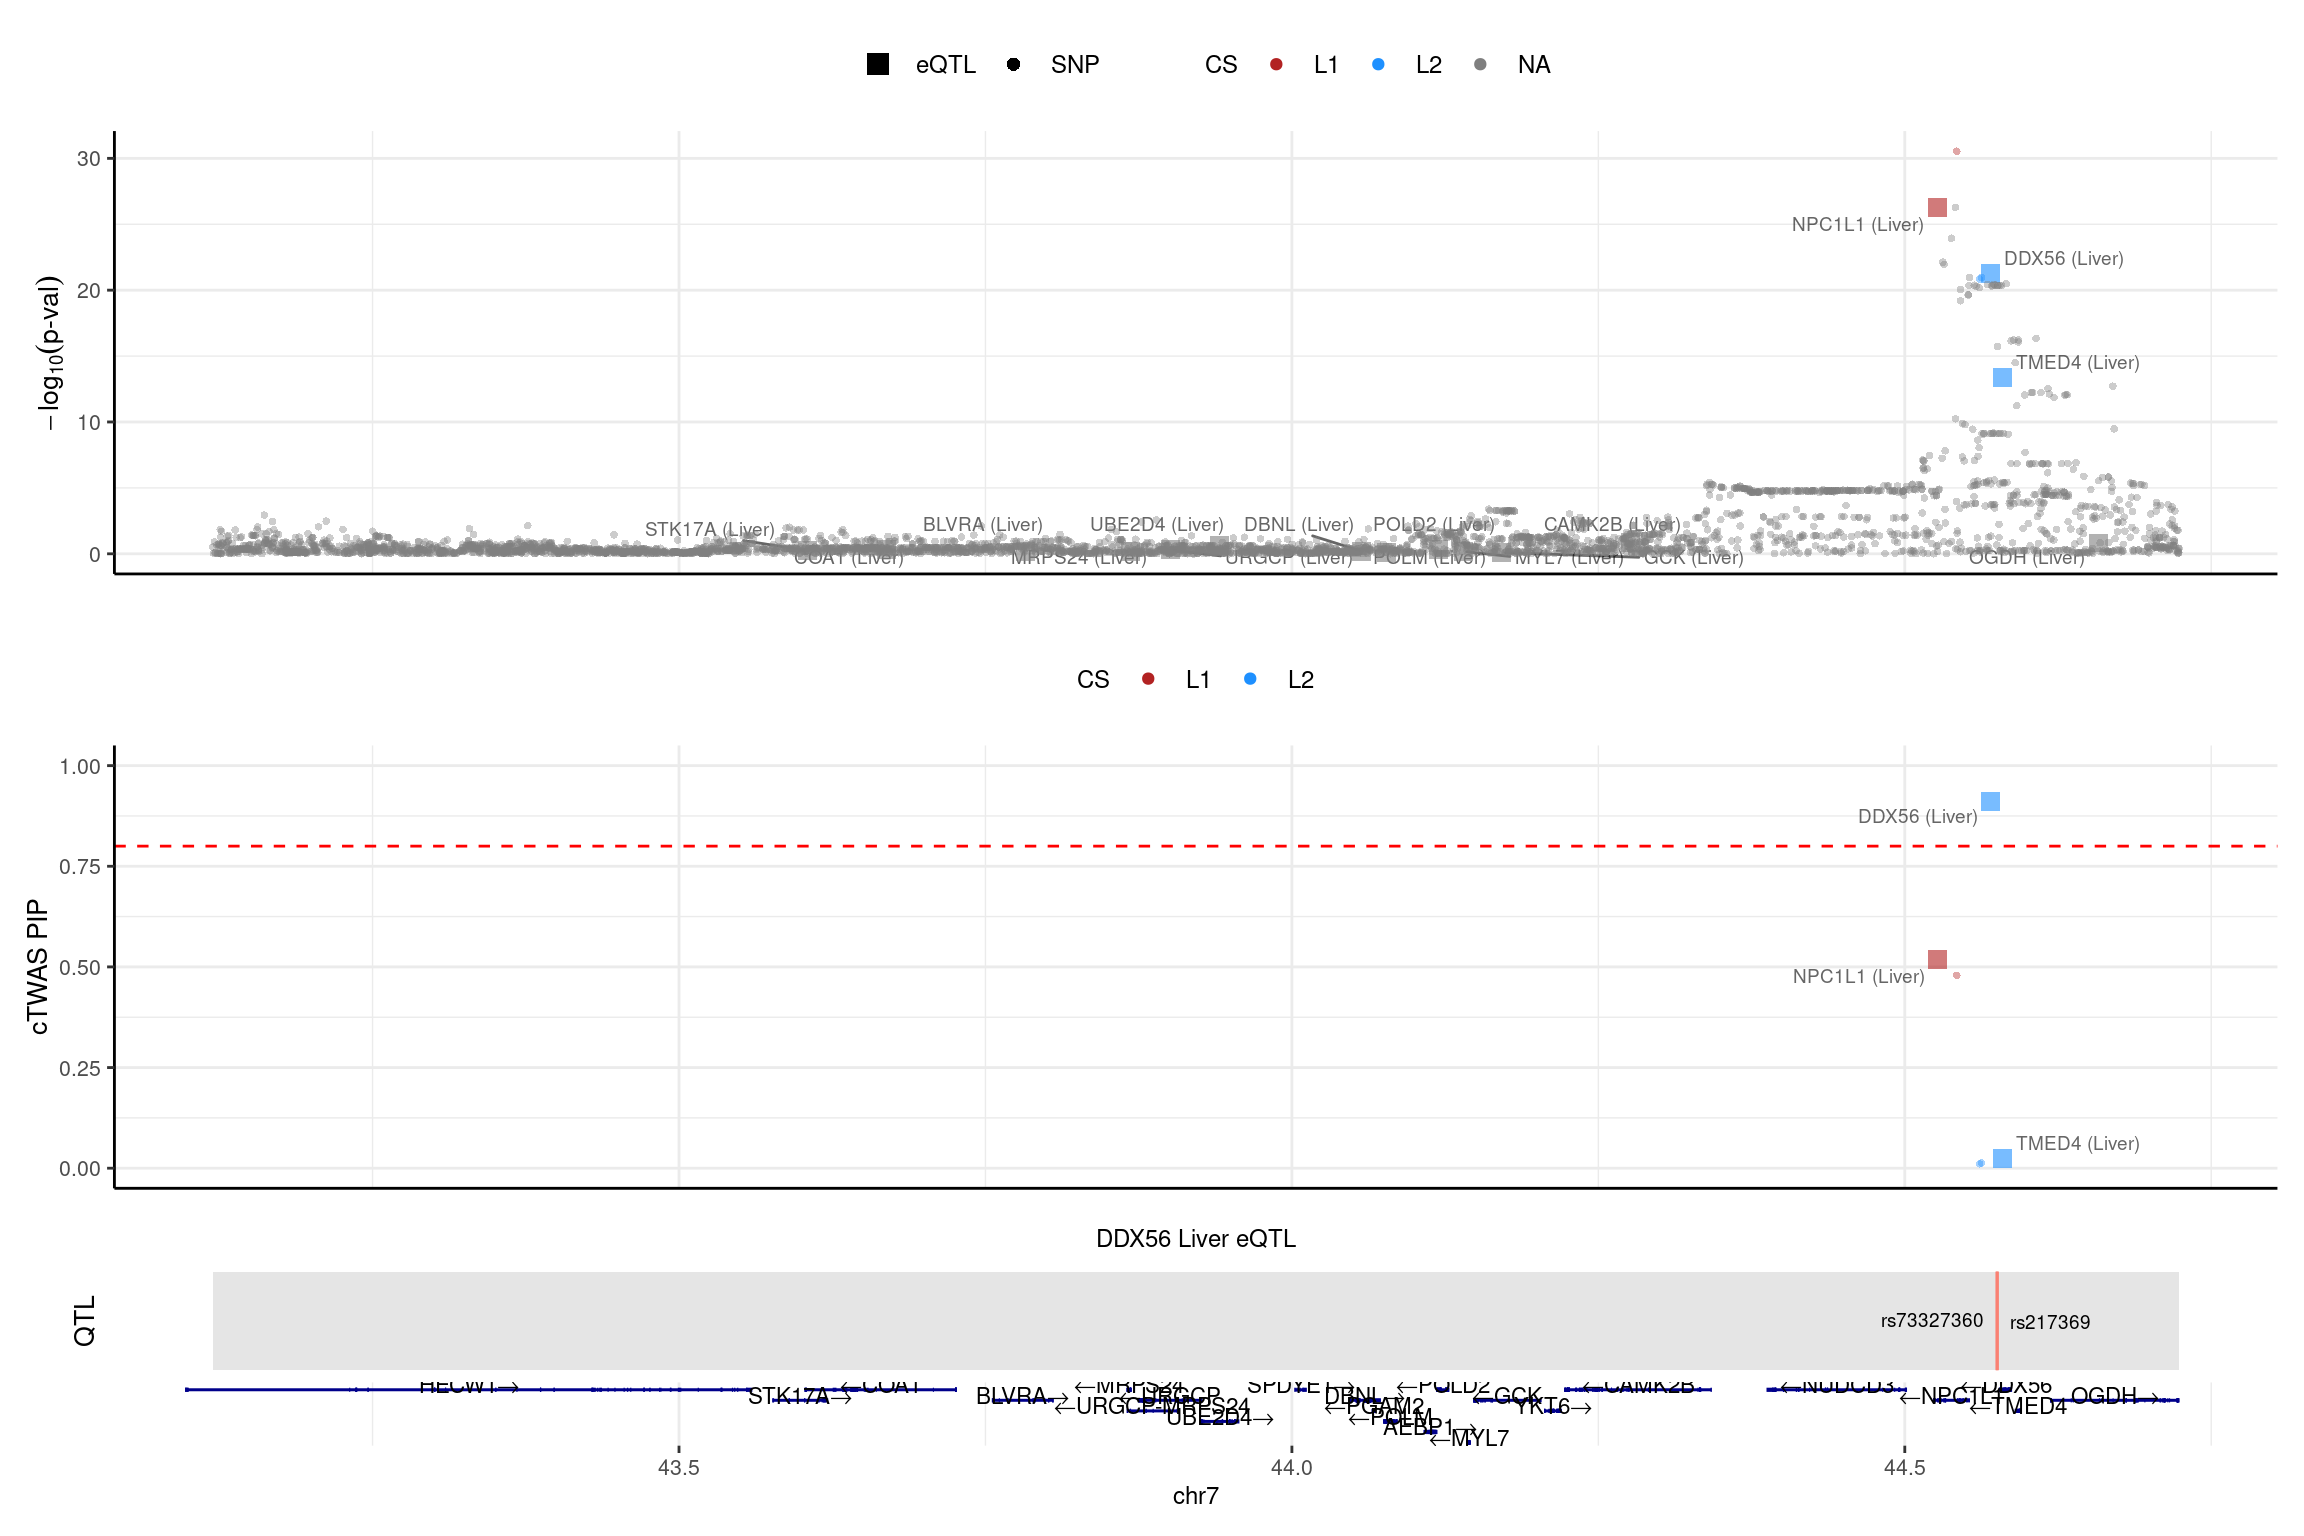
Checking why some silver standard genes are missed – single eQTL, L=5
LDL_silver_known_sig <- LDL_silver_known[as.numeric(LDL_silver_known$PIP) > 0.8 & LDL_silver_known$PIP !="NA",]
LDL_silver_known_sig <- LDL_silver_known_sig[,c("genename","cs_index","PIP","z","num_eqtl","region_tag")]
# check z_scores
z_gene_single_sharedvar_L5 <- readRDS(paste0(folder_single_results_L5,"/",trait,"/",trait,"_",tissue,".z_gene.RDS"))
z_gene_single_sharedvar_L5 <- z_gene_single_sharedvar_L5 %>%
  mutate(molecular_id = sub("\\|.*", "", id)) %>%  # Extract ENSG ID from id
  left_join(mapping_two %>% dplyr::select(molecular_id, gene_name), by = "molecular_id")
z_gene_single_sharedvar_L5 <- z_gene_single_sharedvar_L5[,c("gene_name","z")]
z_gene_selected_L5 <- z_gene_single_sharedvar_L5[z_gene_single_sharedvar_L5$gene_name %in% LDL_silver_known_sig$genename,]
LDL_silver_known_sig <- merge(LDL_silver_known_sig,z_gene_selected_L5, by.x ="genename", by.y = "gene_name",all.x=T)
region_info <- readRDS("/project2/xinhe/shared_data/multigroup_ctwas/LD_region_info/region_info.RDS")
combined_pip_by_group_single_nocs_L5 <- combine_gene_pips(susie_alpha_res_single_post_L5,
group_by = "gene_name",
by = "group",
method = "combine_cs",
filter_cs = F,
include_cs_id = T)
LDL_silver_known_sig <- merge(LDL_silver_known_sig, combined_pip_by_group_single_nocs_L5, by.x = "genename", by.y = "gene_name", all.x = T)
LDL_silver_known_sig <- LDL_silver_known_sig[,c("genename","cs_index","PIP","z.x","z.y","combined_cs_id","combined_pip")]
colnames(LDL_silver_known_sig) <- c("genename","cs_index_old","PIP_old","z_old","z_new","cs_id_new","PIP_new_L=5")
DT::datatable(LDL_silver_known_sig,caption = htmltools::tags$caption( style = 'caption-side: left; text-align: left; color:black; font-size:150% ;','Comparing the old results and new results (L=5) for the silver standard genes'),options = list(pageLength = 10) )print("ABCG8 weights")[1] "ABCG8 weights"weights_single_sharedvar_L5 <- readRDS(paste0(folder_single_results_L5,"/",trait,"/",trait,"_",tissue,".preprocessed.weights.E.RDS"))
weights_gene_L5 <- weights_single_sharedvar_L5[["ENSG00000143921.6"]]
print(weights_gene_L5)NULLsnp_map <- readRDS("/project2/xinhe/shared_data/multigroup_ctwas/LD_region_info/snp_map.RDS")
finemap_res_single_sharedvar_L5 <- ctwas_res_single_post_L5$finemap_res
finemap_res_single_sharedvar_L5 <- anno_finemap_res(finemap_res_single_sharedvar_L5,
snp_map = snp_map,
mapping_table = mapping_two,
add_gene_annot = TRUE,
map_by = "molecular_id",
drop_unmapped = TRUE,
add_position = TRUE,
use_gene_pos = "mid")2025-02-06 21:51:46 INFO::Annotating fine-mapping result ...
2025-02-06 21:51:46 INFO::Map molecular traits to genes
2025-02-06 21:51:49 INFO::Add gene positions
2025-02-06 21:51:49 INFO::Add SNP positionsprint("NPC1L1")[1] "NPC1L1"region_id <- "7_43119475_44724229"
make_locusplot(finemap_res_single_sharedvar_L5,
region_id = region_id,
ens_db = ens_db,
weights = weights_single_sharedvar_L5,
highlight_pip = 0.8,
filter_protein_coding_genes = TRUE,
filter_cs = TRUE,
color_pval_by = "cs",
color_pip_by = "cs",panel.heights = c(4,4,1,1))2025-02-06 21:52:05 INFO::Limit to protein coding genes
2025-02-06 21:52:05 INFO::focal id: ENSG00000136271.10|Liver_eQTL
2025-02-06 21:52:05 INFO::focal molecular trait: DDX56 Liver eQTL
2025-02-06 21:52:05 INFO::Range of locus: chr7:43119604-44723797
2025-02-06 21:52:05 INFO::focal molecular trait QTL positions: 44575121,44575587
2025-02-06 21:52:05 INFO::Limit PIPs to credible sets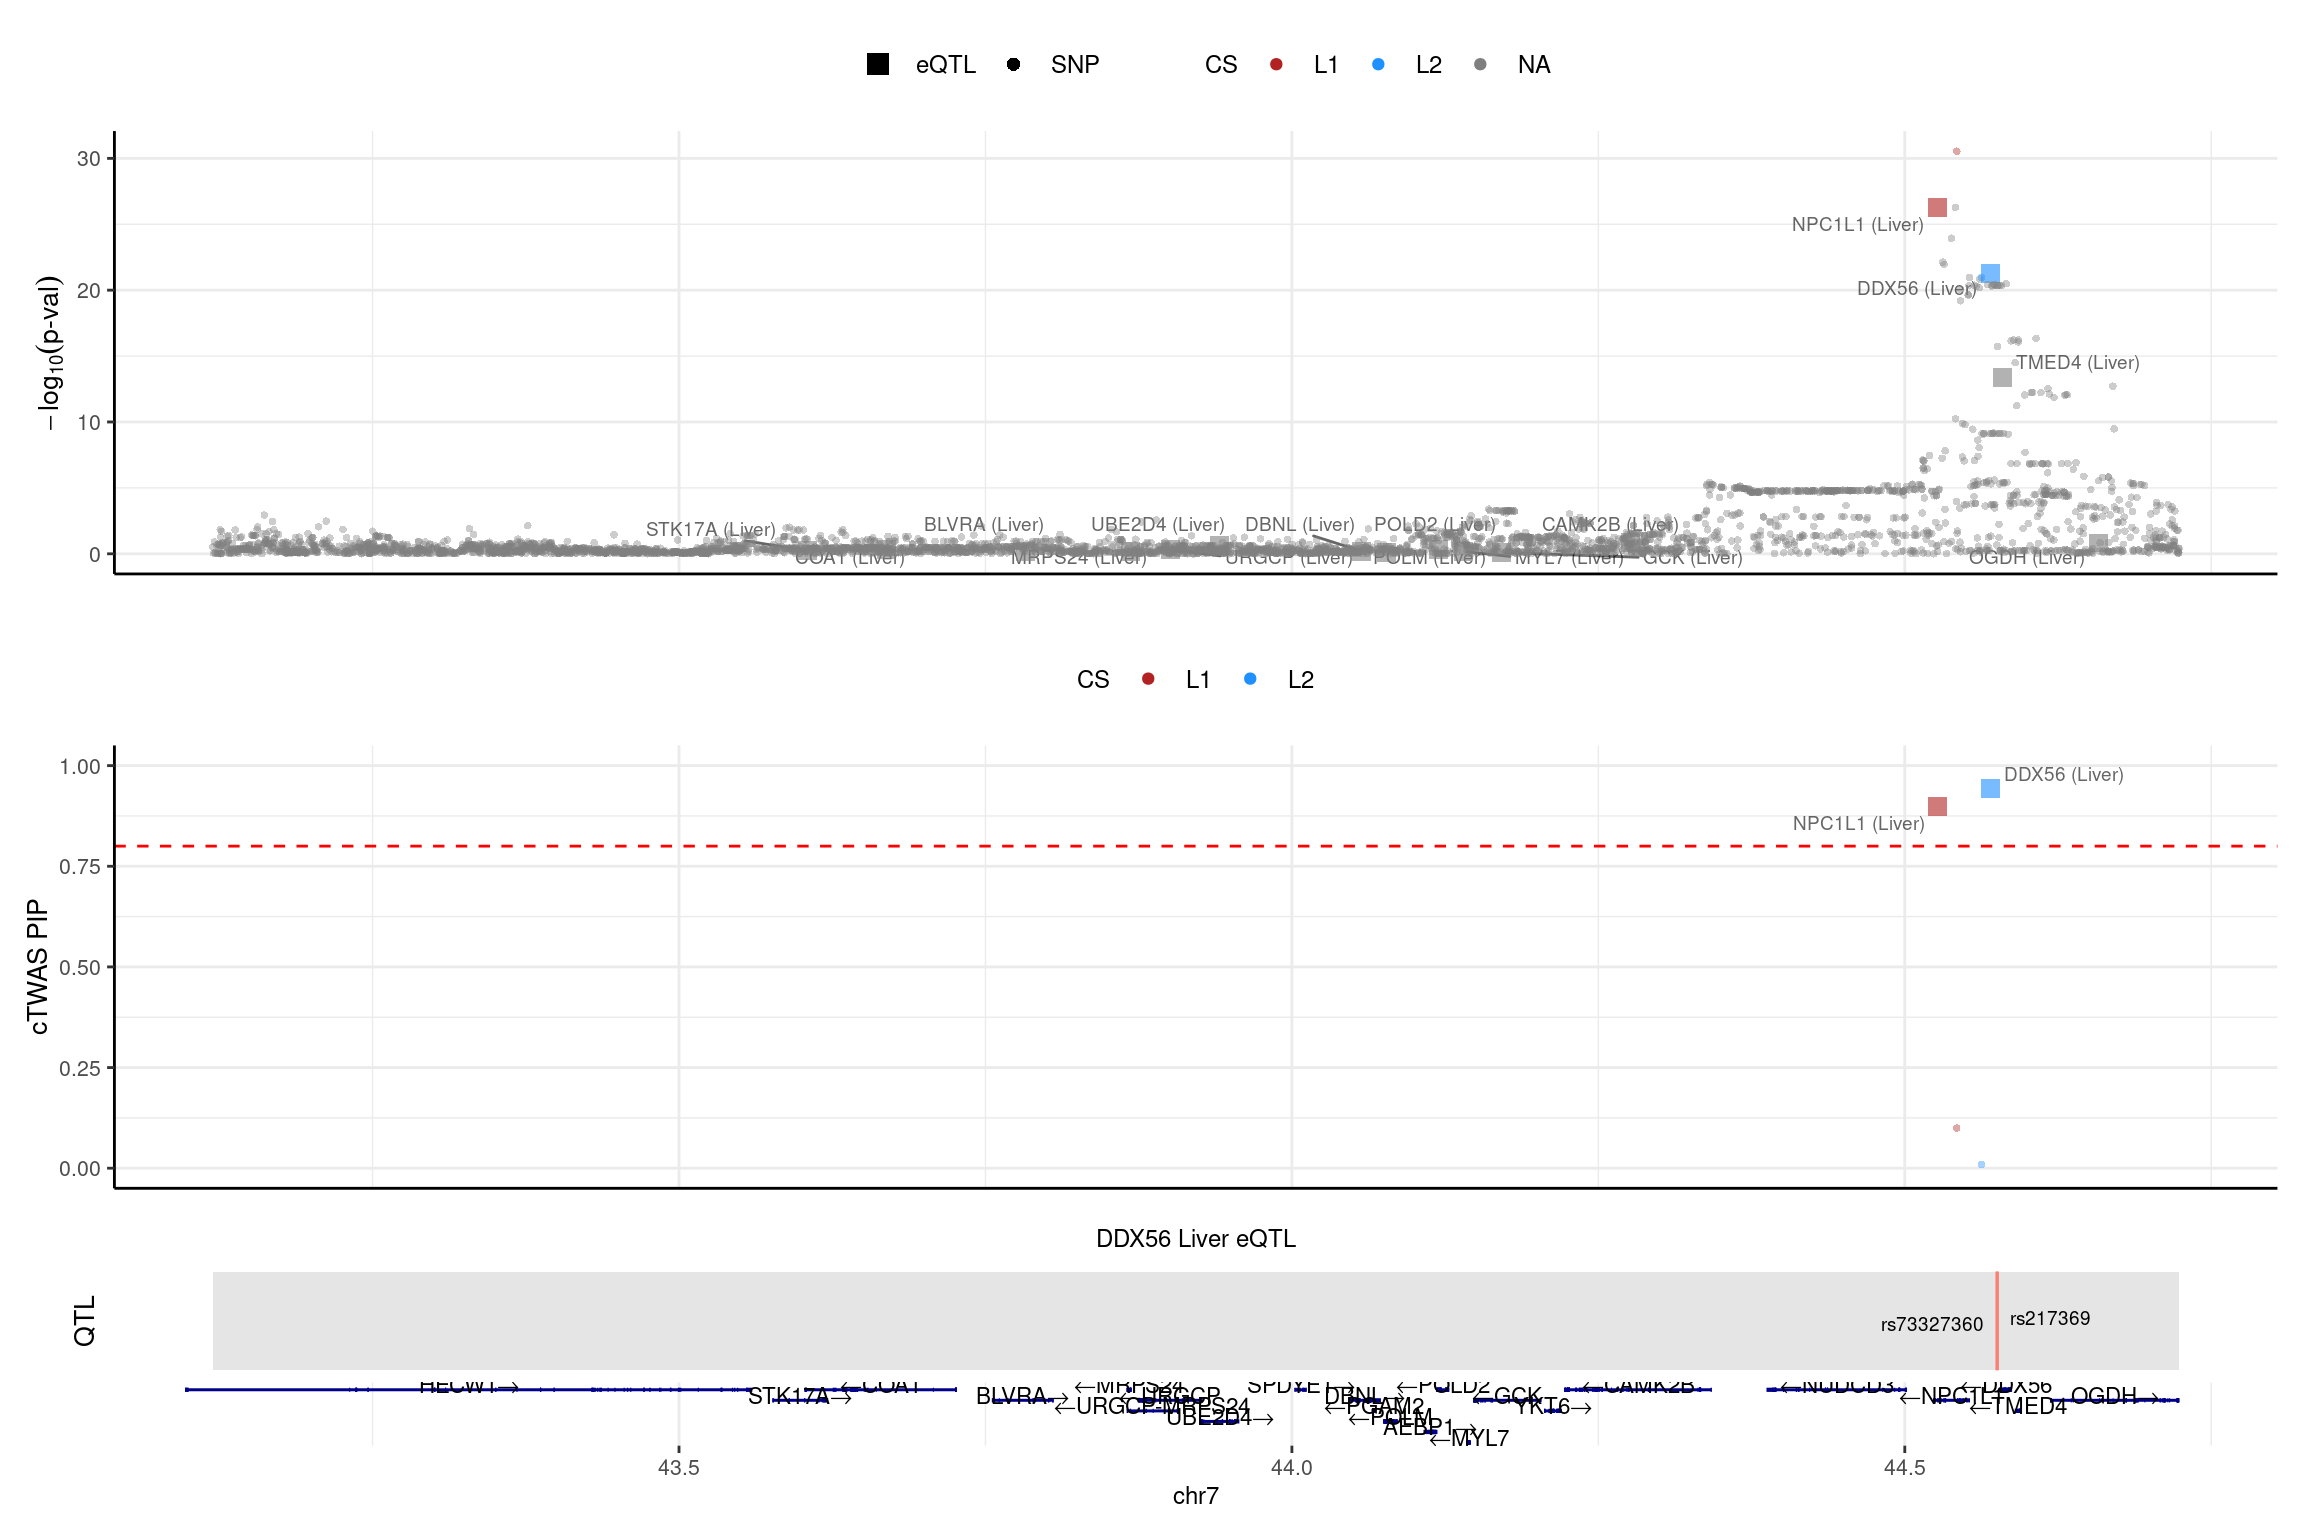
| Version | Author | Date |
|---|---|---|
| 0189bd3 | XSun | 2025-01-22 |
Comparing with bystander genes
Checking the bystander genes – single eQTL, L=5
LDL_silver_bystand_sig <- LDL_silver_bystand[as.numeric(LDL_silver_bystand$PIP) > 0.8 & LDL_silver_bystand$PIP !="NA",]
LDL_silver_bystand_sig <- LDL_silver_bystand_sig[,c("genename","cs_index","PIP","z","num_eqtl")]

LDL_silver_bystand_sig <- merge(LDL_silver_bystand_sig,z_gene_single_sharedvar_L5, by.x ="genename", by.y = "gene_name",all.x=T)

LDL_silver_bystand_sig <- merge(LDL_silver_bystand_sig, combined_pip_by_group_single_nocs_L5, by.x = "genename", by.y = "gene_name", all.x = T)

LDL_silver_bystand_sig <- LDL_silver_bystand_sig[,c("genename","cs_index","PIP","z.x","z.y","combined_cs_id","combined_pip")]
colnames(LDL_silver_bystand_sig) <- c("genename","cs_index_old","PIP_old","z_old","z_new","cs_id_new","PIP_new_L=5")

DT::datatable(LDL_silver_bystand_sig,caption = htmltools::tags$caption( style = 'caption-side: left; text-align: left; color:black; font-size:150% ;','Comparing the old results and new results (L=5) for the bystander genes'),options = list(pageLength = 10) )print("USP1")[1] "USP1"region_id <- "1_61456693_62989418"
make_locusplot(finemap_res_single_sharedvar_L5,
region_id = region_id,
ens_db = ens_db,
weights = weights_single_sharedvar_L5,
highlight_pip = 0.8,
filter_protein_coding_genes = TRUE,
filter_cs = TRUE,
color_pval_by = "cs",
color_pip_by = "cs",panel.heights = c(4,4,1,1))2025-02-06 21:52:07 INFO::Limit to protein coding genes
2025-02-06 21:52:07 INFO::focal id: ENSG00000162607.12|Liver_eQTL
2025-02-06 21:52:07 INFO::focal molecular trait: USP1 Liver eQTL
2025-02-06 21:52:07 INFO::Range of locus: chr1:61459304-62989160
2025-02-06 21:52:08 INFO::focal molecular trait QTL positions: 62436136
2025-02-06 21:52:08 INFO::Limit PIPs to credible sets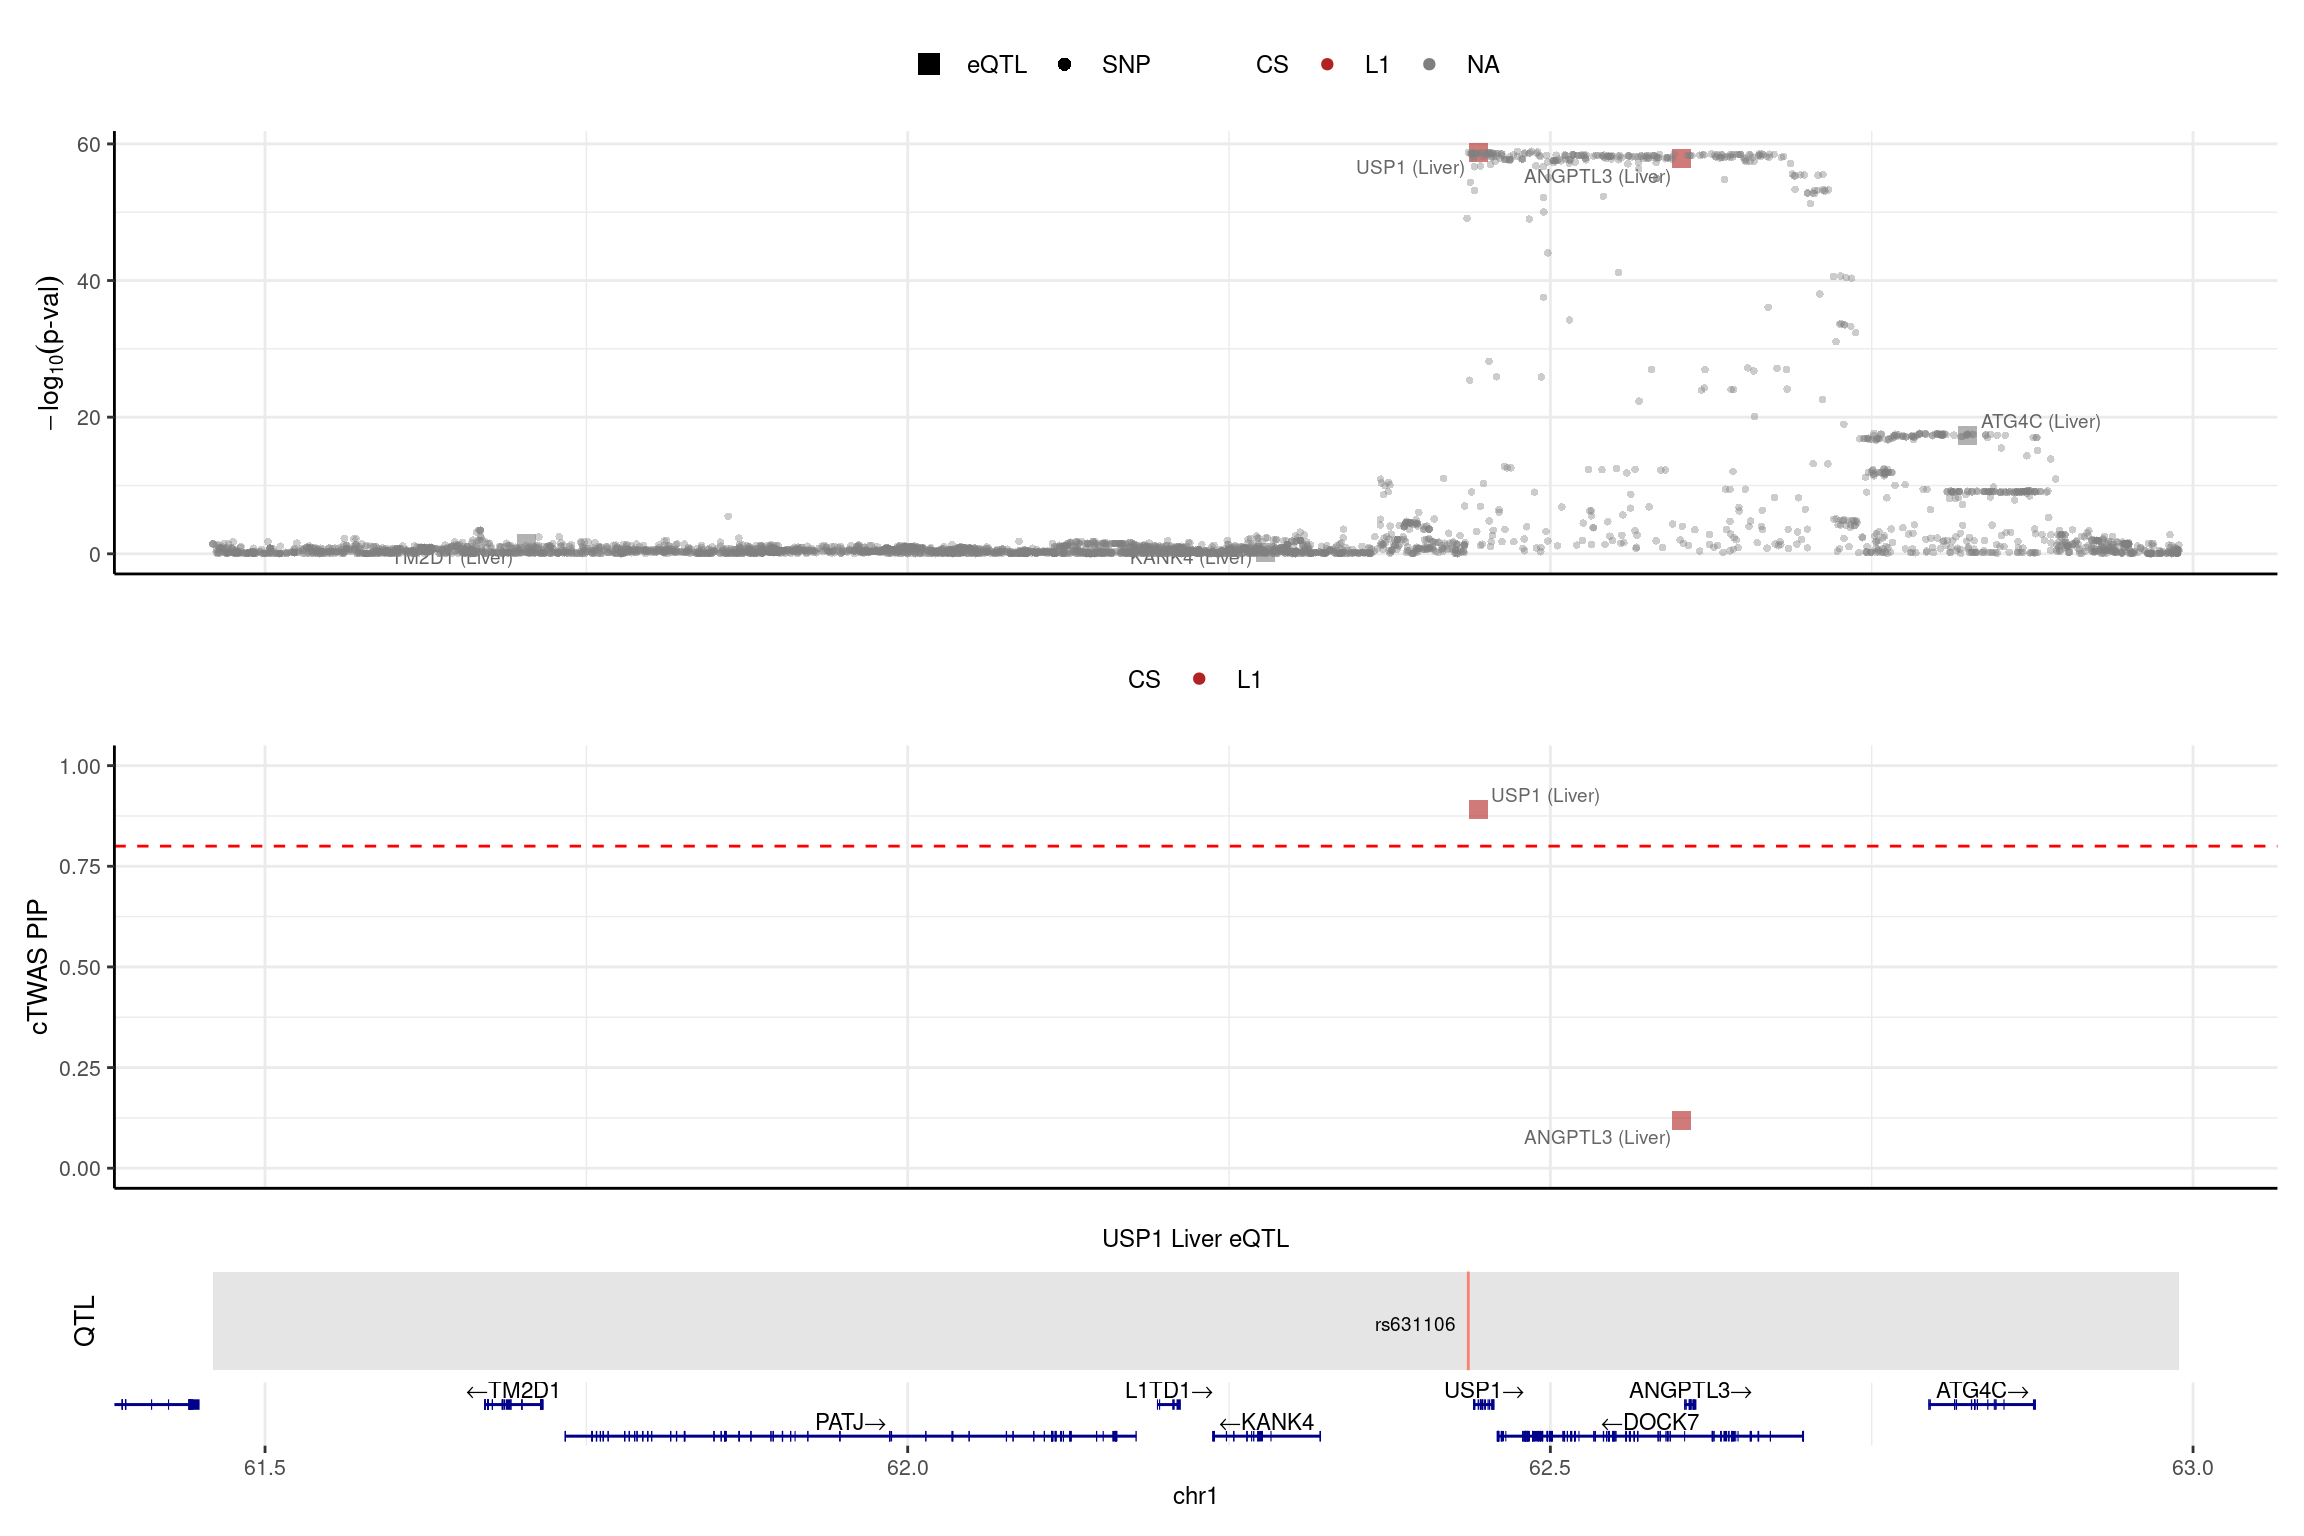
| Version | Author | Date |
|---|---|---|
| 0189bd3 | XSun | 2025-01-22 |
Checking the bystander genes – single eQTL, pre-estimate L
LDL_silver_bystand_sig <- LDL_silver_bystand[as.numeric(LDL_silver_bystand$PIP) > 0.8 & LDL_silver_bystand$PIP !="NA",]
LDL_silver_bystand_sig <- LDL_silver_bystand_sig[,c("genename","cs_index","PIP","z","num_eqtl")]

LDL_silver_bystand_sig <- merge(LDL_silver_bystand_sig,z_gene_single, by.x ="genename", by.y = "gene_name",all.x=T)

LDL_silver_bystand_sig <- merge(LDL_silver_bystand_sig, combined_pip_by_group_single_nocs, by.x = "genename", by.y = "gene_name", all.x = T)

LDL_silver_bystand_sig <- LDL_silver_bystand_sig[,c("genename","cs_index","PIP","z.x","z.y","combined_cs_id","combined_pip")]
colnames(LDL_silver_bystand_sig) <- c("genename","cs_index_old","PIP_old","z_old","z_new","cs_id_new","PIP_new_preL")

DT::datatable(LDL_silver_bystand_sig,caption = htmltools::tags$caption( style = 'caption-side: left; text-align: left; color:black; font-size:150% ;','Comparing the old results and new results (pre-estimate L) for the bystander genes'),options = list(pageLength = 10) )print("USP1")[1] "USP1"region_id <- "1_61456693_62989418"
make_locusplot(finemap_res_single,
region_id = region_id,
ens_db = ens_db,
weights = weights_single,
highlight_pip = 0.8,
filter_protein_coding_genes = TRUE,
filter_cs = TRUE,
color_pval_by = "cs",
color_pip_by = "cs",panel.heights = c(4,4,1,1))2025-02-06 21:52:09 INFO::Limit to protein coding genes
2025-02-06 21:52:09 INFO::focal id: ENSG00000162607.12|Liver_eQTL
2025-02-06 21:52:09 INFO::focal molecular trait: USP1 Liver eQTL
2025-02-06 21:52:09 INFO::Range of locus: chr1:61459304-62989160
2025-02-06 21:52:09 INFO::focal molecular trait QTL positions: 62436136
2025-02-06 21:52:09 INFO::Limit PIPs to credible sets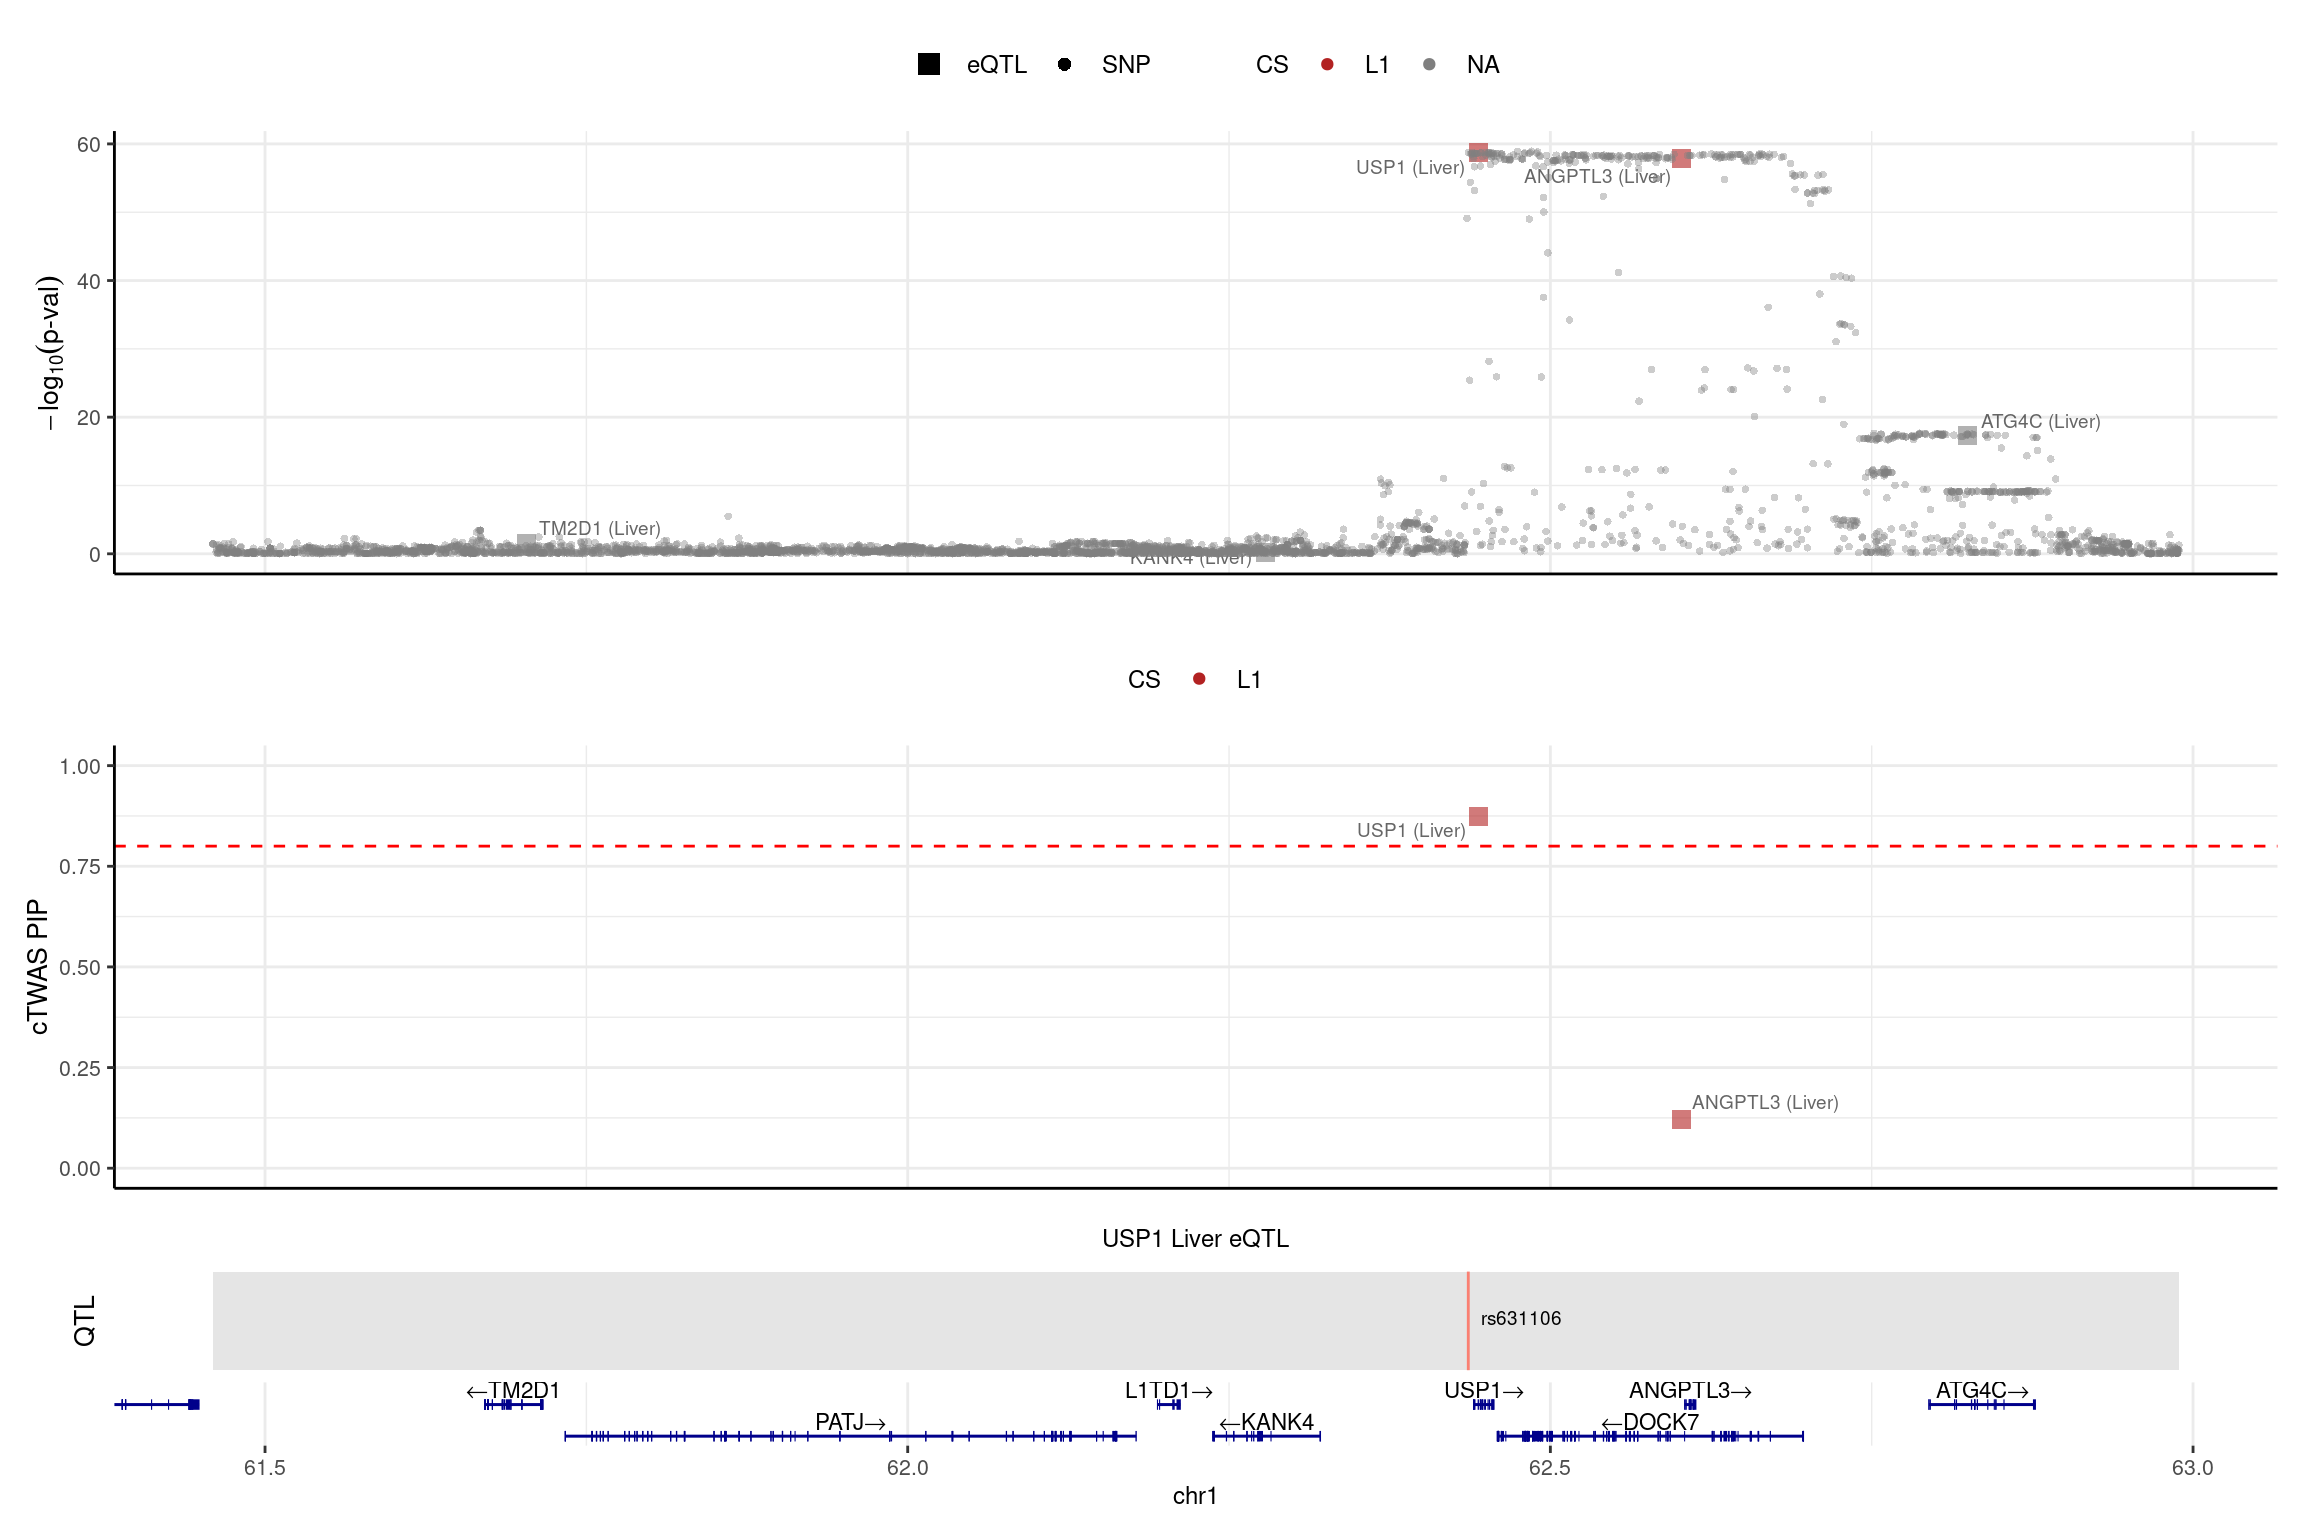
Comparing z-score and pip
finemap_res_single_gene <- finemap_res_single[finemap_res_single$type !="SNP",]
ggplot(finemap_res_single_gene, aes(y = susie_pip, x = abs(z))) +
  geom_point(alpha = 0.5, size = 0.5) +  # Adjust alpha and size for better visualization
  labs(x ="|Z|" , y = "SuSiE PIP", title = "single eqtl, pre-estimate L") +
  theme_minimal()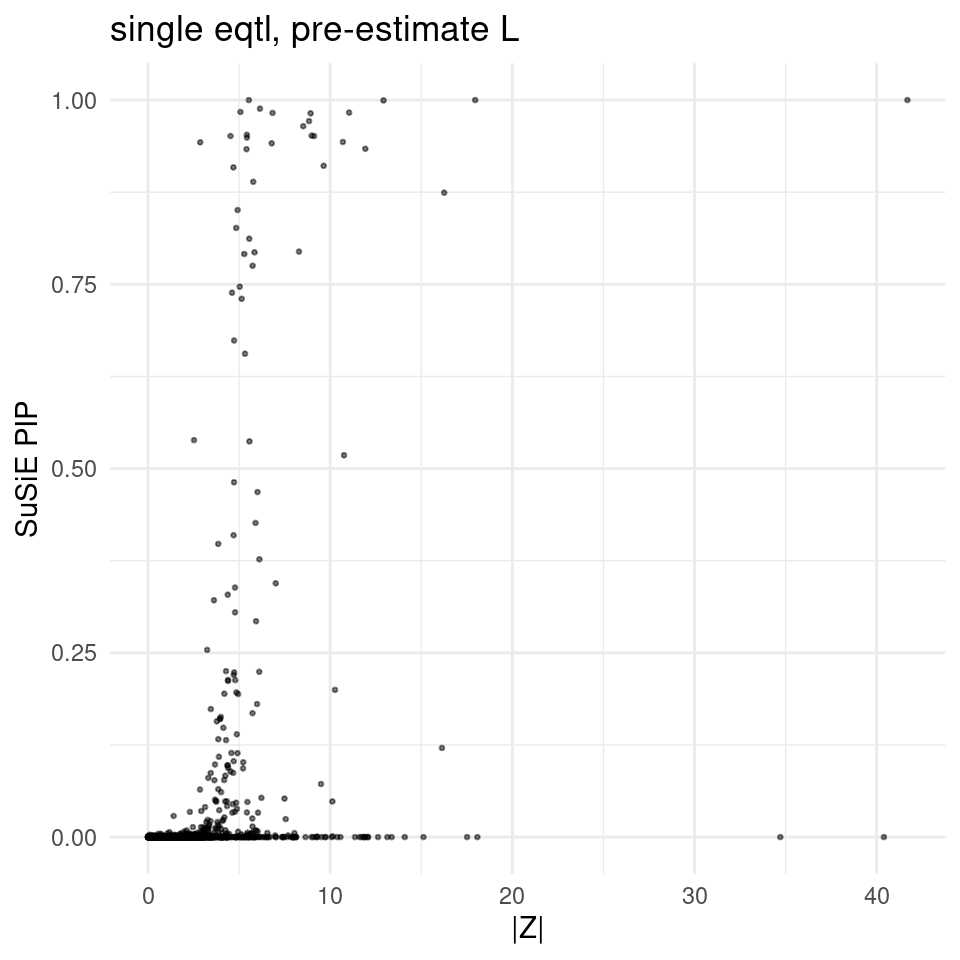
finemap_res_single_gene_L5 <- finemap_res_single_sharedvar_L5[finemap_res_single_sharedvar_L5$type !="SNP",]

ggplot(finemap_res_single_gene_L5, aes(y = susie_pip, x = abs(z))) +
  geom_point(alpha = 0.5, size = 0.5) +  # Adjust alpha and size for better visualization
  labs(x ="|Z|" , y = "SuSiE PIP", title = "single eqtl, L=5") +
  theme_minimal()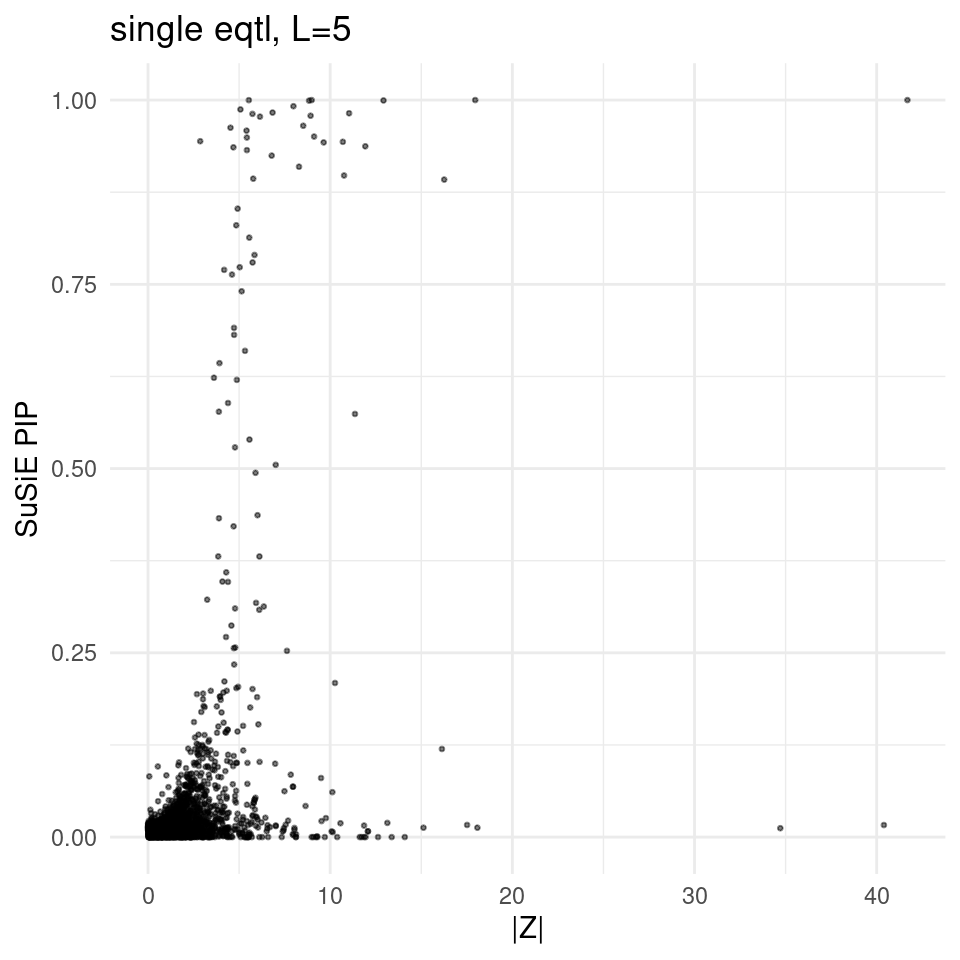
finemap_res_multi <- ctwas_res_multi_post$finemap_res
finemap_res_multi <- anno_finemap_res(finemap_res_multi,
                                          snp_map = snp_map,
                                          mapping_table = mapping_two,
                                          add_gene_annot = TRUE,
                                          map_by = "molecular_id",
                                          drop_unmapped = TRUE,
                                          add_position = TRUE,
                                          use_gene_pos = "mid")
2025-02-06 21:52:13 INFO::Annotating fine-mapping result ...
2025-02-06 21:52:13 INFO::Map molecular traits to genes
2025-02-06 21:52:14 INFO::Split PIPs for molecular traits mapped to multiple genes
2025-02-06 21:52:28 INFO::Add gene positions
2025-02-06 21:52:28 INFO::Add SNP positionsfinemap_res_multi_gene <- finemap_res_multi[finemap_res_multi$type !="SNP",]
ggplot(finemap_res_multi_gene, aes(y = susie_pip, x = abs(z))) +
geom_point(alpha = 0.5, size = 0.5) + # Adjust alpha and size for better visualization
labs(x ="|Z|" , y = "SuSiE PIP", title = "multigroup, QTL share variance ,pre-estimate L") +
theme_minimal()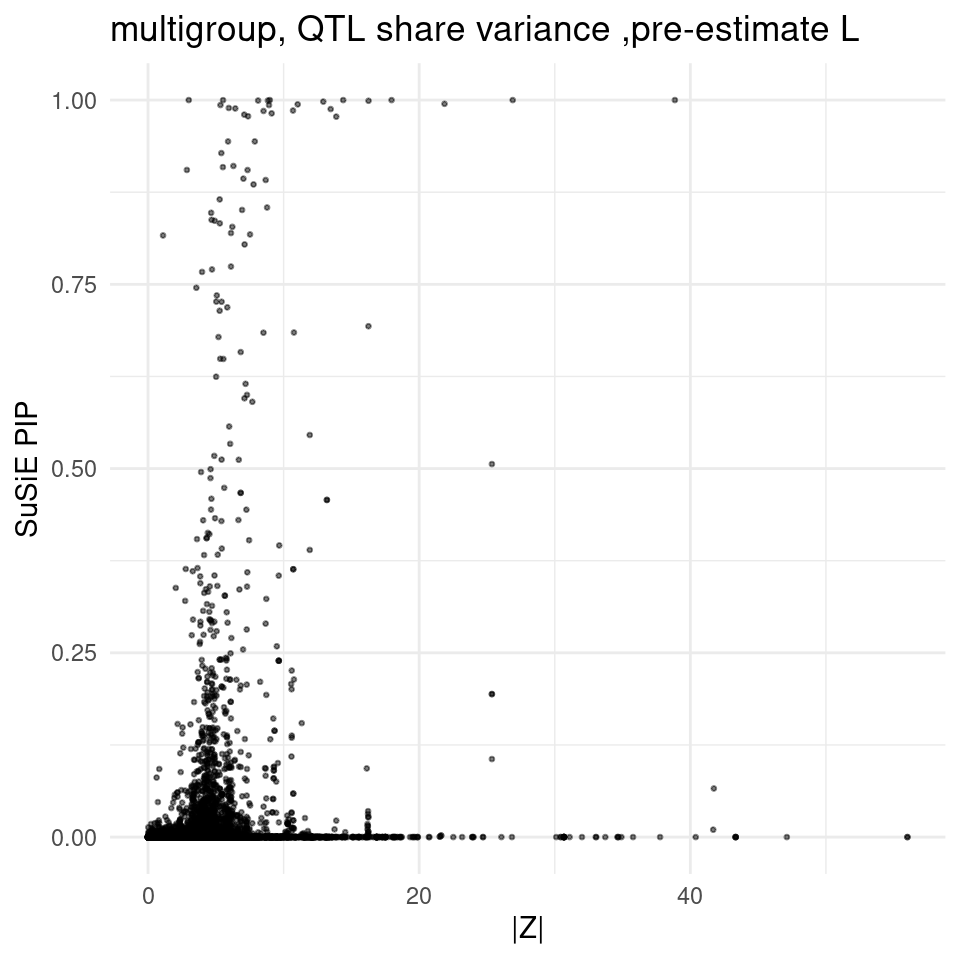
print(finemap_res_multi_gene[finemap_res_multi_gene$susie_pip>0.75 & abs(finemap_res_multi_gene$z) < 3,]) id
30466 ENSG00000137656.11|Esophagus_Gastroesophageal_Junction_eQTL
57524 ENSG00000183527.11|Liver_eQTL
molecular_id type context
30466 ENSG00000137656.11 eQTL Esophagus_Gastroesophageal_Junction
57524 ENSG00000183527.11 eQTL Liver
group region_id z
30466 Esophagus_Gastroesophageal_Junction|eQTL 11_116512631_117876395 1.106795
57524 Liver|eQTL 21_39110976_40017600 2.863432
susie_pip mu2 cs gene_name gene_type chrom start end
30466 0.8163390 126.6347 L2 BUD13 protein_coding 11 116748170 116772988
57524 0.9051927 897.7832 L1 PSMG1 protein_coding 21 39174769 39183851
pos
30466 116760579
57524 39179310weights_multi <- readRDS(paste0(folder_multi_results,"/",trait,"/",trait,".preprocessed.weights.RDS"))
region_id <- "11_116512631_117876395"
make_locusplot(finemap_res_multi,
region_id = region_id,
ens_db = ens_db,
weights = weights_multi,
highlight_pip = 0.8,
filter_protein_coding_genes = TRUE,
filter_cs = TRUE,
color_pval_by = "cs",
color_pip_by = "cs",panel.heights = c(4,4,1,1))2025-02-06 21:52:41 INFO::Limit to protein coding genes
2025-02-06 21:52:41 INFO::focal id: ENSG00000137656.11|Esophagus_Gastroesophageal_Junction_eQTL
2025-02-06 21:52:41 INFO::focal molecular trait: BUD13 Esophagus_Gastroesophageal_Junction eQTL
2025-02-06 21:52:41 INFO::Range of locus: chr11:116512531-117876126
2025-02-06 21:52:41 INFO::focal molecular trait QTL positions: 116772295
2025-02-06 21:52:41 INFO::Limit PIPs to credible sets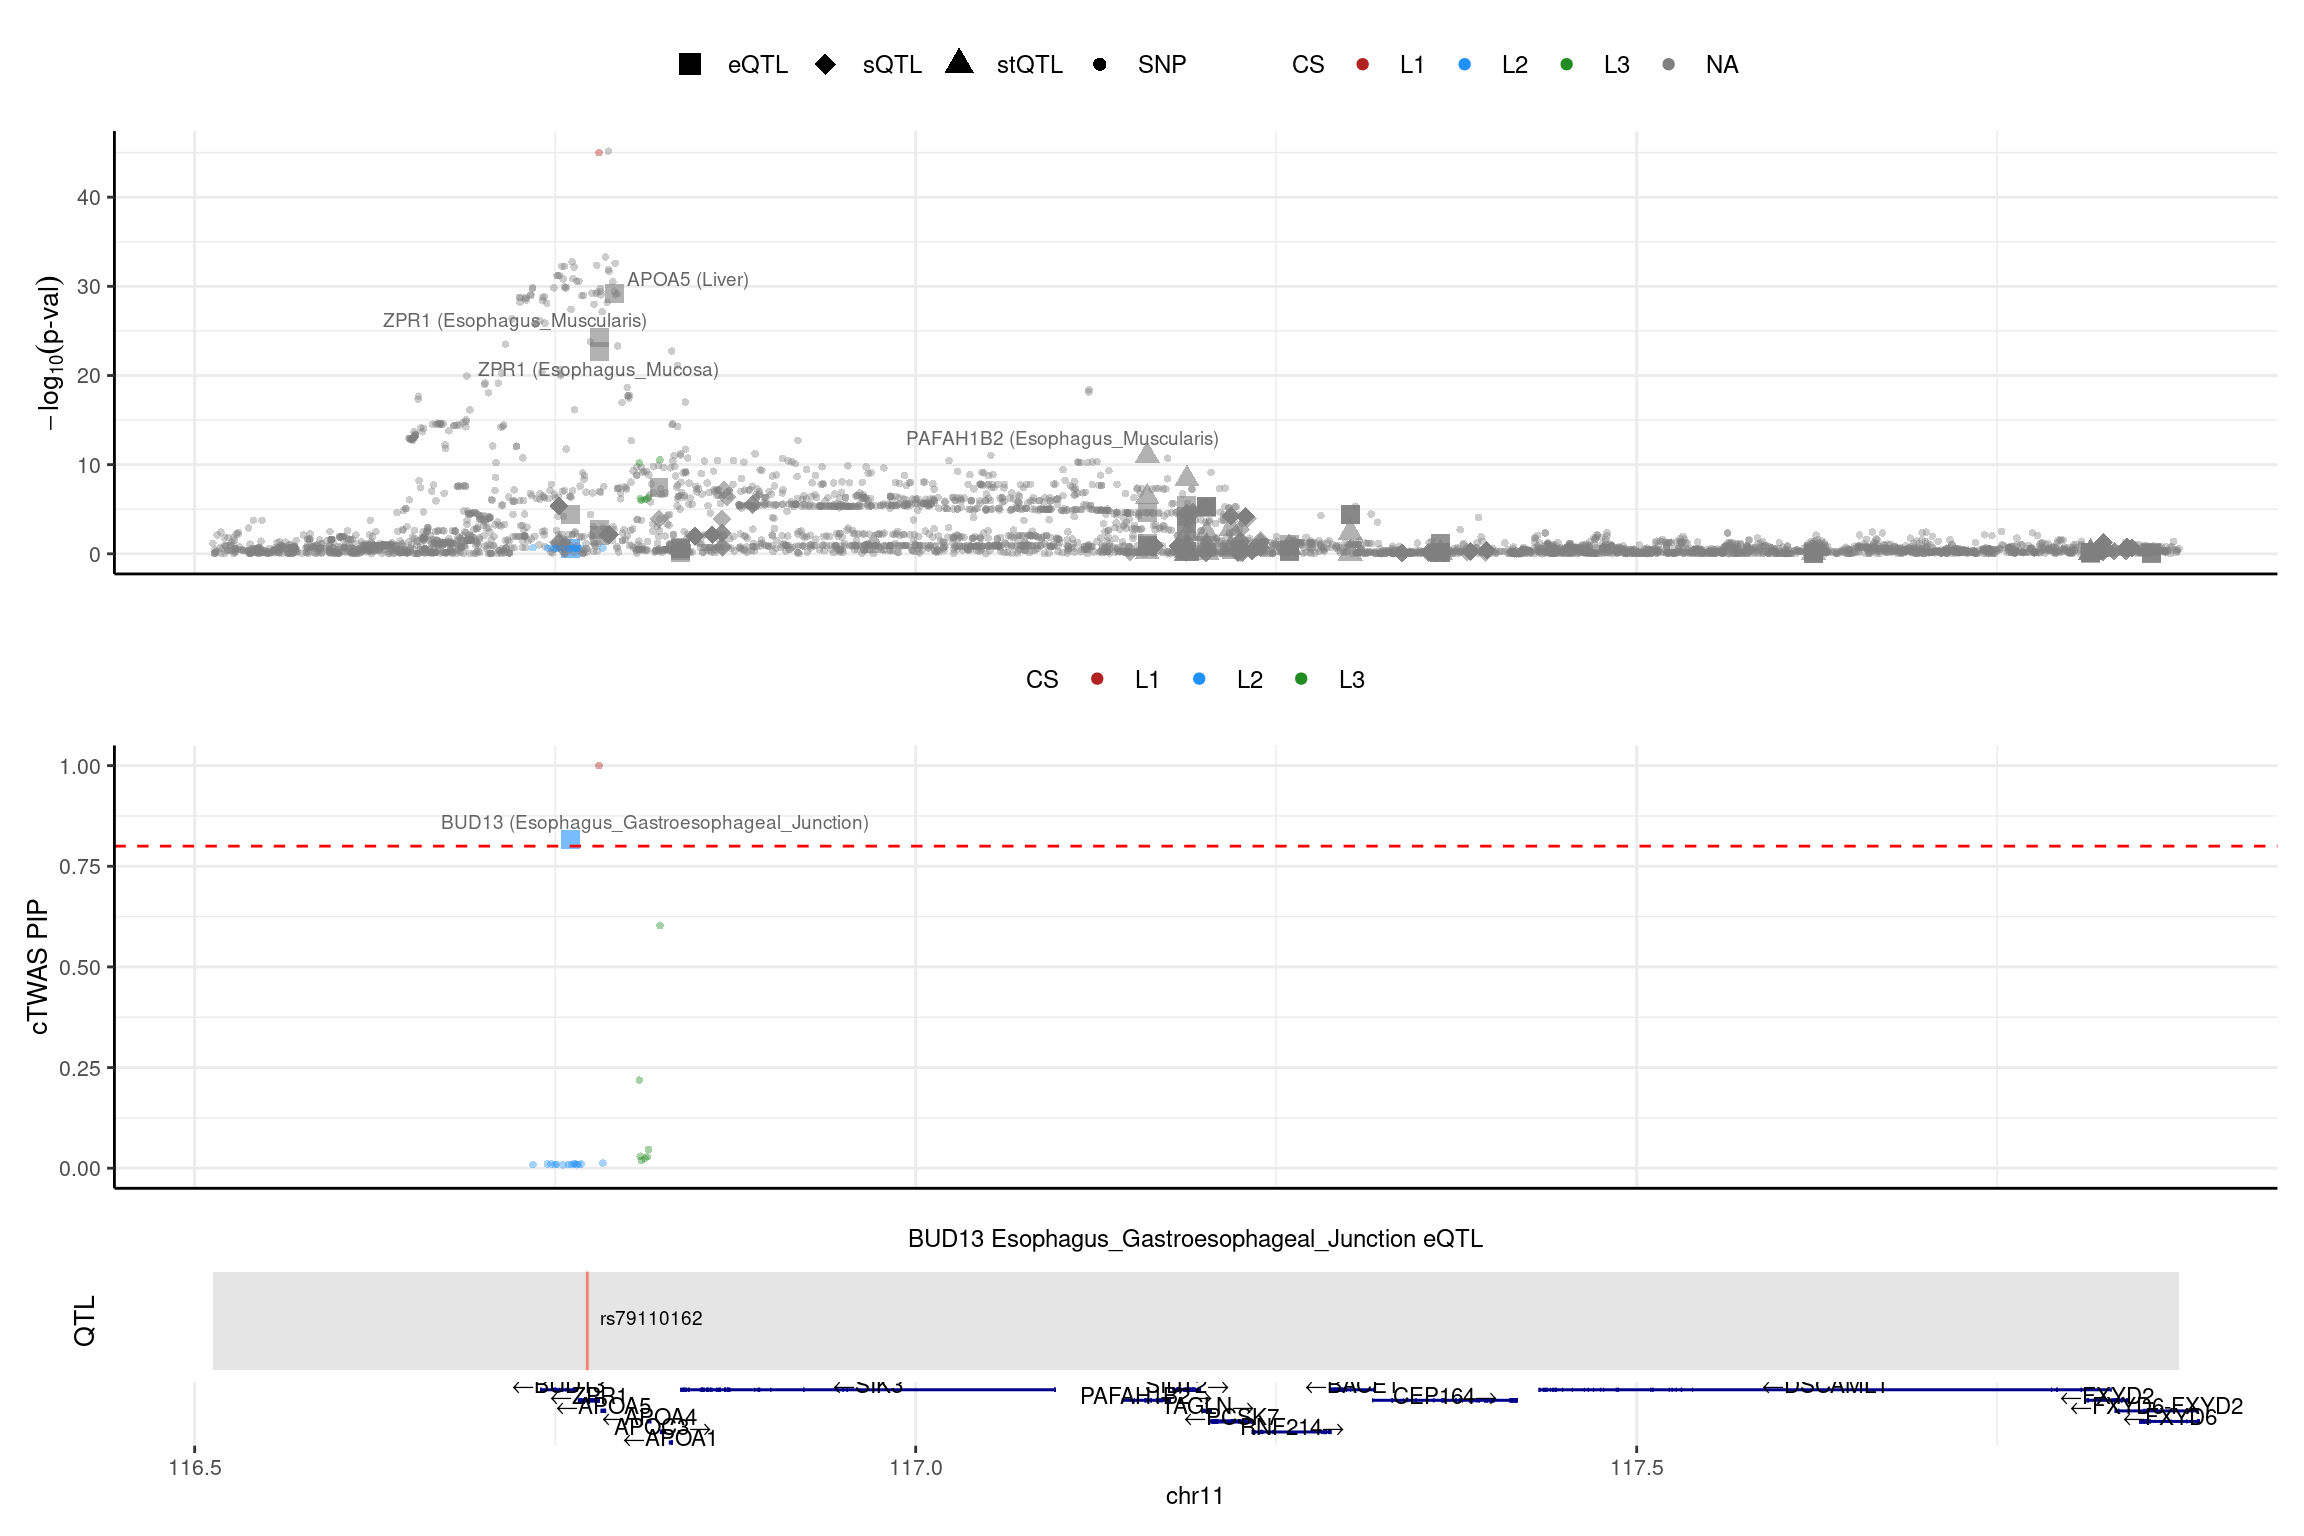
region_id <- "21_39110976_40017600"

make_locusplot(finemap_res_multi,
               region_id = region_id,
               ens_db = ens_db,
               weights = weights_multi,
               highlight_pip = 0.8,
               filter_protein_coding_genes = TRUE,
               filter_cs = TRUE,
               color_pval_by = "cs",
               color_pip_by = "cs",panel.heights = c(4,4,1,1))
2025-02-06 21:52:46 INFO::Limit to protein coding genes
2025-02-06 21:52:46 INFO::focal id: ENSG00000183527.11|Liver_eQTL
2025-02-06 21:52:46 INFO::focal molecular trait: PSMG1 Liver eQTL
2025-02-06 21:52:46 INFO::Range of locus: chr21:39111098-40017263
2025-02-06 21:52:46 INFO::focal molecular trait QTL positions: 39183566
2025-02-06 21:52:46 INFO::Limit PIPs to credible sets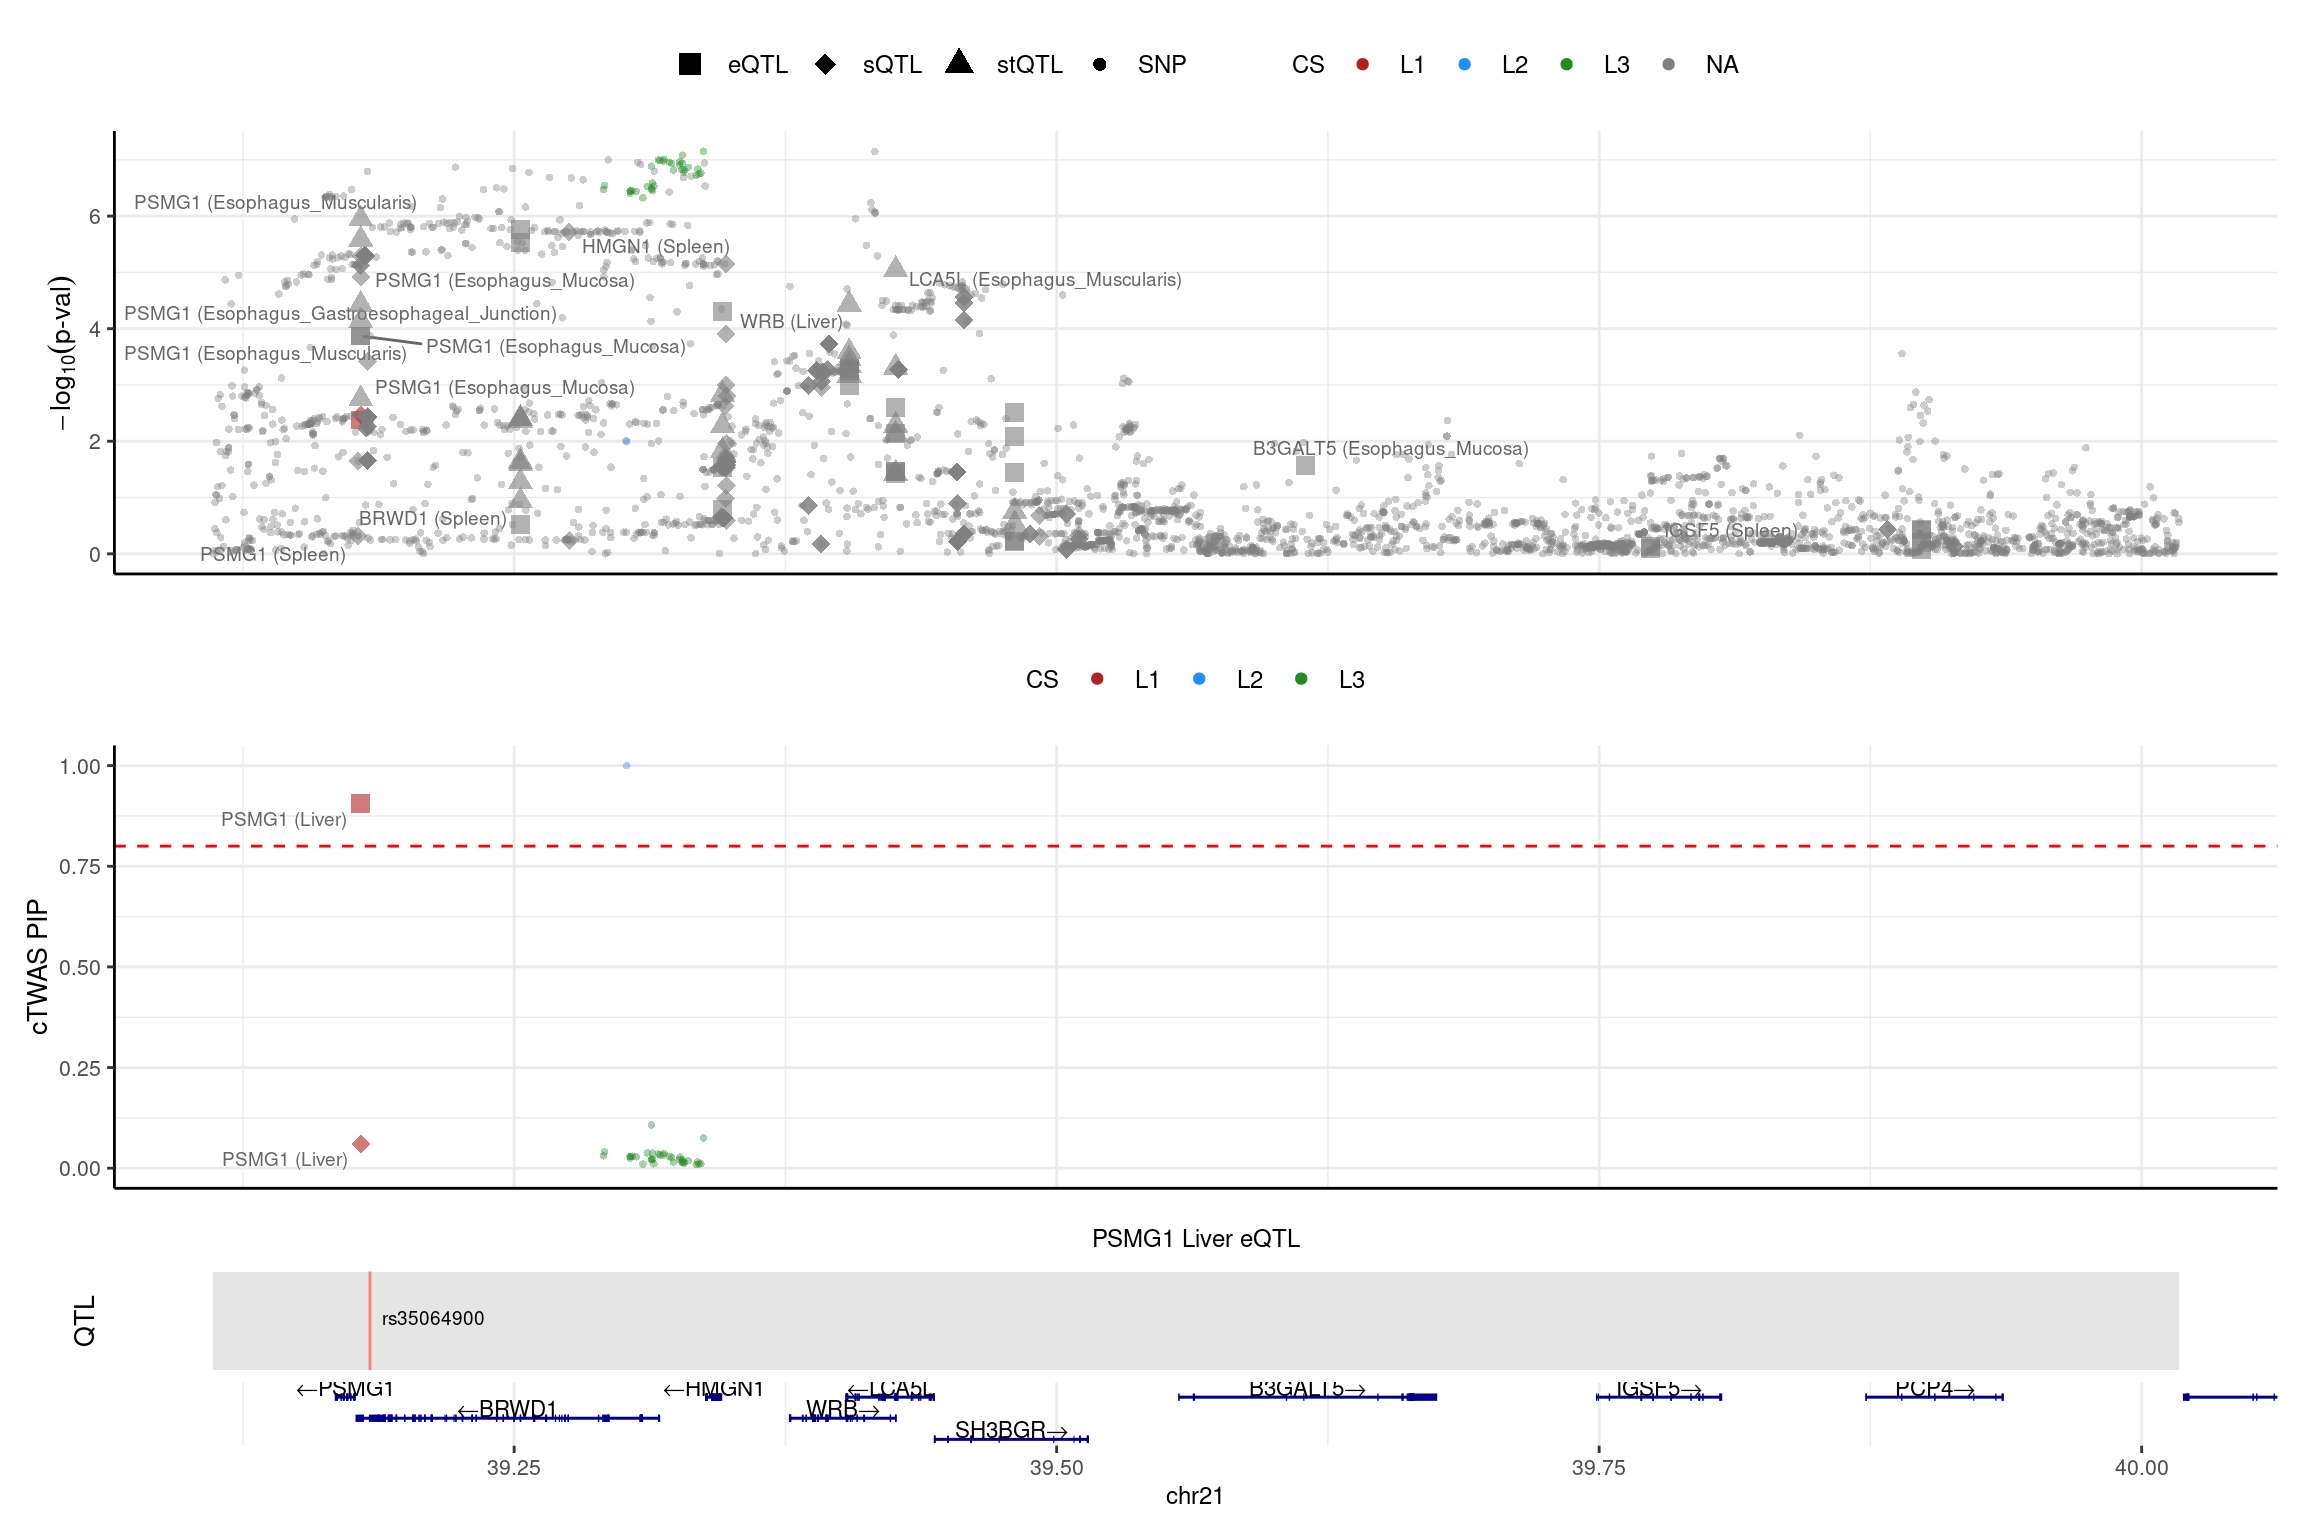
No LD mismatch issue detected for the 2 genes above.
finemap_res_multi_samevar <- ctwas_res_multi_post_samevar$finemap_res
finemap_res_multi_samevar <- anno_finemap_res(finemap_res_multi_samevar,
                                          snp_map = snp_map,
                                          mapping_table = mapping_two,
                                          add_gene_annot = TRUE,
                                          map_by = "molecular_id",
                                          drop_unmapped = TRUE,
                                          add_position = TRUE,
                                          use_gene_pos = "mid")
2025-02-06 21:52:49 INFO::Annotating fine-mapping result ...
2025-02-06 21:52:49 INFO::Map molecular traits to genes
2025-02-06 21:52:50 INFO::Split PIPs for molecular traits mapped to multiple genes
2025-02-06 21:52:57 INFO::Add gene positions
2025-02-06 21:52:57 INFO::Add SNP positionsfinemap_res_multi_samevar_gene <- finemap_res_multi_samevar[finemap_res_multi_samevar$type !="SNP",]
ggplot(finemap_res_multi_samevar_gene, aes(y = susie_pip, x = abs(z))) +
geom_point(alpha = 0.5, size = 0.5) + # Adjust alpha and size for better visualization
labs(x ="|Z|" , y = "SuSiE PIP", title = "multigroup, all groups share variance, pre-estimate L") +
theme_minimal()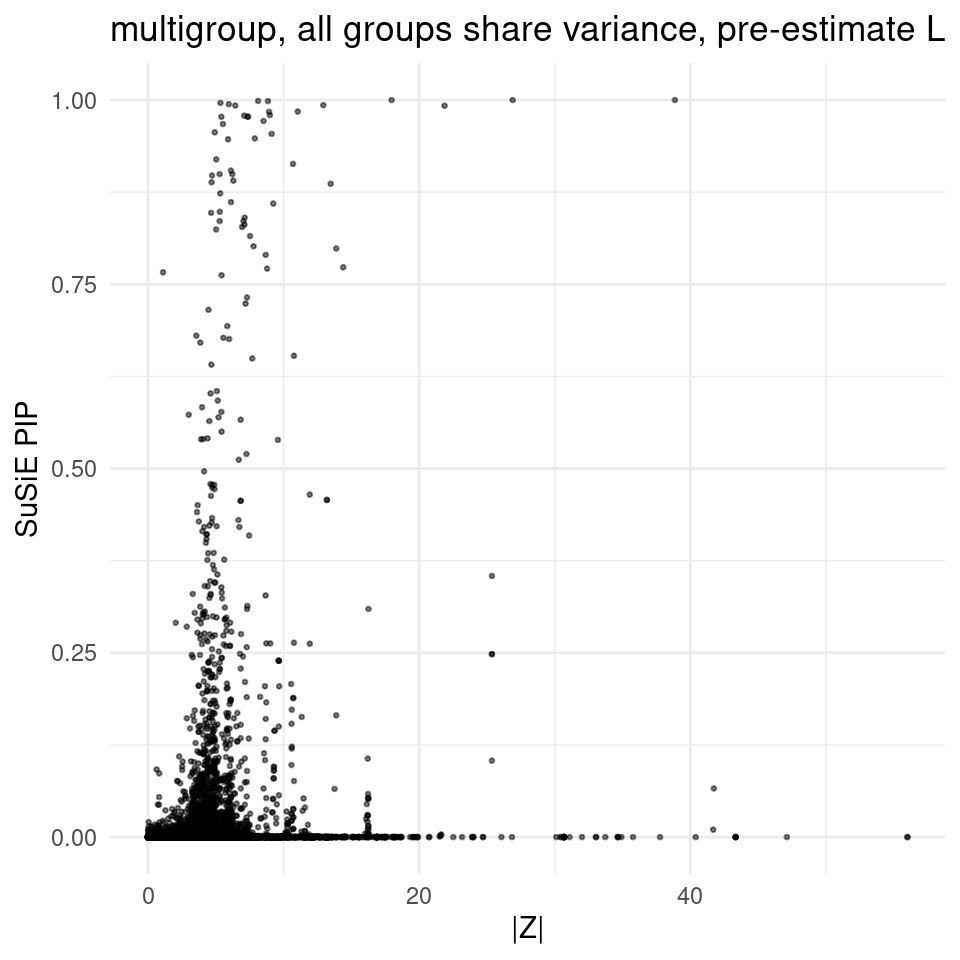
finemap_res_multi_L5 <- ctwas_res_multi_post_L5$finemap_res
finemap_res_multi_L5 <- anno_finemap_res(finemap_res_multi_L5,
                                          snp_map = snp_map,
                                          mapping_table = mapping_two,
                                          add_gene_annot = TRUE,
                                          map_by = "molecular_id",
                                          drop_unmapped = TRUE,
                                          add_position = TRUE,
                                          use_gene_pos = "mid")
2025-02-06 21:53:15 INFO::Annotating fine-mapping result ...
2025-02-06 21:53:15 INFO::Map molecular traits to genes
2025-02-06 21:53:16 INFO::Split PIPs for molecular traits mapped to multiple genes
2025-02-06 21:53:22 INFO::Add gene positions
2025-02-06 21:53:22 INFO::Add SNP positionsfinemap_res_multi_L5_gene <- finemap_res_multi_L5[finemap_res_multi_L5$type !="SNP",]
ggplot(finemap_res_multi_L5_gene, aes(y = susie_pip, x = abs(z))) +
geom_point(alpha = 0.5, size = 0.5) + # Adjust alpha and size for better visualization
labs(x ="|Z|" , y = "SuSiE PIP", title = "multigroup, all groups share variance, L = 5") +
theme_minimal()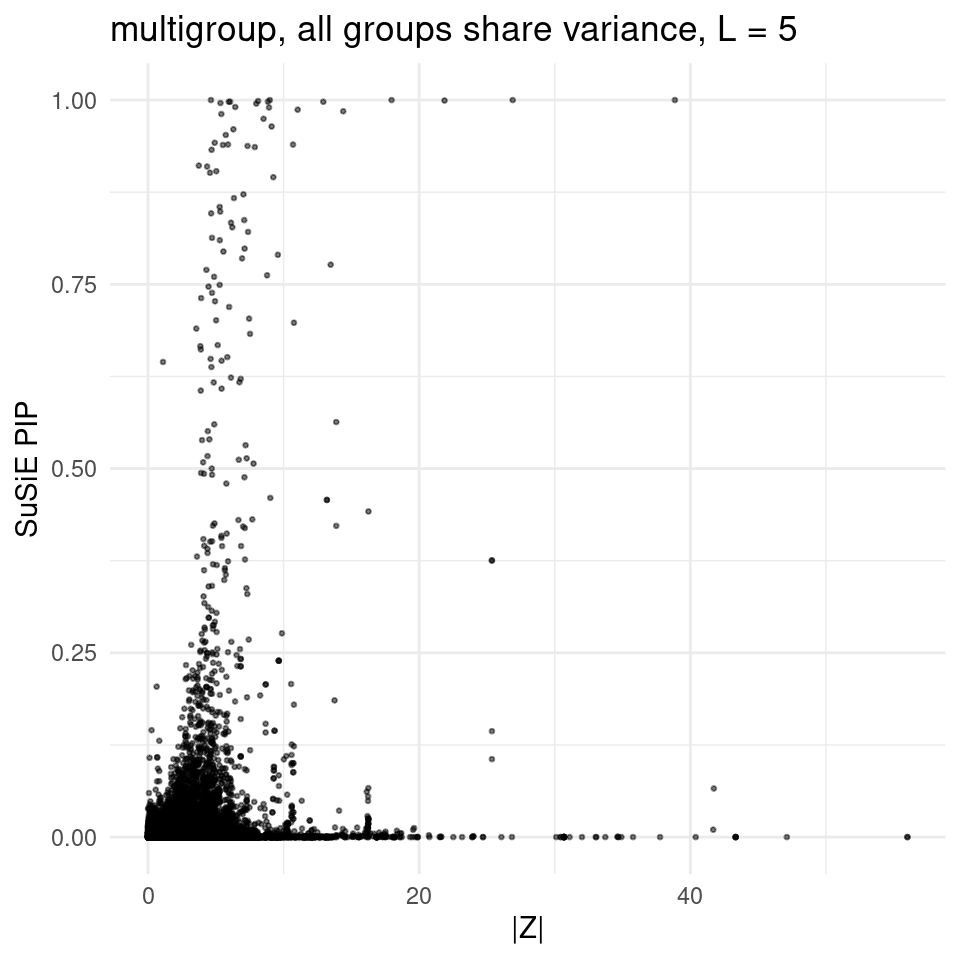
print(finemap_res_multi_L5_gene[finemap_res_multi_L5_gene$susie_pip>0.75 & abs(finemap_res_multi_L5_gene$z) < 3,]) [1] id molecular_id type context group
[6] region_id z susie_pip mu2 cs
[11] gene_name gene_type chrom start end
[16] pos
<0 rows> (or 0-length row.names)weights_multi_L5 <- readRDS(paste0(folder_multi_results_L5,"/",trait,"/",trait,".preprocessed.weights.RDS"))
region_id <- "2_117609890_120546207"
make_locusplot(finemap_res_multi_L5,
region_id = region_id,
ens_db = ens_db,
weights = weights_multi_L5,
highlight_pip = 0.8,
filter_protein_coding_genes = TRUE,
filter_cs = TRUE,
color_pval_by = "cs",
color_pip_by = "cs",panel.heights = c(4,4,1,1))2025-02-06 21:53:40 INFO::Limit to protein coding genes
2025-02-06 21:53:40 INFO::focal id: ENSG00000125629.14|Liver_eQTL
2025-02-06 21:53:40 INFO::focal molecular trait: INSIG2 Liver eQTL
2025-02-06 21:53:40 INFO::Range of locus: chr2:117610088-120545764
2025-02-06 21:53:41 INFO::focal molecular trait QTL positions: 118088372,118089309,118089394
2025-02-06 21:53:41 INFO::Limit PIPs to credible sets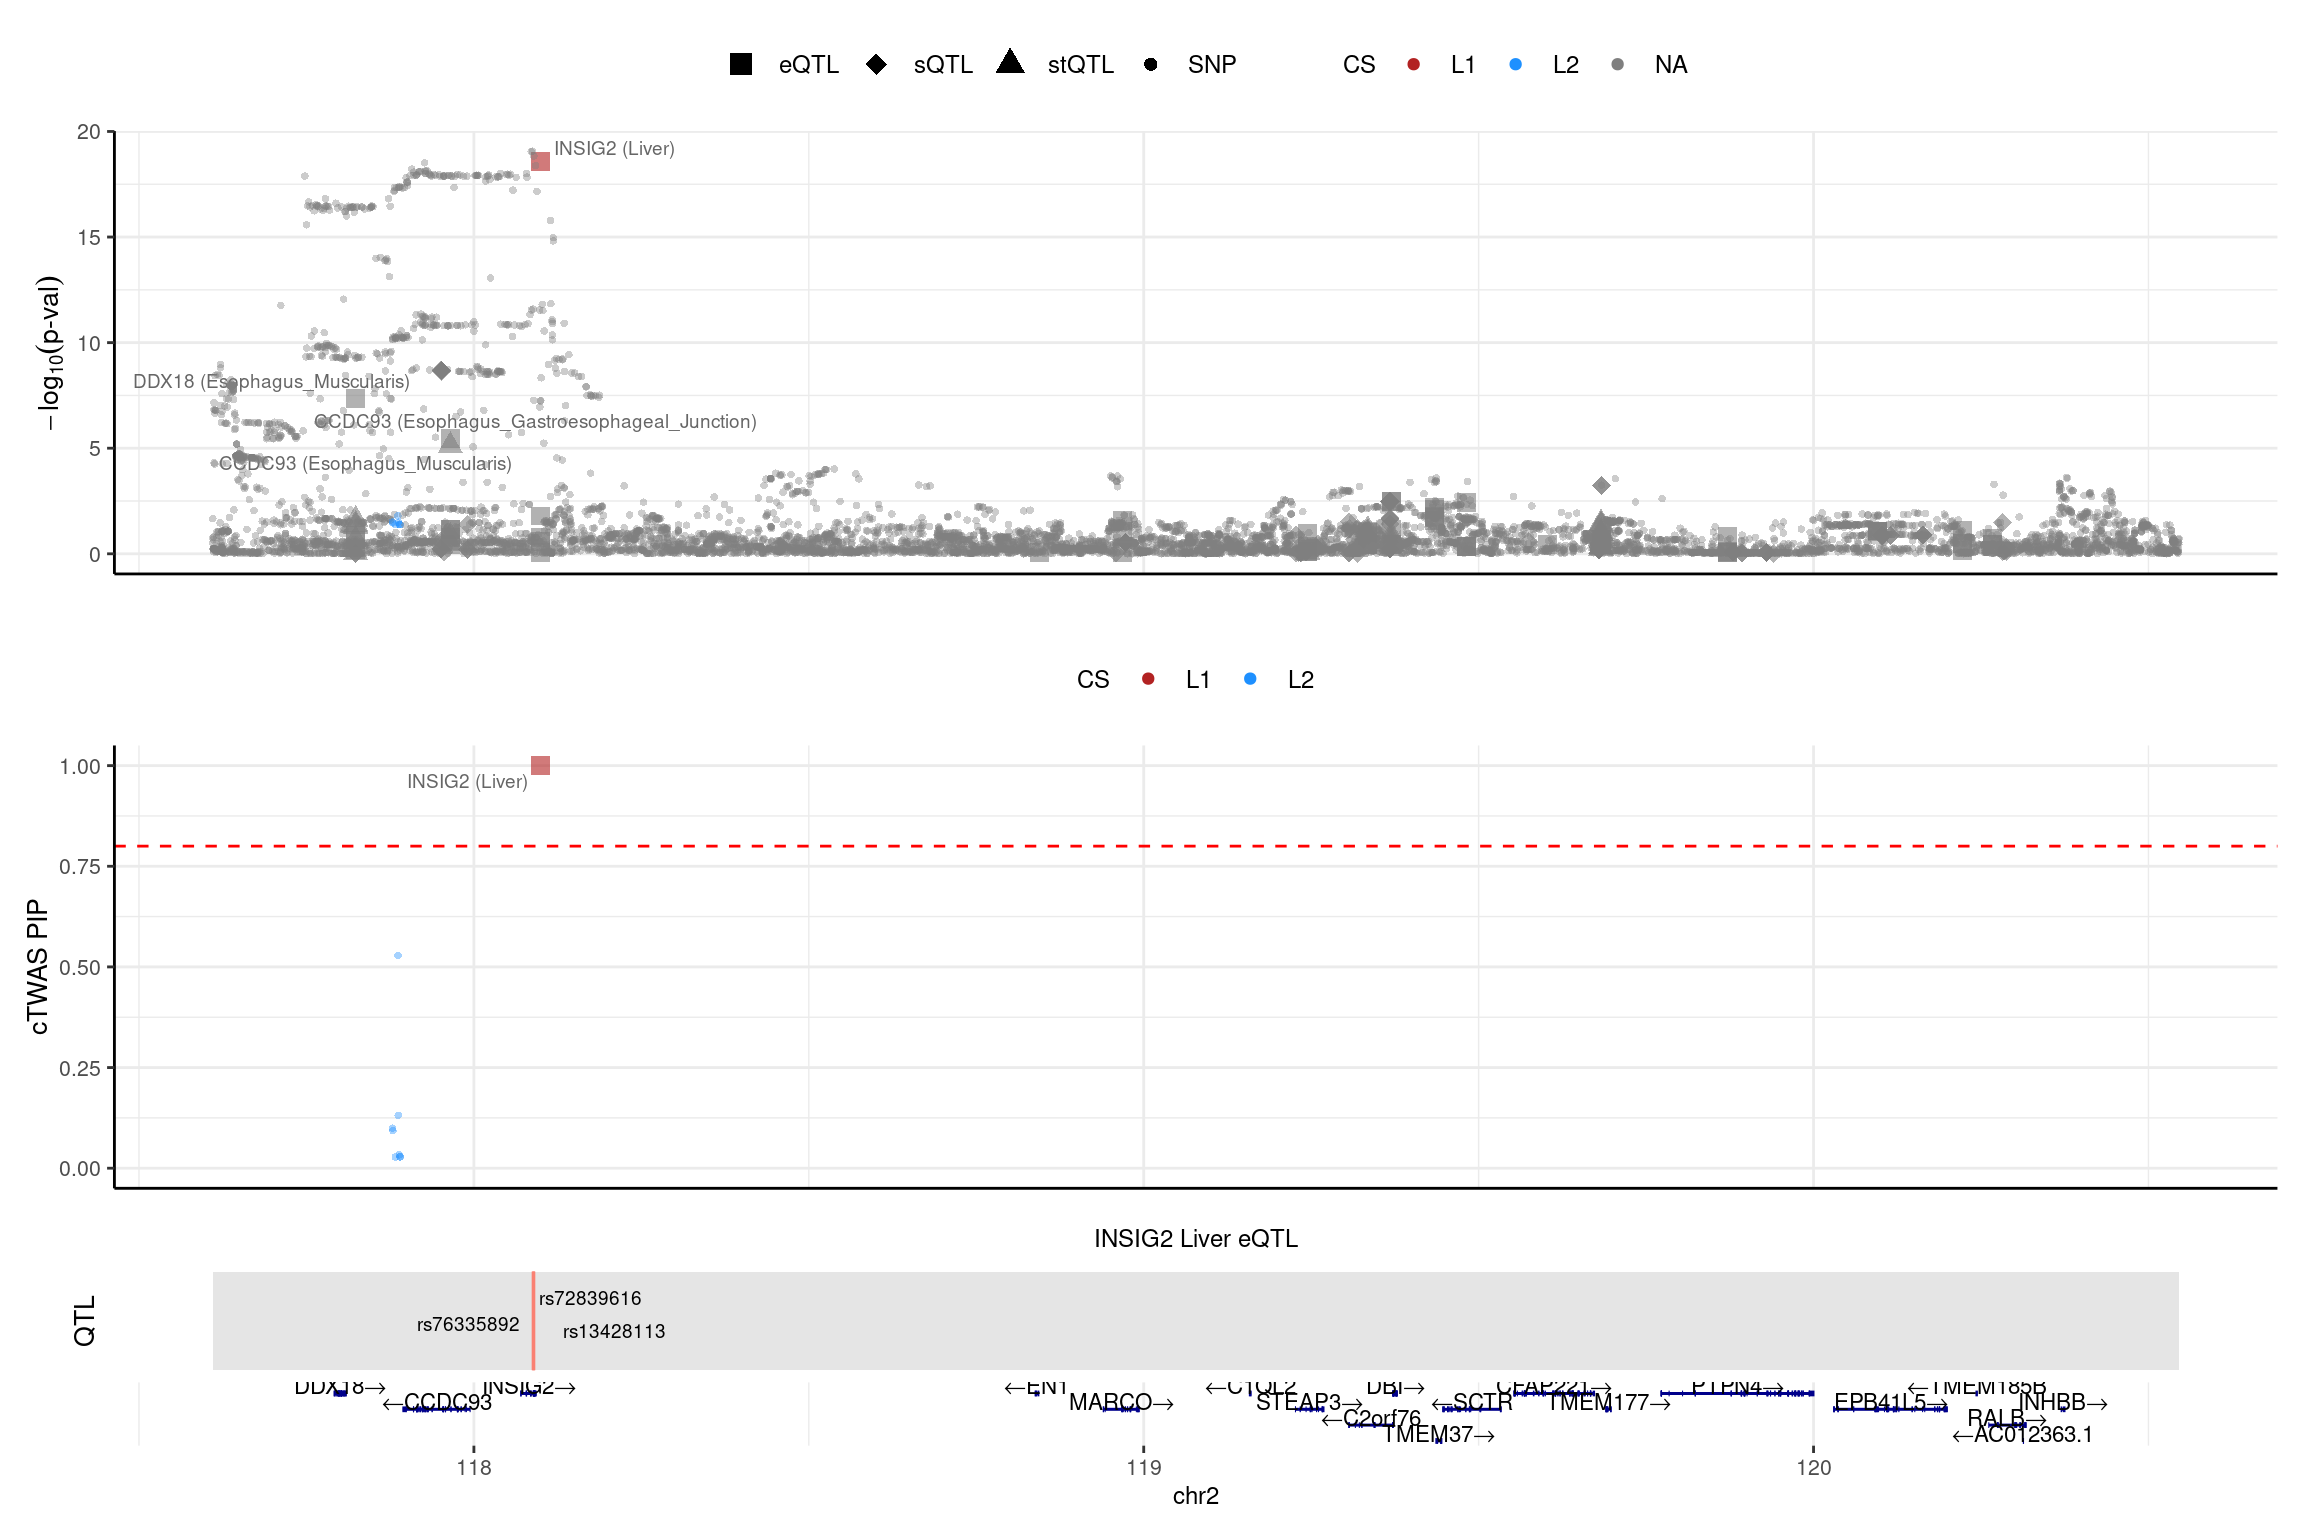
| Version | Author | Date |
|---|---|---|
| a88da38 | XSun | 2025-01-31 |
print(finemap_res_multi_L5_gene[finemap_res_multi_L5_gene$susie_pip>0.75 & abs(finemap_res_multi_L5_gene$z) < 3,]) [1] id molecular_id type context group
[6] region_id z susie_pip mu2 cs
[11] gene_name gene_type chrom start end
[16] pos
<0 rows> (or 0-length row.names)weights_multi_L5 <- readRDS(paste0(folder_multi_results_L5,"/",trait,"/",trait,".preprocessed.weights.RDS"))
region_id <- "11_116512631_117876395"
make_locusplot(finemap_res_multi_L5,
region_id = region_id,
ens_db = ens_db,
weights = weights_multi_L5,
highlight_pip = 0.8,
filter_protein_coding_genes = TRUE,
filter_cs = TRUE,
color_pval_by = "cs",
color_pip_by = "cs",panel.heights = c(4,4,1,1))2025-02-06 21:53:50 INFO::Limit to protein coding genes
2025-02-06 21:53:50 INFO::focal id: ENSG00000137656.11|Esophagus_Gastroesophageal_Junction_eQTL
2025-02-06 21:53:50 INFO::focal molecular trait: BUD13 Esophagus_Gastroesophageal_Junction eQTL
2025-02-06 21:53:50 INFO::Range of locus: chr11:116512531-117876126
2025-02-06 21:53:51 INFO::focal molecular trait QTL positions: 116772295
2025-02-06 21:53:51 INFO::Limit PIPs to credible sets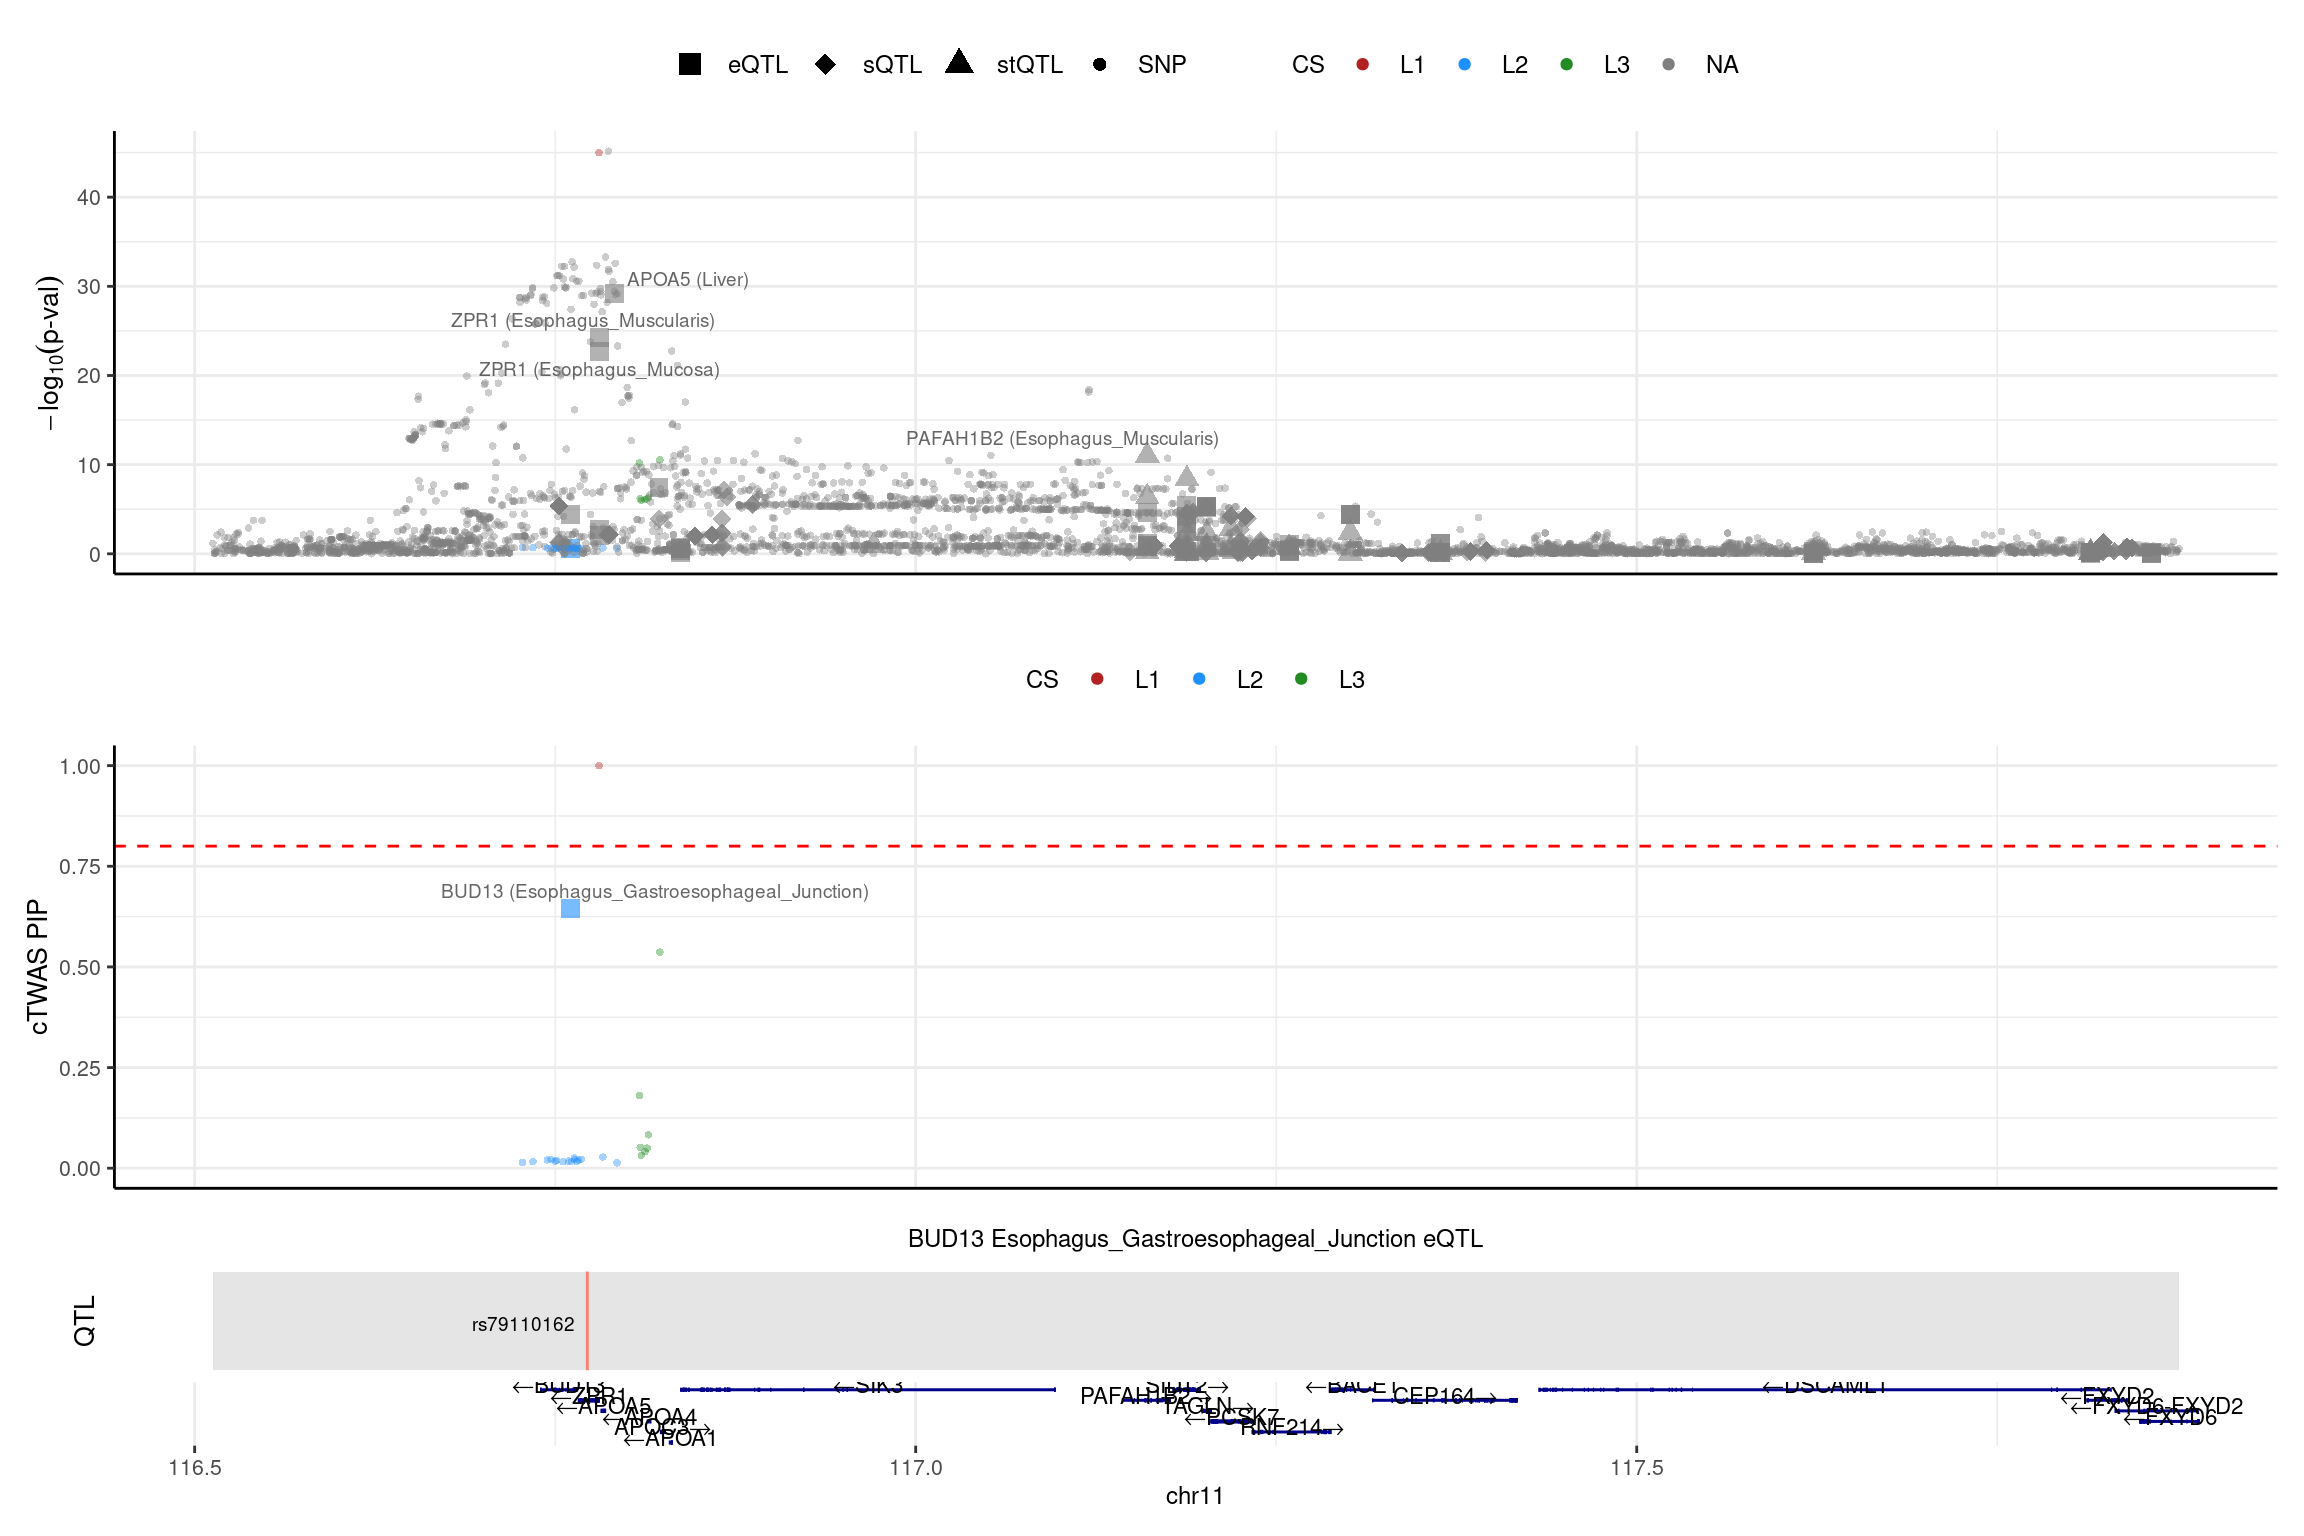 LD mismatch checked, no LD mismatch issue for these two genes.
Comparing the results for multi-group analysis
venn.plot <- venn.diagram(
  x = list(Group1 = combined_pip_sig_multi$gene_name, Group2 = combined_pip_sig_multi_samevar$gene_name, Group3 = combined_pip_sig_multi_L5$gene_name, Group4 = combined_pip_sig_multi_samevar_L5$gene_name),
  filename = NULL,
  output = FALSE,
  fill = c("skyblue", "pink", "lightgreen","yellow"),
  alpha = 0.5,
  category.names = c("share_type,preL", "share_all,preL", "share_type,L=5","share_all,L=5"),
  main = "Combined PIP > 0.8, LDL"
)

grid.draw(venn.plot)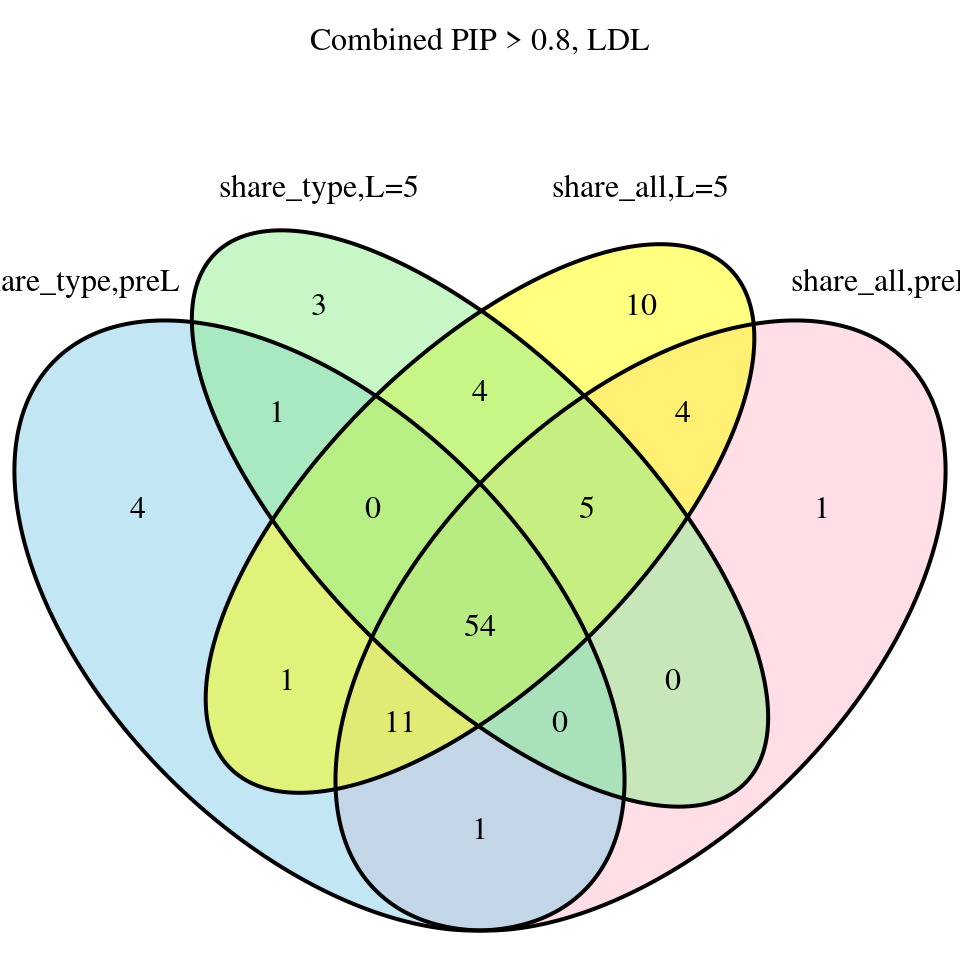
Comparing the GO enrichment results for multi-group analysis
Comparing multi-group: share_type,preL and share_all,L=5
trait <- "LDL-ukb-d-30780_irnt"
db <- "GO_Biological_Process_2023"

enrich_multi <- readRDS(paste0("/project/xinhe/xsun/multi_group_ctwas/13.post_processing_0103/results_downstream/enrich_fractional/enrichment_fractional_calibrated_blgeneset_summary_multigroup_", trait, "_", db, ".RDS"))
enrich_multi_samevarL5 <- readRDS(paste0("/project/xinhe/xsun/multi_group_ctwas/13.post_processing_0103/results_downstream/enrich_fractional/enrichment_fractional_calibrated_blgeneset_summary_multigroup_samevar_L5_", trait, "_", db, ".RDS"))

print("FDR_adjust < 0.05")
[1] "FDR_adjust < 0.05"enrich_multi_sig <- enrich_multi[enrich_multi$fdr_calibrated < 0.05,]
enrich_multi_samevarL5_sig <- enrich_multi_samevarL5[enrich_multi_samevarL5$fdr_calibrated < 0.05,]
venn.plot <- venn.diagram(
x = list(Group1 = enrich_multi_sig$G, Group2 = enrich_multi_samevarL5_sig$GO),
filename = NULL,
output = FALSE,
fill = c("skyblue", "pink"),
alpha = 0.5,
category.names = c("share_type,preL", "share_all,L=5"),
main = "Comparing GO terms identified by fractional model, FDR < 0.05"
)
grid.draw(venn.plot)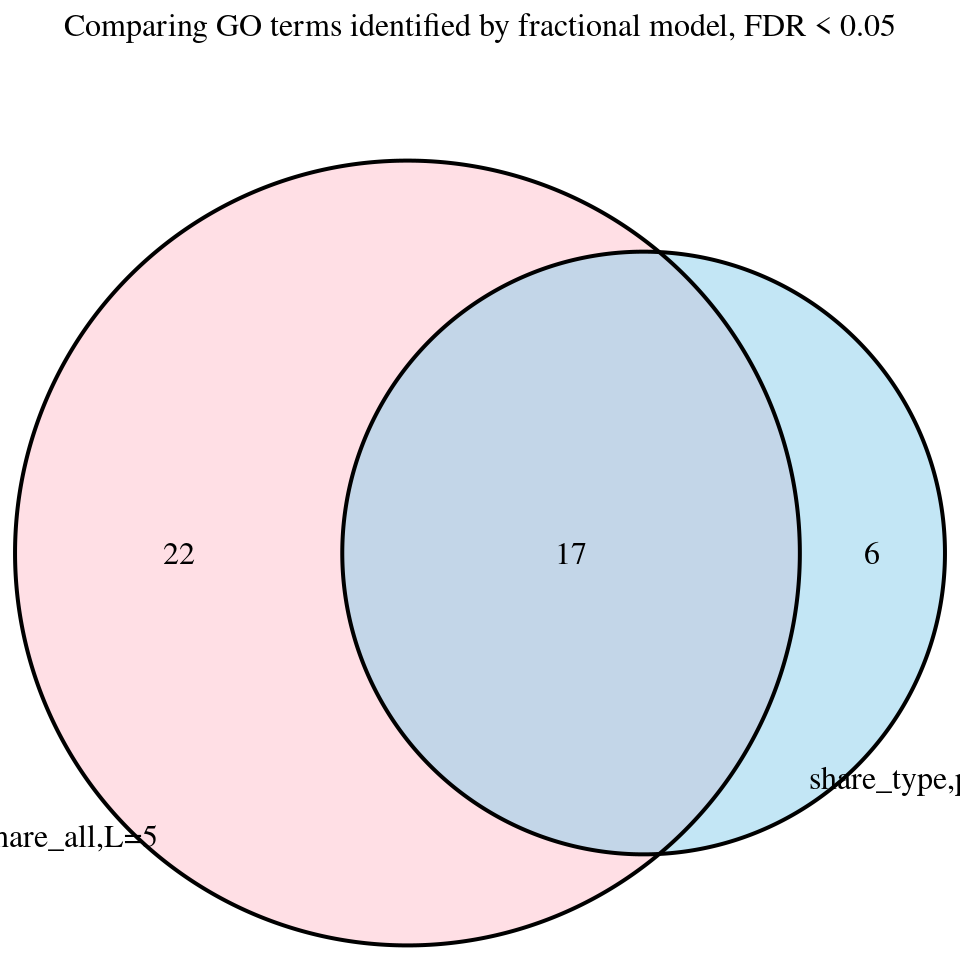
print("FDR_adjust < 0.1")[1] "FDR_adjust < 0.1"enrich_multi_sig <- enrich_multi[enrich_multi$fdr_calibrated < 0.1,]
enrich_multi_samevarL5_sig <- enrich_multi_samevarL5[enrich_multi_samevarL5$fdr_calibrated < 0.1,]
venn.plot <- venn.diagram(
x = list(Group1 = enrich_multi_sig$G, Group2 = enrich_multi_samevarL5_sig$GO),
filename = NULL,
output = FALSE,
fill = c("skyblue", "pink"),
alpha = 0.5,
category.names = c("share_type,preL", "share_all,L=5"),
main = "Comparing GO terms identified by fractional model, FDR < 0.1"
)
grid.draw(venn.plot)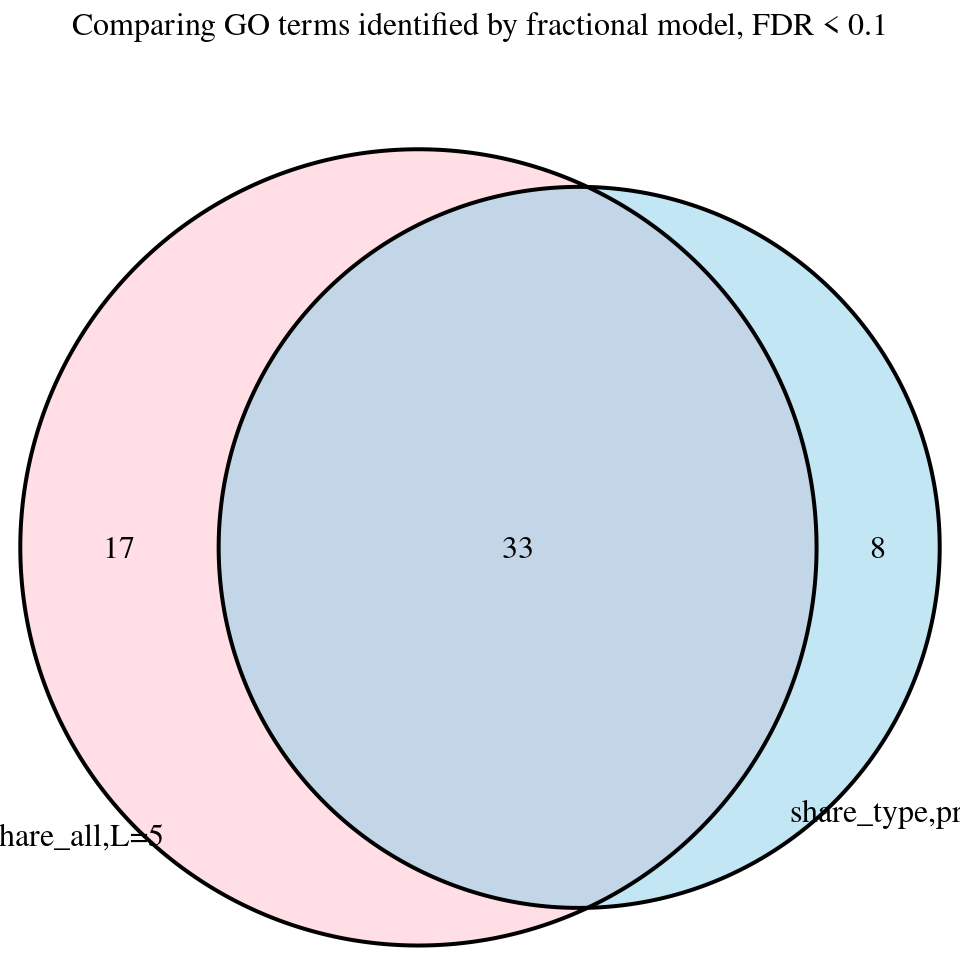
enrich_multi_unique <- enrich_multi_samevarL5_sig[!enrich_multi_samevarL5_sig$GO %in% enrich_multi_sig$GO,]
enrich_multi_unique <- cbind(enrich_multi_unique$GO,enrich_multi_unique[,1:ncol(enrich_multi_unique)-1])
DT::datatable(enrich_multi_unique,caption = htmltools::tags$caption( style = 'caption-side: left; text-align: left; color:black;  font-size:150% ;','Enrichment results -- unique GO terms found by share_all,L=5'),options = list(pageLength = 10) )
# enrich_single_unique <- enrich_single_sig[!enrich_single_sig$GO %in% enrich_multi_sig$GO,]
# DT::datatable(enrich_single_unique,caption = htmltools::tags$caption( style = 'caption-side: left; text-align: left; color:black; font-size:150% ;','Enrichment results -- unique GO terms found by single-group analysis, FDR < 0.05'),options = list(pageLength = 10) )Among these
The Gene Ontology terms related to LDL (Low-Density Lipoprotein) are:
- Positive Regulation Of Cholesterol Transport (GO:0032376) : LDL is directly involved in cholesterol transport in the bloodstream.
- Very-Low-Density Lipoprotein Particle Assembly (GO:0034379): VLDL is a precursor to LDL during lipid metabolism.
enrich_multi_unique <- enrich_multi_sig[!enrich_multi_sig$GO %in% enrich_multi_samevarL5_sig$GO,]
enrich_multi_unique <- cbind(enrich_multi_unique$GO,enrich_multi_unique[,1:ncol(enrich_multi_unique)-1])
DT::datatable(enrich_multi_unique,caption = htmltools::tags$caption( style = 'caption-side: left; text-align: left; color:black;  font-size:150% ;','Enrichment results -- unique GO terms found by share_all,L=5'),options = list(pageLength = 10) )
Among these
The Gene Ontology terms related to LDL (Low-Density Lipoprotein) from this list are:
- Negative Regulation Of Lipoprotein Particle Clearance: Directly involves lipoprotein particles like LDL, as it regulates their removal from the bloodstream.
- Regulation Of Low-Density Lipoprotein Particle Clearance: Explicitly mentions LDL particle clearance, a key process in LDL metabolism.
- Regulation Of Receptor Recycling (GO:0001919): Likely connected to LDL receptor recycling, which modulates LDL uptake into cells.
sessionInfo()R version 4.2.0 (2022-04-22)
Platform: x86_64-pc-linux-gnu (64-bit)
Running under: CentOS Linux 7 (Core)
Matrix products: default
BLAS/LAPACK: /software/openblas-0.3.13-el7-x86_64/lib/libopenblas_haswellp-r0.3.13.so
locale:
[1] C
attached base packages:
[1] grid stats4 stats graphics grDevices utils datasets
[8] methods base
other attached packages:
[1] VennDiagram_1.7.3 futile.logger_1.4.3
[3] ggplot2_3.5.1 pheatmap_1.0.12
[5] EnsDb.Hsapiens.v86_2.99.0 ensembldb_2.20.2
[7] AnnotationFilter_1.20.0 GenomicFeatures_1.48.3
[9] AnnotationDbi_1.58.0 Biobase_2.56.0
[11] GenomicRanges_1.48.0 GenomeInfoDb_1.39.9
[13] IRanges_2.30.0 S4Vectors_0.34.0
[15] BiocGenerics_0.42.0 dplyr_1.1.4
[17] ctwas_0.4.20.9001
loaded via a namespace (and not attached):
[1] colorspace_2.0-3 rjson_0.2.21
[3] ellipsis_0.3.2 rprojroot_2.0.3
[5] XVector_0.36.0 locuszoomr_0.2.1
[7] fs_1.5.2 rstudioapi_0.13
[9] farver_2.1.0 DT_0.22
[11] ggrepel_0.9.1 bit64_4.0.5
[13] fansi_1.0.3 xml2_1.3.3
[15] codetools_0.2-18 logging_0.10-108
[17] cachem_1.0.6 knitr_1.39
[19] jsonlite_1.8.0 workflowr_1.7.0
[21] Rsamtools_2.12.0 dbplyr_2.1.1
[23] png_0.1-7 readr_2.1.2
[25] compiler_4.2.0 httr_1.4.3
[27] assertthat_0.2.1 Matrix_1.5-3
[29] fastmap_1.1.0 lazyeval_0.2.2
[31] cli_3.6.1 formatR_1.12
[33] later_1.3.0 htmltools_0.5.2
[35] prettyunits_1.1.1 tools_4.2.0
[37] gtable_0.3.0 glue_1.6.2
[39] GenomeInfoDbData_1.2.8 rappdirs_0.3.3
[41] Rcpp_1.0.12 cellranger_1.1.0
[43] jquerylib_0.1.4 vctrs_0.6.5
[45] Biostrings_2.64.0 rtracklayer_1.56.0
[47] crosstalk_1.2.0 xfun_0.41
[49] stringr_1.5.1 lifecycle_1.0.4
[51] irlba_2.3.5 restfulr_0.0.14
[53] XML_3.99-0.14 zlibbioc_1.42.0
[55] zoo_1.8-10 scales_1.3.0
[57] gggrid_0.2-0 hms_1.1.1
[59] promises_1.2.0.1 MatrixGenerics_1.8.0
[61] ProtGenerics_1.28.0 parallel_4.2.0
[63] SummarizedExperiment_1.26.1 lambda.r_1.2.4
[65] RColorBrewer_1.1-3 LDlinkR_1.2.3
[67] yaml_2.3.5 curl_4.3.2
[69] memoise_2.0.1 sass_0.4.1
[71] biomaRt_2.54.1 stringi_1.7.6
[73] RSQLite_2.3.1 highr_0.9
[75] BiocIO_1.6.0 filelock_1.0.2
[77] BiocParallel_1.30.3 rlang_1.1.2
[79] pkgconfig_2.0.3 matrixStats_0.62.0
[81] bitops_1.0-7 evaluate_0.15
[83] lattice_0.20-45 purrr_1.0.2
[85] labeling_0.4.2 GenomicAlignments_1.32.0
[87] htmlwidgets_1.5.4 cowplot_1.1.1
[89] bit_4.0.4 tidyselect_1.2.0
[91] magrittr_2.0.3 R6_2.5.1
[93] generics_0.1.2 DelayedArray_0.22.0
[95] DBI_1.2.2 withr_2.5.0
[97] pgenlibr_0.3.3 pillar_1.9.0
[99] whisker_0.4 KEGGREST_1.36.3
[101] RCurl_1.98-1.7 mixsqp_0.3-43
[103] tibble_3.2.1 crayon_1.5.1
[105] futile.options_1.0.1 utf8_1.2.2
[107] BiocFileCache_2.4.0 plotly_4.10.0
[109] tzdb_0.4.0 rmarkdown_2.25
[111] progress_1.2.2 readxl_1.4.0
[113] data.table_1.14.2 blob_1.2.3
[115] git2r_0.30.1 digest_0.6.29
[117] tidyr_1.3.0 httpuv_1.6.5
[119] munsell_0.5.0 viridisLite_0.4.0
[121] bslib_0.3.1