SCZ - Brain Putamen basal ganglia
sheng Qian
2021-2-6
Last updated: 2022-03-16
Checks: 5 2
Knit directory: cTWAS_analysis/
This reproducible R Markdown analysis was created with workflowr (version 1.7.0). The Checks tab describes the reproducibility checks that were applied when the results were created. The Past versions tab lists the development history.
The R Markdown file has unstaged changes. To know which version of the R Markdown file created these results, you’ll want to first commit it to the Git repo. If you’re still working on the analysis, you can ignore this warning. When you’re finished, you can run wflow_publish to commit the R Markdown file and build the HTML.
Great job! The global environment was empty. Objects defined in the global environment can affect the analysis in your R Markdown file in unknown ways. For reproduciblity it’s best to always run the code in an empty environment.
The command set.seed(20211220) was run prior to running the code in the R Markdown file. Setting a seed ensures that any results that rely on randomness, e.g. subsampling or permutations, are reproducible.
Great job! Recording the operating system, R version, and package versions is critical for reproducibility.
Nice! There were no cached chunks for this analysis, so you can be confident that you successfully produced the results during this run.
Using absolute paths to the files within your workflowr project makes it difficult for you and others to run your code on a different machine. Change the absolute path(s) below to the suggested relative path(s) to make your code more reproducible.
| absolute | relative |
|---|---|
| /project2/xinhe/shengqian/cTWAS/cTWAS_analysis/data/ | data |
| /project2/xinhe/shengqian/cTWAS/cTWAS_analysis/code/ctwas_config.R | code/ctwas_config.R |
Great! You are using Git for version control. Tracking code development and connecting the code version to the results is critical for reproducibility.
The results in this page were generated with repository version d57314b. See the Past versions tab to see a history of the changes made to the R Markdown and HTML files.
Note that you need to be careful to ensure that all relevant files for the analysis have been committed to Git prior to generating the results (you can use wflow_publish or wflow_git_commit). workflowr only checks the R Markdown file, but you know if there are other scripts or data files that it depends on. Below is the status of the Git repository when the results were generated:
Ignored files:
    Ignored:    .ipynb_checkpoints/
    Ignored:    data/AF/

Untracked files:
    Untracked:  Rplot.png
    Untracked:  analysis/.ipynb_checkpoints/
    Untracked:  analysis/SCZ_2020_Brain_Amygdala.Rmd
    Untracked:  analysis/SCZ_2020_Brain_Anterior_cingulate_cortex_BA24.Rmd
    Untracked:  analysis/SCZ_2020_Brain_Caudate_basal_ganglia.Rmd
    Untracked:  analysis/SCZ_2020_Brain_Cerebellar_Hemisphere.Rmd
    Untracked:  analysis/SCZ_2020_Brain_Cerebellum.Rmd
    Untracked:  analysis/SCZ_2020_Brain_Hippocampus.Rmd
    Untracked:  analysis/SCZ_2020_Brain_Nucleus_accumbens_basal_ganglia.Rmd
    Untracked:  analysis/SCZ_2020_Brain_Spinal_cord_cervical_c-1.Rmd
    Untracked:  analysis/SCZ_2020_Brain_Substantia_nigra.Rmd
    Untracked:  code/.ipynb_checkpoints/
    Untracked:  code/AF_out/
    Untracked:  code/Autism_out/
    Untracked:  code/BMI_S_out/
    Untracked:  code/BMI_out/
    Untracked:  code/Glucose_out/
    Untracked:  code/LDL_S_out/
    Untracked:  code/SCZ_2014_EUR_out/
    Untracked:  code/SCZ_2020_out/
    Untracked:  code/SCZ_S_out/
    Untracked:  code/SCZ_out/
    Untracked:  code/T2D_out/
    Untracked:  code/ctwas_config.R
    Untracked:  code/mapping.R
    Untracked:  code/out/
    Untracked:  code/run_AF_analysis.sbatch
    Untracked:  code/run_AF_analysis.sh
    Untracked:  code/run_AF_ctwas_rss_LDR.R
    Untracked:  code/run_Autism_analysis.sbatch
    Untracked:  code/run_Autism_analysis.sh
    Untracked:  code/run_Autism_ctwas_rss_LDR.R
    Untracked:  code/run_BMI_analysis.sbatch
    Untracked:  code/run_BMI_analysis.sh
    Untracked:  code/run_BMI_analysis_S.sbatch
    Untracked:  code/run_BMI_analysis_S.sh
    Untracked:  code/run_BMI_ctwas_rss_LDR.R
    Untracked:  code/run_BMI_ctwas_rss_LDR_S.R
    Untracked:  code/run_Glucose_analysis.sbatch
    Untracked:  code/run_Glucose_analysis.sh
    Untracked:  code/run_Glucose_ctwas_rss_LDR.R
    Untracked:  code/run_LDL_analysis_S.sbatch
    Untracked:  code/run_LDL_analysis_S.sh
    Untracked:  code/run_LDL_ctwas_rss_LDR_S.R
    Untracked:  code/run_SCZ_2014_EUR_analysis.sbatch
    Untracked:  code/run_SCZ_2014_EUR_analysis.sh
    Untracked:  code/run_SCZ_2014_EUR_ctwas_rss_LDR.R
    Untracked:  code/run_SCZ_2020_analysis.sbatch
    Untracked:  code/run_SCZ_2020_analysis.sh
    Untracked:  code/run_SCZ_2020_ctwas_rss_LDR.R
    Untracked:  code/run_SCZ_analysis.sbatch
    Untracked:  code/run_SCZ_analysis.sh
    Untracked:  code/run_SCZ_analysis_S.sbatch
    Untracked:  code/run_SCZ_analysis_S.sh
    Untracked:  code/run_SCZ_ctwas_rss_LDR.R
    Untracked:  code/run_SCZ_ctwas_rss_LDR_S.R
    Untracked:  code/run_T2D_analysis.sbatch
    Untracked:  code/run_T2D_analysis.sh
    Untracked:  code/run_T2D_ctwas_rss_LDR.R
    Untracked:  code/wflow_build.R
    Untracked:  code/wflow_build.sbatch
    Untracked:  data/.ipynb_checkpoints/
    Untracked:  data/BMI/
    Untracked:  data/PGC3_SCZ_wave3_public.v2.tsv
    Untracked:  data/SCZ/
    Untracked:  data/SCZ_2014_EUR/
    Untracked:  data/SCZ_2020/
    Untracked:  data/SCZ_S/
    Untracked:  data/T2D/
    Untracked:  data/UKBB/
    Untracked:  data/UKBB_SNPs_Info.text
    Untracked:  data/gene_OMIM.txt
    Untracked:  data/gene_pip_0.8.txt
    Untracked:  data/mashr_Heart_Atrial_Appendage.db
    Untracked:  data/mashr_sqtl/
    Untracked:  data/summary_known_genes_annotations.xlsx
    Untracked:  data/untitled.txt

Unstaged changes:
    Modified:   analysis/SCZ_2020_Brain_Cortex.Rmd
    Modified:   analysis/SCZ_2020_Brain_Frontal_Cortex_BA9.Rmd
    Modified:   analysis/SCZ_2020_Brain_Hypothalamus.Rmd
    Modified:   analysis/SCZ_2020_Brain_Putamen_basal_ganglia.Rmd
Note that any generated files, e.g. HTML, png, CSS, etc., are not included in this status report because it is ok for generated content to have uncommitted changes.
These are the previous versions of the repository in which changes were made to the R Markdown (analysis/SCZ_2020_Brain_Putamen_basal_ganglia.Rmd) and HTML (docs/SCZ_2020_Brain_Putamen_basal_ganglia.html) files. If you’ve configured a remote Git repository (see ?wflow_git_remote), click on the hyperlinks in the table below to view the files as they were in that past version.
| File | Version | Author | Date | Message |
|---|---|---|---|---|
| Rmd | d57314b | sq-96 | 2022-03-15 | update |
Weight QC
#number of imputed weights
nrow(qclist_all)
[1] 11271#number of imputed weights by chromosome
table(qclist_all$chr)
   1    2    3    4    5    6    7    8    9   10   11   12   13   14   15   16
1120  786  659  444  526  660  552  400  410  451  667  642  225  382  381  514
  17   18   19   20   21   22
 684  177  856  347  121  267
#number of imputed weights without missing variants
sum(qclist_all$nmiss==0)[1] 8824#proportion of imputed weights without missing variants
mean(qclist_all$nmiss==0)[1] 0.7829Check convergence of parameters
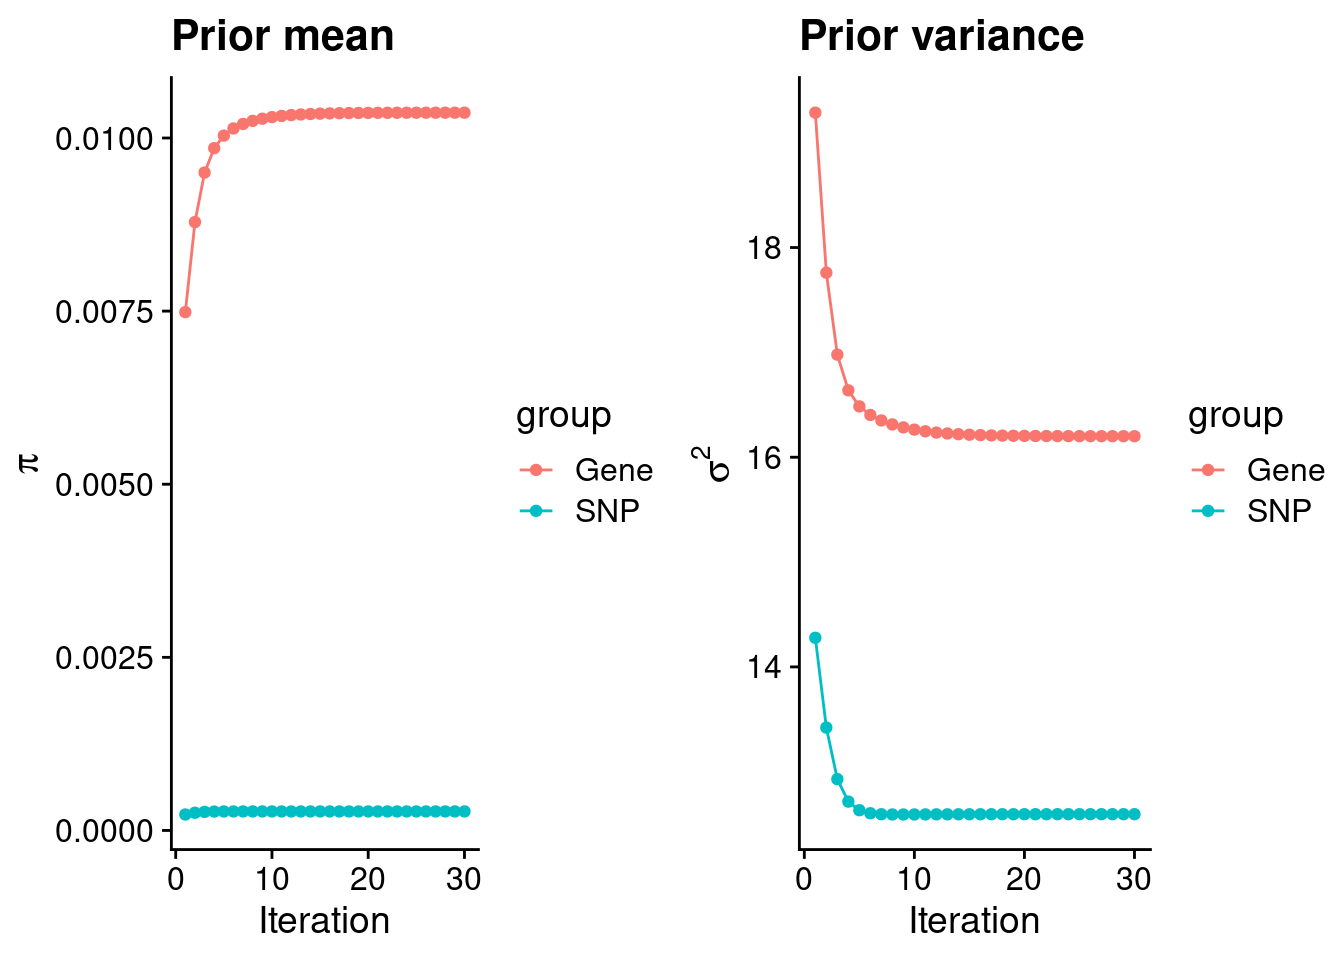
#estimated group prior
estimated_group_prior <- group_prior_rec[,ncol(group_prior_rec)]
names(estimated_group_prior) <- c("gene", "snp")
estimated_group_prior["snp"] <- estimated_group_prior["snp"]*thin #adjust parameter to account for thin argument
print(estimated_group_prior)
gene snp
0.0103659 0.0002745 #estimated group prior variance
estimated_group_prior_var <- group_prior_var_rec[,ncol(group_prior_var_rec)]
names(estimated_group_prior_var) <- c("gene", "snp")
print(estimated_group_prior_var)gene snp
16.2 12.6 #report sample size
print(sample_size)[1] 161405#report group size
group_size <- c(nrow(ctwas_gene_res), n_snps)
print(group_size)[1] 11271 7394310#estimated group PVE
estimated_group_pve <- estimated_group_prior_var*estimated_group_prior*group_size/sample_size #check PVE calculation
names(estimated_group_pve) <- c("gene", "snp")
print(estimated_group_pve) gene snp
0.01173 0.15837 #compare sum(PIP*mu2/sample_size) with above PVE calculation
c(sum(ctwas_gene_res$PVE),sum(ctwas_snp_res$PVE))[1] 0.04683 0.79781Genes with highest PIPs
         genename region_tag susie_pip     mu2       PVE       z num_eqtl
6842        SPPL3      12_74    0.9849   34.38 2.098e-04 -5.6124        2
9521       LSMEM2       3_35    0.9794 1012.56 6.144e-03  4.2709        1
10867      ZNF823      19_10    0.9784   40.71 2.467e-04  6.3109        1
11990  AC012074.2       2_15    0.9765   31.00 1.876e-04  5.4694        1
4092        FEZF1       7_74    0.9513   24.14 1.423e-04 -4.6555        1
3781       BTN2A2       6_20    0.9347   26.05 1.508e-04 -0.9406        2
2638        TRPV4      12_66    0.8883   25.17 1.385e-04  4.4157        1
4466         ACY3      11_37    0.8301   20.36 1.047e-04 -3.3965        1
7789       GTF2A1      14_39    0.8059   24.82 1.239e-04 -4.8497        1
75         OSBPL7      17_28    0.7966   23.11 1.141e-04  4.3242        2
3080         QPCT       2_23    0.7948   38.26 1.884e-04  6.2812        2
10872       RPL12       9_66    0.7918   24.58 1.206e-04  4.6699        2
9612         GSX2       4_39    0.7915   24.78 1.215e-04  4.7860        1
2678       MRPL51       12_7    0.7804   22.34 1.080e-04  3.9435        1
6521     SLC25A27       6_35    0.7746   23.03 1.105e-04 -3.8945        3
5424        CPNE2      16_30    0.7725   22.06 1.056e-04 -4.1250        1
11945   HIST1H2BN       6_21    0.7651  177.22 8.400e-04 13.1822        1
5311     C12orf10      12_33    0.7513   26.18 1.219e-04 -4.9630        1
13295 RP11-47A8.5      10_66    0.7454   36.08 1.666e-04  4.2823        1
12644       CEP95      17_37    0.7366   21.37 9.752e-05 -3.8003        1
Genes with largest effect sizes
         genename region_tag susie_pip     mu2       PVE       z num_eqtl
9521       LSMEM2       3_35 9.794e-01 1012.56 6.144e-03  4.2709        1
206        SEMA3B       3_35 9.526e-07  989.37 5.839e-09  1.0870        1
10436     SLC38A3       3_35 1.970e-07  247.64 3.022e-10 -2.7756        1
123      CACNA2D2       3_35 9.002e-07  225.92 1.260e-09 -0.1392        1
36           RBM6       3_35 4.844e-01  193.33 5.802e-04  4.4688        1
12210        NAT6       3_35 6.637e-08  179.02 7.361e-11  1.8009        2
11945   HIST1H2BN       6_21 7.651e-01  177.22 8.400e-04 13.1822        1
10270       HYAL3       3_35 6.470e-08  170.13 6.820e-11 -2.5066        1
7563        CAMKV       3_35 9.880e-06  168.16 1.029e-08 -1.7107        1
7565        MST1R       3_35 1.296e-04  145.52 1.168e-07 -4.0250        1
13230 RP1-86C11.7       6_21 1.374e-01  123.77 1.054e-04 10.5382        1
10244      BTN3A2       6_20 1.059e-02  116.76 7.657e-06  8.0974        3
1208        DOCK3       3_35 1.604e-06  112.81 1.121e-09  0.3011        1
7560       RNF123       3_35 6.096e-08   94.80 3.580e-11 -2.3622        1
11197        APOM       6_26 3.717e-01   87.55 2.016e-04 10.6484        1
12247         C4A       6_26 3.016e-01   87.12 1.628e-04 10.6070        1
11156     HLA-DMA       6_27 5.528e-01   78.48 2.688e-04 -9.4095        2
13228   U91328.19       6_20 6.651e-02   72.58 2.991e-05 -6.2195        1
11190        MSH5       6_26 8.706e-04   69.73 3.761e-07  9.0192        2
6302        ABCB9      12_75 5.159e-04   66.63 2.130e-07  8.6382        1
Genes with highest PVE
         genename region_tag susie_pip     mu2       PVE       z num_eqtl
9521       LSMEM2       3_35    0.9794 1012.56 0.0061444  4.2709        1
11945   HIST1H2BN       6_21    0.7651  177.22 0.0008400 13.1822        1
36           RBM6       3_35    0.4844  193.33 0.0005802  4.4688        1
11156     HLA-DMA       6_27    0.5528   78.48 0.0002688 -9.4095        2
3950         IRF3      19_34    0.7190   55.82 0.0002487 -7.5059        1
10867      ZNF823      19_10    0.9784   40.71 0.0002467  6.3109        1
3043        SF3B1      2_117    0.6646   52.94 0.0002180  7.6053        1
6842        SPPL3      12_74    0.9849   34.38 0.0002098 -5.6124        2
8111      GATAD2A      19_16    0.6292   52.66 0.0002053 -7.4194        1
11197        APOM       6_26    0.3717   87.55 0.0002016 10.6484        1
7527         GNL3       3_36    0.4880   63.17 0.0001910  9.0882        2
10828         NMB      15_39    0.6170   49.70 0.0001900  7.1213        1
3080         QPCT       2_23    0.7948   38.26 0.0001884  6.2812        2
11990  AC012074.2       2_15    0.9765   31.00 0.0001876  5.4694        1
9596       HARBI1      11_28    0.4666   60.14 0.0001739  8.0462        1
13295 RP11-47A8.5      10_66    0.7454   36.08 0.0001666  4.2823        1
12247         C4A       6_26    0.3016   87.12 0.0001628 10.6070        1
3781       BTN2A2       6_20    0.9347   26.05 0.0001508 -0.9406        2
4092        FEZF1       7_74    0.9513   24.14 0.0001423 -4.6555        1
2638        TRPV4      12_66    0.8883   25.17 0.0001385  4.4157        1
Genes with largest z scores
         genename region_tag susie_pip    mu2       PVE      z num_eqtl
11945   HIST1H2BN       6_21 0.7650567 177.22 8.400e-04 13.182        1
11197        APOM       6_26 0.3717378  87.55 2.016e-04 10.648        1
12247         C4A       6_26 0.3016414  87.12 1.628e-04 10.607        1
13230 RP1-86C11.7       6_21 0.1374458 123.77 1.054e-04 10.538        1
905         NT5C2      10_66 0.1439382  53.47 4.769e-05 -9.705        1
6164        CNNM2      10_66 0.1187419  52.87 3.889e-05 -9.686        1
11156     HLA-DMA       6_27 0.5528062  78.48 2.688e-04 -9.409        2
7527         GNL3       3_36 0.4880252  63.17 1.910e-04  9.088        2
11190        MSH5       6_26 0.0008706  69.73 3.761e-07  9.019        2
7528        PBRM1       3_36 0.0213831  59.35 7.863e-06 -8.722        1
6302        ABCB9      12_75 0.0005159  66.63 2.130e-07  8.638        1
8250        SMIM4       3_36 0.0180570  56.86 6.361e-06 -8.494        1
11497       AS3MT      10_66 0.0020186  57.12 7.144e-07  8.363        1
10244      BTN3A2       6_20 0.0105851 116.76 7.657e-06  8.097        3
9596       HARBI1      11_28 0.4665954  60.14 1.739e-04  8.046        1
10593        TUBB       6_24 0.0083018  59.21 3.046e-06 -7.980        1
2590          MDK      11_28 0.1614738  57.66 5.768e-05 -7.898        1
2971         NEK4       3_36 0.0103125  48.29 3.085e-06  7.898        1
11346     DNAJC19      3_111 0.0216825  56.90 7.644e-06  7.788        1
245        GLT8D1       3_36 0.0092730  46.07 2.647e-06  7.782        1
Comparing z scores and PIPs
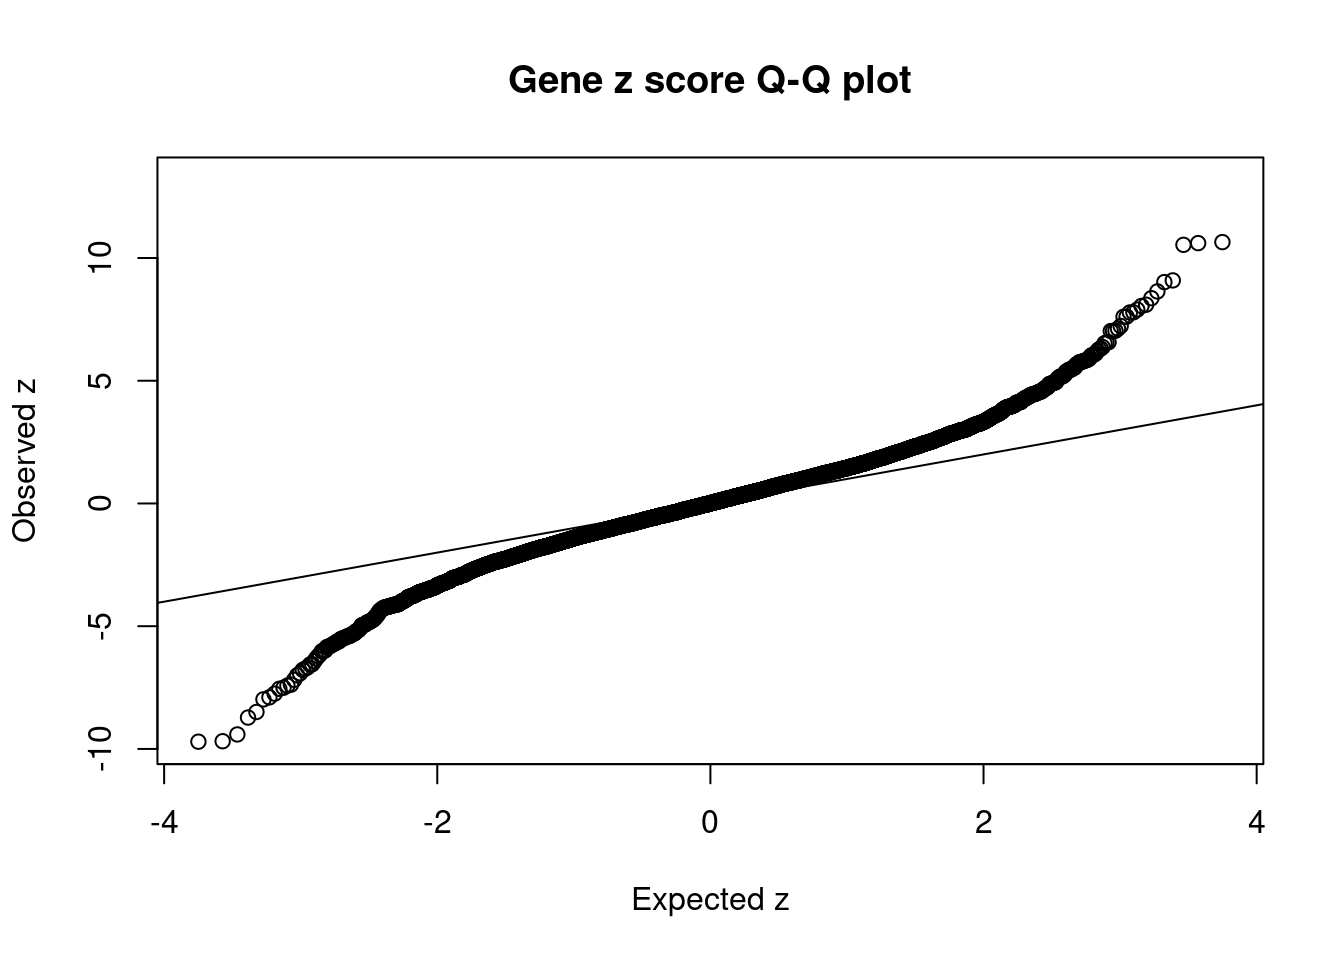
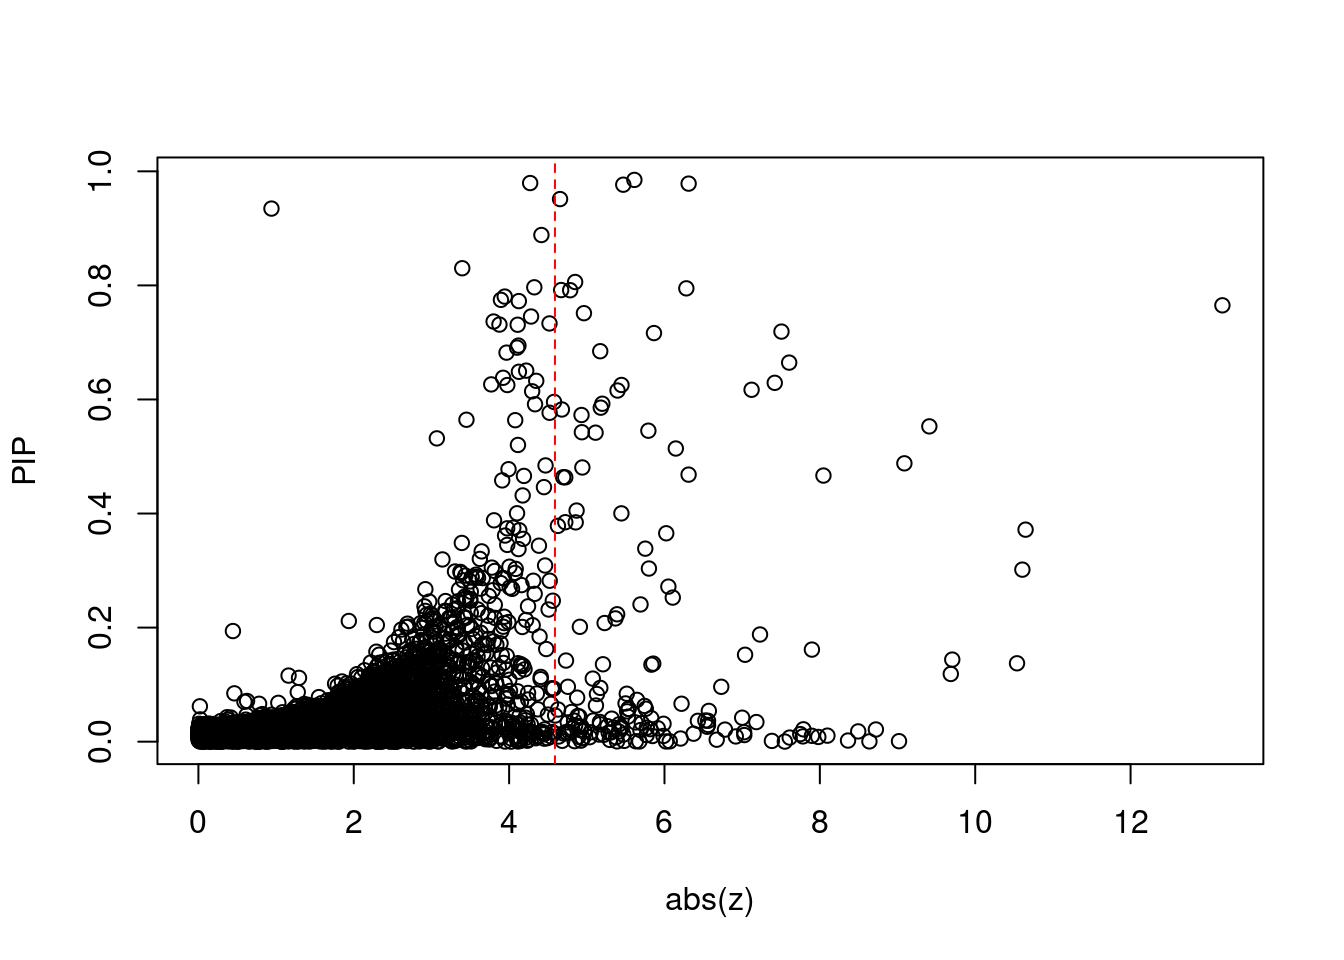
#proportion of significant z scores
mean(abs(ctwas_gene_res$z) > sig_thresh)
[1] 0.01473GO enrichment analysis for genes with PIP>0.5
#number of genes for gene set enrichment
length(genes)
[1] 57Uploading data to Enrichr... Done.
Querying GO_Biological_Process_2021... Done.
Querying GO_Cellular_Component_2021... Done.
Querying GO_Molecular_Function_2021... Done.
Parsing results... Done.
[1] "GO_Biological_Process_2021"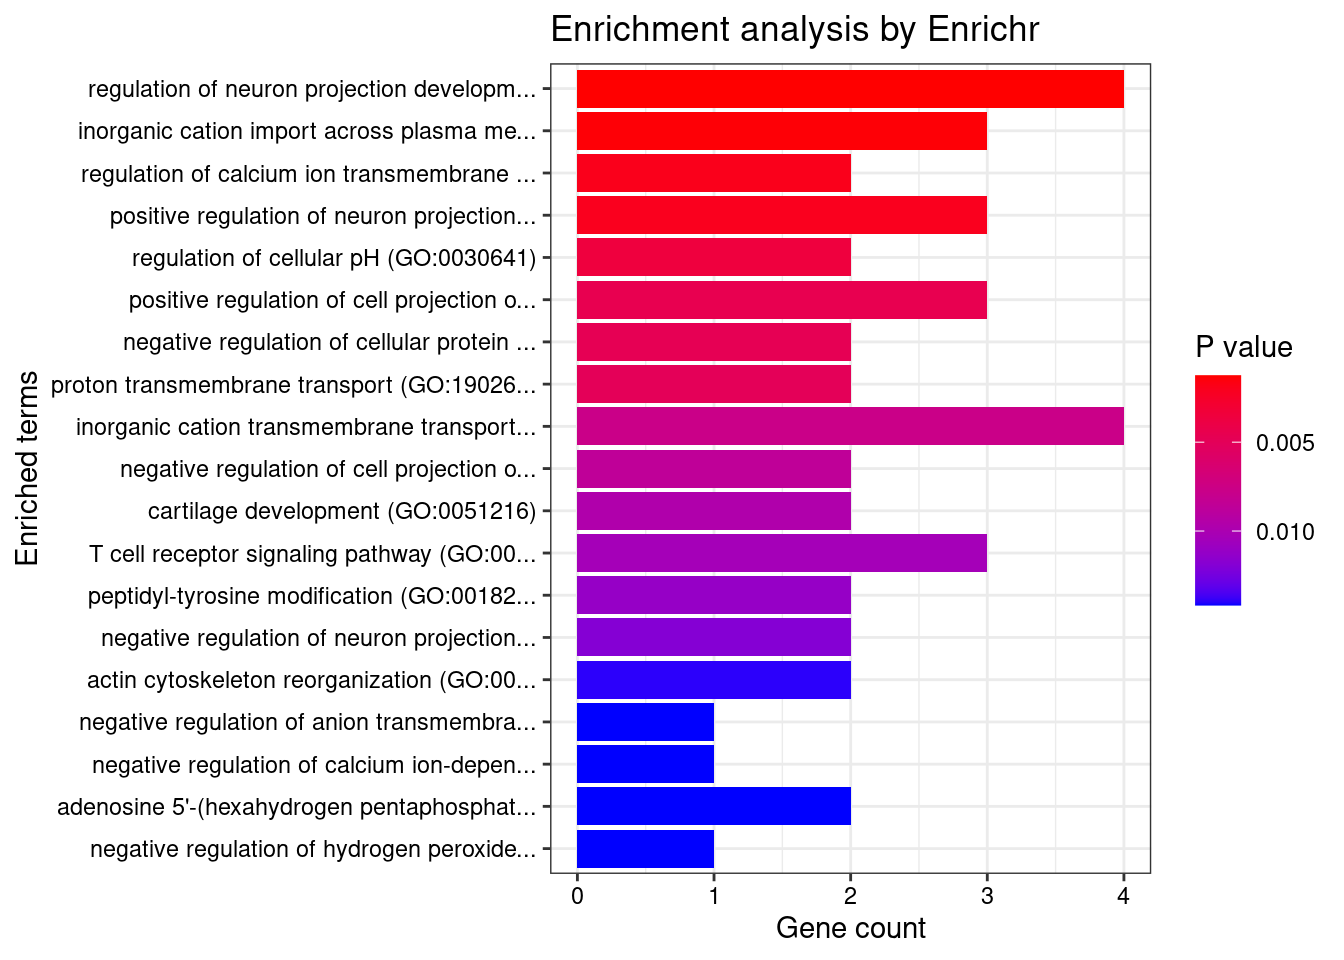
[1] Term             Overlap          Adjusted.P.value Genes
<0 rows> (or 0-length row.names)
[1] "GO_Cellular_Component_2021"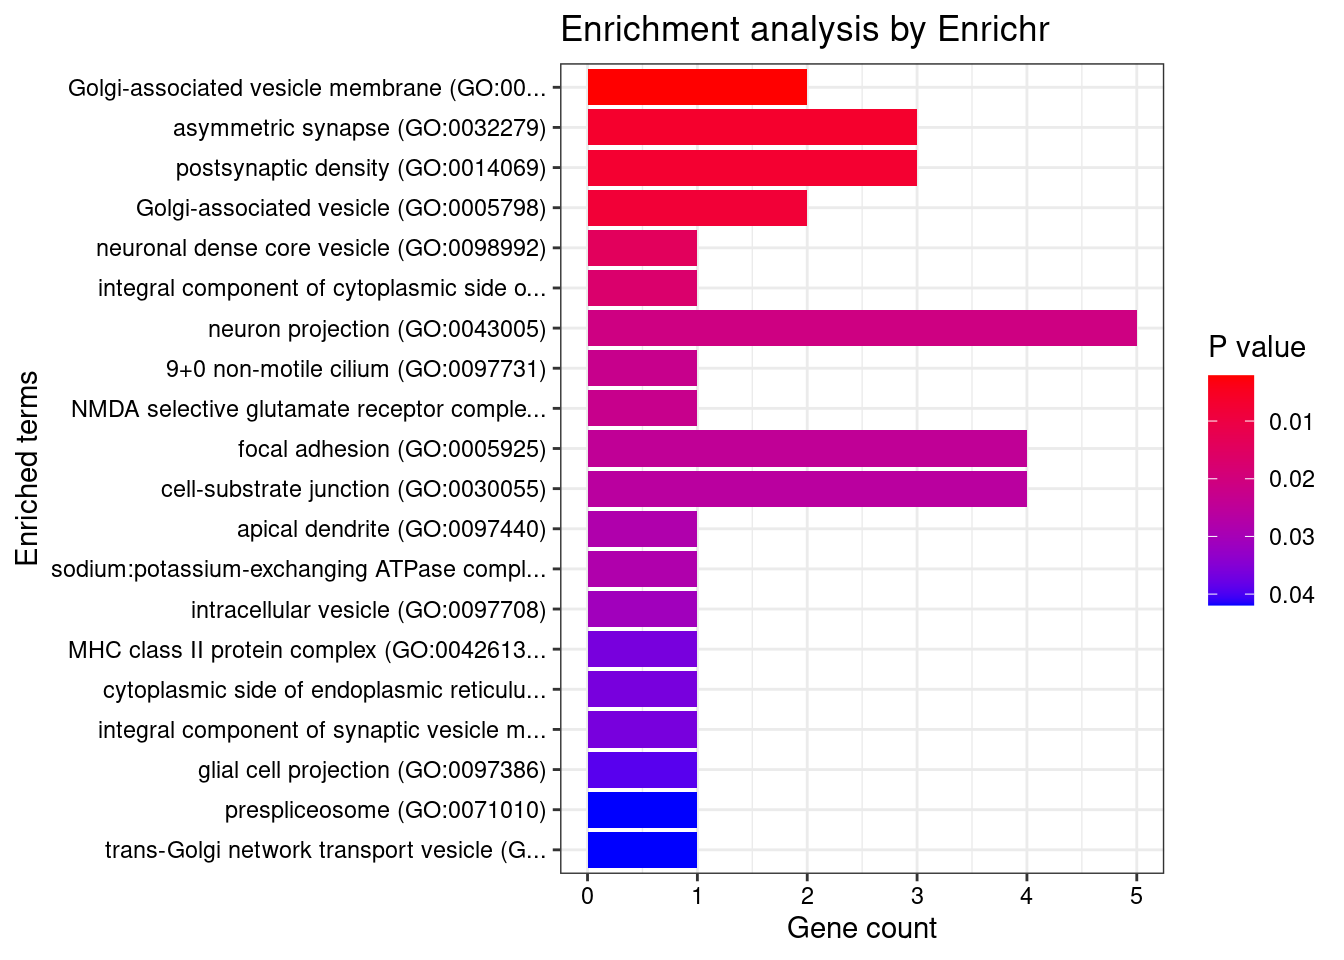
[1] Term             Overlap          Adjusted.P.value Genes
<0 rows> (or 0-length row.names)
[1] "GO_Molecular_Function_2021"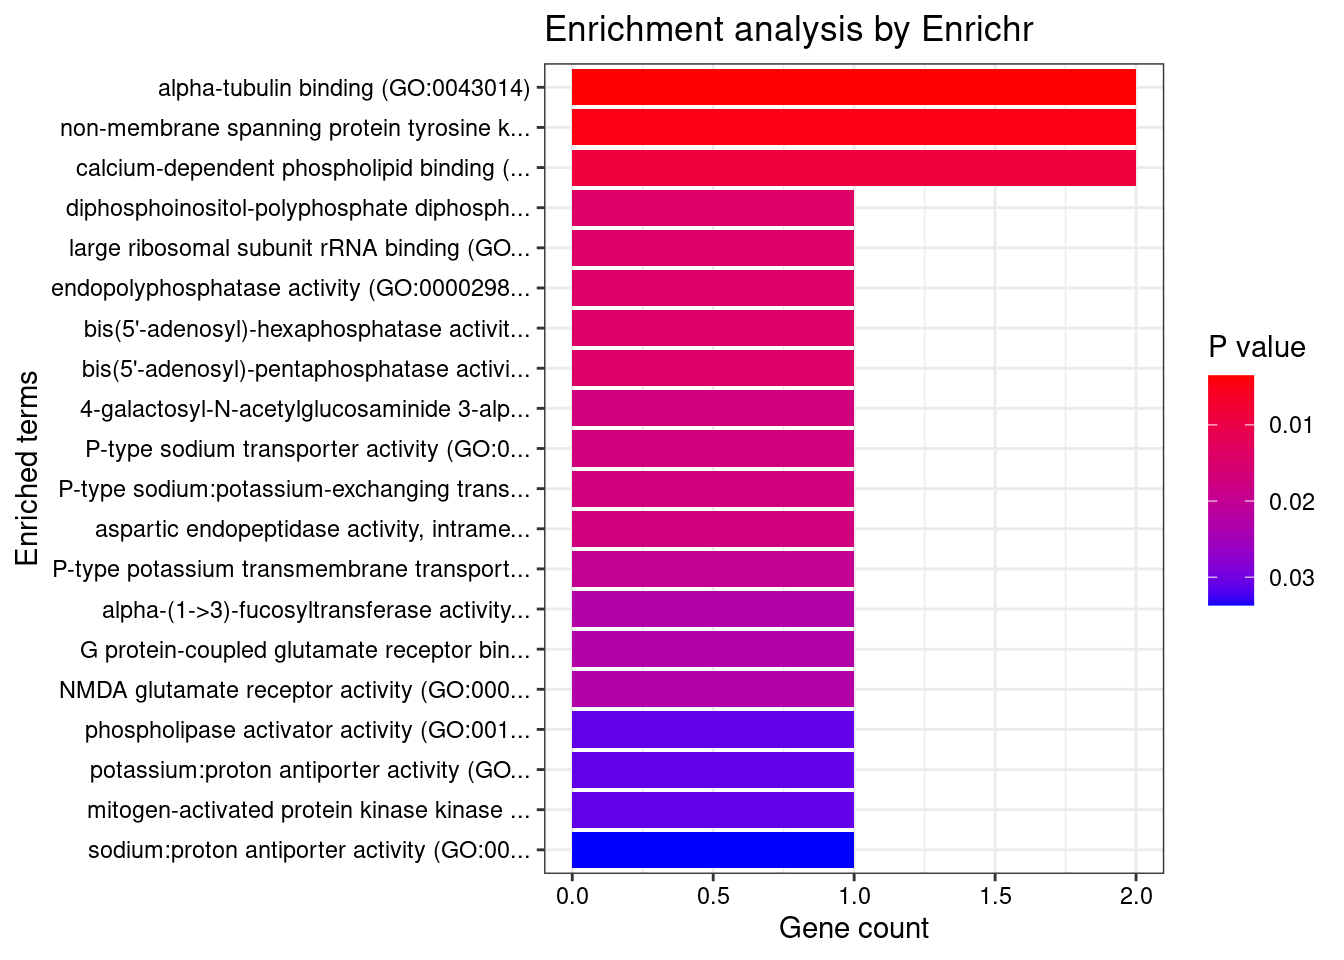
[1] Term             Overlap          Adjusted.P.value Genes
<0 rows> (or 0-length row.names)
DisGeNET enrichment analysis for genes with PIP>0.5
                                                              Description
15                                                              Confusion
30                                           Chronic Lymphocytic Leukemia
72                                                      Speech impairment
73                                                          Derealization
82                          Spondylometaphyseal dysplasia, Kozlowski type
83                                                    Metatropic dwarfism
107                                                    Brachyolmia Type 3
114                                        Sexually disinhibited behavior
123                                                Hypersomnia, Recurrent
145 SPINAL MUSCULAR ATROPHY, DISTAL, CONGENITAL NONPROGRESSIVE (disorder)
        FDR Ratio BgRatio
15  0.01737  1/25  1/9703
30  0.01737  3/25 55/9703
72  0.01737  1/25  1/9703
73  0.01737  1/25  1/9703
82  0.01737  1/25  1/9703
83  0.01737  1/25  1/9703
107 0.01737  1/25  1/9703
114 0.01737  1/25  1/9703
123 0.01737  1/25  1/9703
145 0.01737  1/25  1/9703
WebGestalt enrichment analysis for genes with PIP>0.5
Loading the functional categories...
Loading the ID list...
Loading the reference list...
Performing the enrichment analysis...
Warning in oraEnrichment(interestGeneList, referenceGeneList, geneSet, minNum =
minNum, : No significant gene set is identified based on FDR 0.05!NULLPIP Manhattan Plot
Warning: ggrepel: 13 unlabeled data points (too many overlaps). Consider
increasing max.overlaps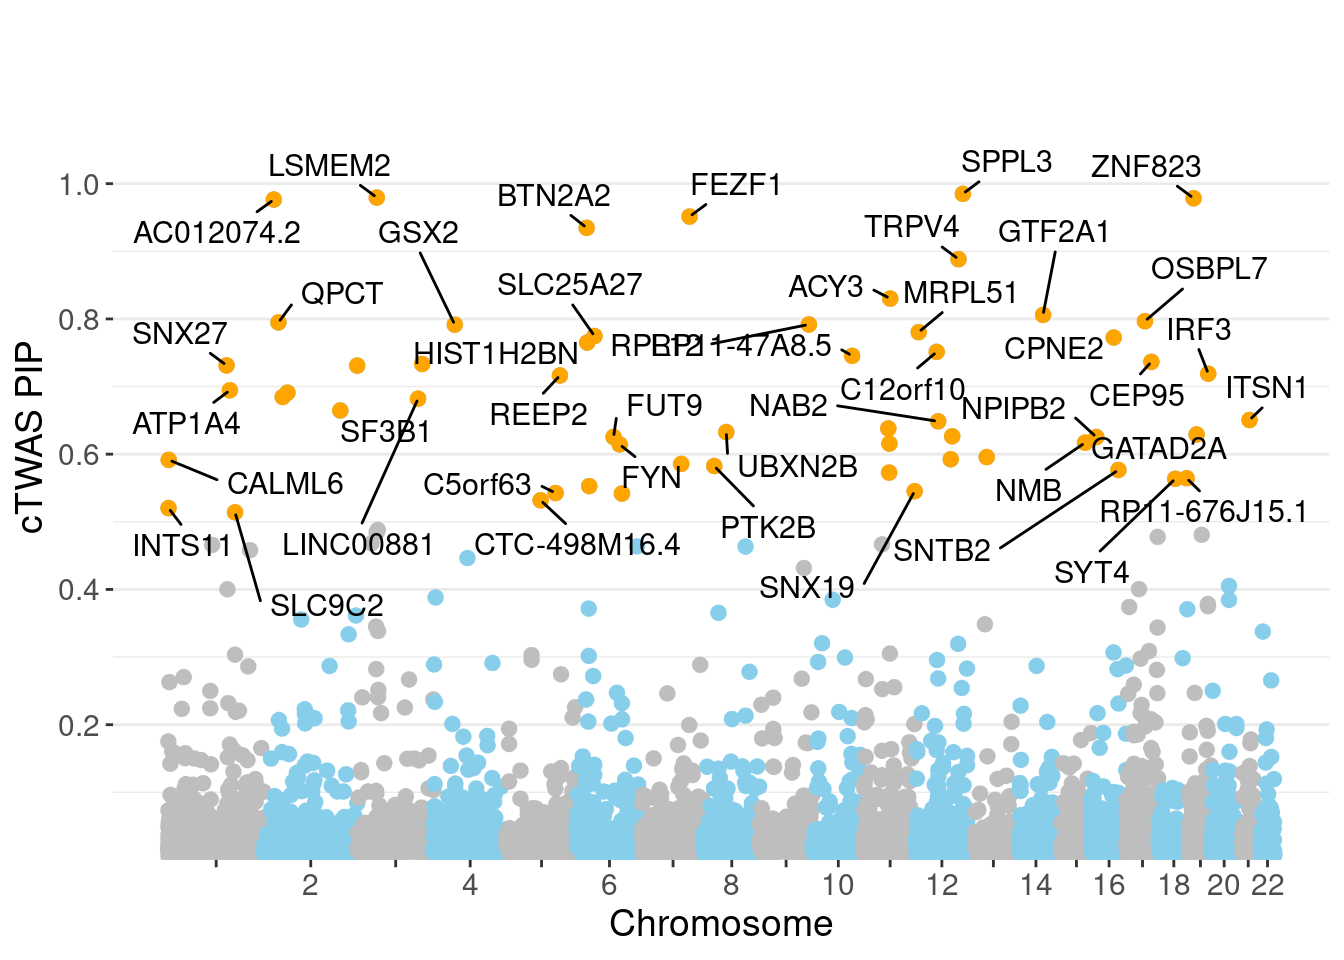
Sensitivity, specificity and precision for silver standard genes
#number of genes in known annotations
print(length(known_annotations))
[1] 130#number of genes in known annotations with imputed expression
print(sum(known_annotations %in% ctwas_gene_res$genename))[1] 61#significance threshold for TWAS
print(sig_thresh)[1] 4.59#number of ctwas genes
length(ctwas_genes)[1] 9#number of TWAS genes
length(twas_genes)[1] 166#show novel genes (ctwas genes with not in TWAS genes)
ctwas_gene_res[ctwas_gene_res$genename %in% novel_genes,report_cols] genename region_tag susie_pip mu2 PVE z num_eqtl
9521 LSMEM2 3_35 0.9794 1012.56 0.0061444 4.2709 1
3781 BTN2A2 6_20 0.9347 26.05 0.0001508 -0.9406 2
4466 ACY3 11_37 0.8301 20.36 0.0001047 -3.3965 1
2638 TRPV4 12_66 0.8883 25.17 0.0001385 4.4157 1#sensitivity / recall
print(sensitivity) ctwas TWAS
0.007692 0.138462 #specificity
print(specificity) ctwas TWAS
0.9993 0.9868 #precision / PPV
print(precision) ctwas TWAS
0.1111 0.1084 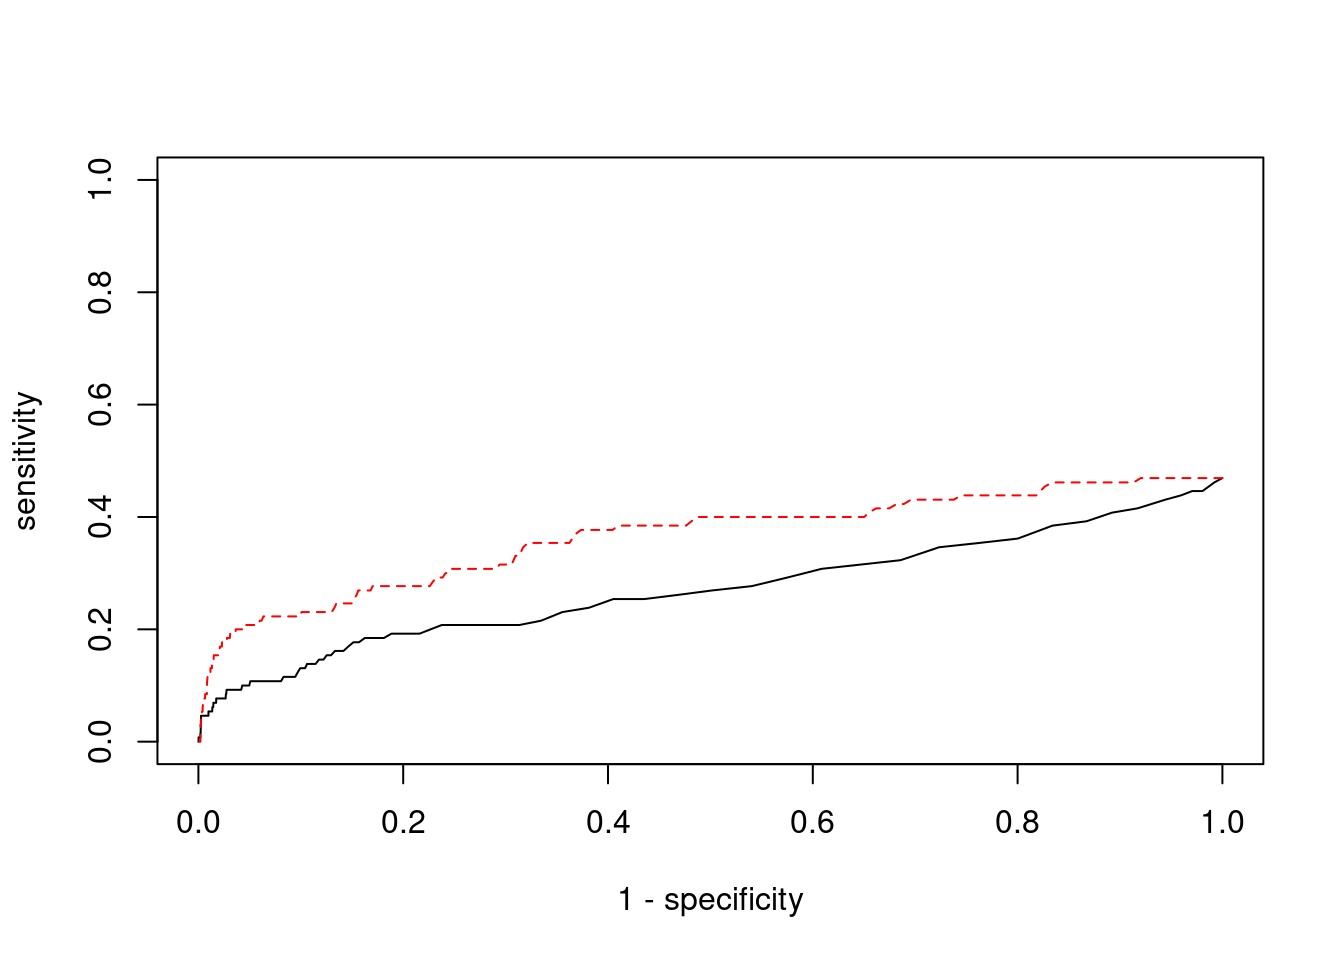
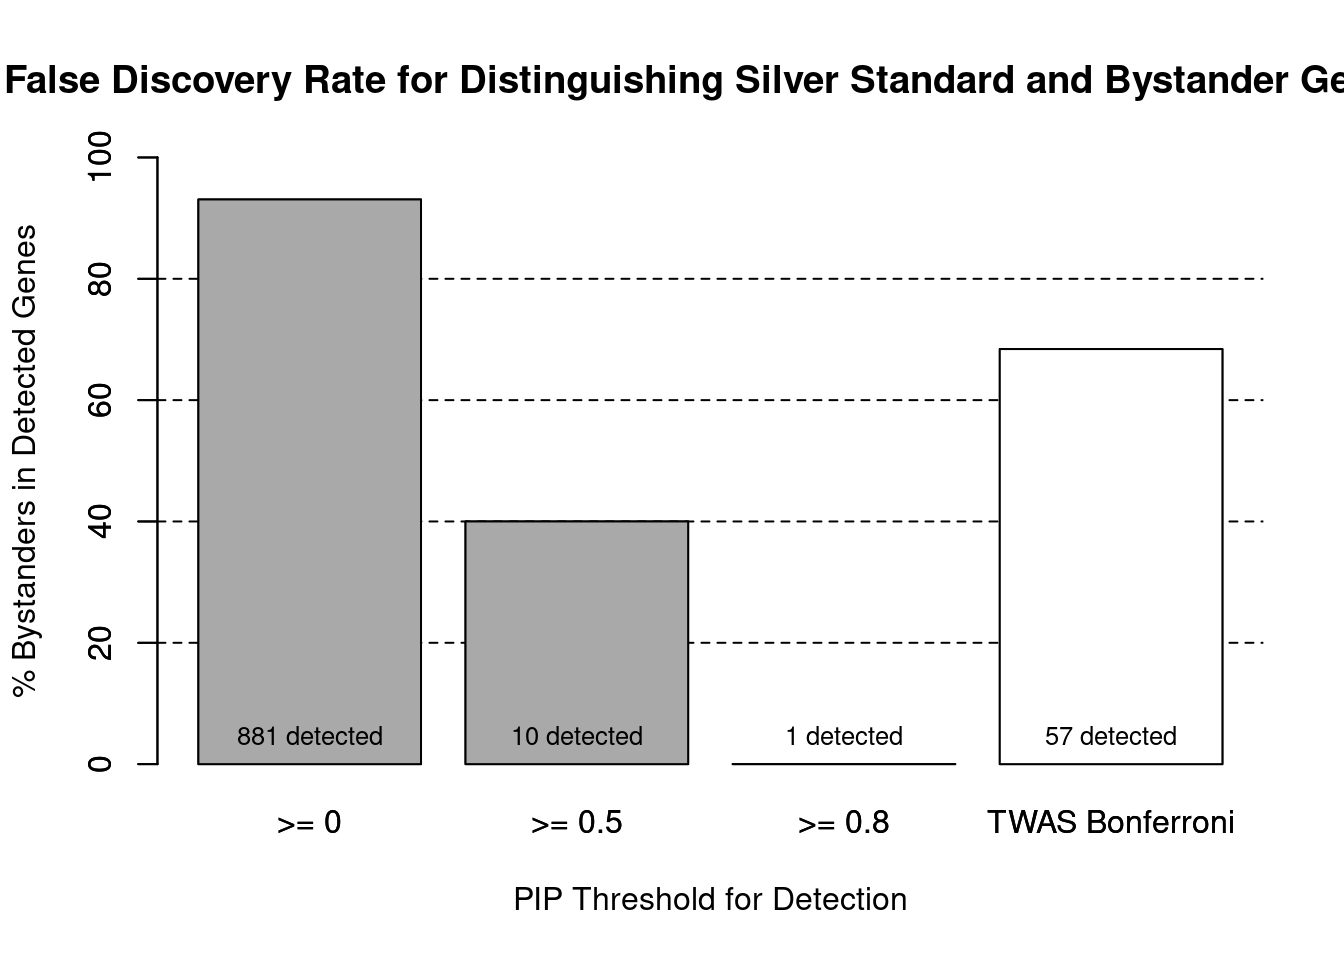
cTWAS is more precise than TWAS in distinguishing silver standard and bystander genes
#number of genes in known annotations (with imputed expression)
print(length(known_annotations))[1] 61#number of bystander genes (with imputed expression)
print(length(unrelated_genes))[1] 820#subset results to genes in known annotations or bystanders
ctwas_gene_res_subset <- ctwas_gene_res[ctwas_gene_res$genename %in% c(known_annotations, unrelated_genes),]
#assign ctwas and TWAS genes
ctwas_genes <- ctwas_gene_res_subset$genename[ctwas_gene_res_subset$susie_pip>0.8]
twas_genes <- ctwas_gene_res_subset$genename[abs(ctwas_gene_res_subset$z)>sig_thresh]
#significance threshold for TWAS
print(sig_thresh)
[1] 4.59#number of ctwas genes (in known annotations or bystanders)
length(ctwas_genes)[1] 1#number of TWAS genes (in known annotations or bystanders)
length(twas_genes)[1] 57#sensitivity / recall
sensitivity ctwas TWAS
0.01639 0.29508 #specificity / (1 - False Positive Rate)
specificity ctwas TWAS
1.0000 0.9524 #precision / PPV / (1 - False Discovery Rate)
precision ctwas TWAS
1.0000 0.3158 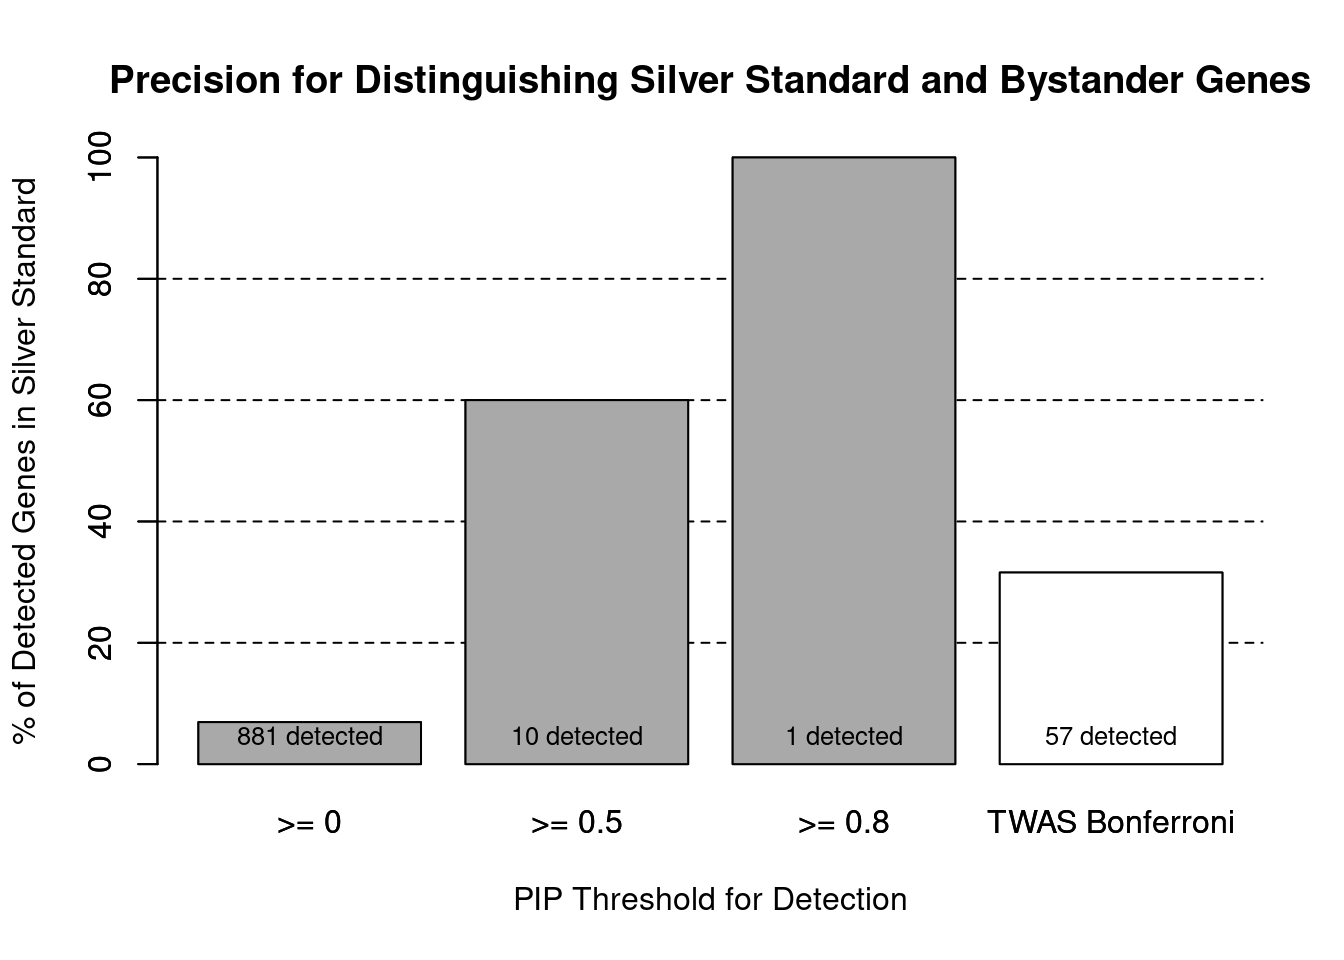
pip_range <- (0:1000)/1000
sensitivity <- rep(NA, length(pip_range))
specificity <- rep(NA, length(pip_range))

for (index in 1:length(pip_range)){
  pip <- pip_range[index]
  ctwas_genes <- ctwas_gene_res_subset$genename[ctwas_gene_res_subset$susie_pip>=pip]
  sensitivity[index] <- sum(ctwas_genes %in% known_annotations)/length(known_annotations)
  specificity[index] <- sum(!(unrelated_genes %in% ctwas_genes))/length(unrelated_genes)
}

plot(1-specificity, sensitivity, type="l", xlim=c(0,1), ylim=c(0,1), main="", xlab="1 - Specificity", ylab="Sensitivity")
title(expression("ROC Curve for cTWAS (black) and TWAS (" * phantom("red") * ")"))
title(expression(phantom("ROC Curve for cTWAS (black) and TWAS (") * "red" * phantom(")")), col.main="red")

sig_thresh_range <- seq(from=0, to=max(abs(ctwas_gene_res_subset$z)), length.out=length(pip_range))

for (index in 1:length(sig_thresh_range)){
  sig_thresh_plot <- sig_thresh_range[index]
  twas_genes <- ctwas_gene_res_subset$genename[abs(ctwas_gene_res_subset$z)>=sig_thresh_plot]
  sensitivity[index] <- sum(twas_genes %in% known_annotations)/length(known_annotations)
  specificity[index] <- sum(!(unrelated_genes %in% twas_genes))/length(unrelated_genes)
}

lines(1-specificity, sensitivity, xlim=c(0,1), ylim=c(0,1), col="red", lty=1)

abline(a=0,b=1,lty=3)

#add previously computed points from the analysis
ctwas_genes <- ctwas_gene_res_subset$genename[ctwas_gene_res_subset$susie_pip>0.8]
twas_genes <- ctwas_gene_res_subset$genename[abs(ctwas_gene_res_subset$z)>sig_thresh]

points(1-specificity_plot["ctwas"], sensitivity_plot["ctwas"], pch=21, bg="black")
points(1-specificity_plot["TWAS"], sensitivity_plot["TWAS"], pch=21, bg="red")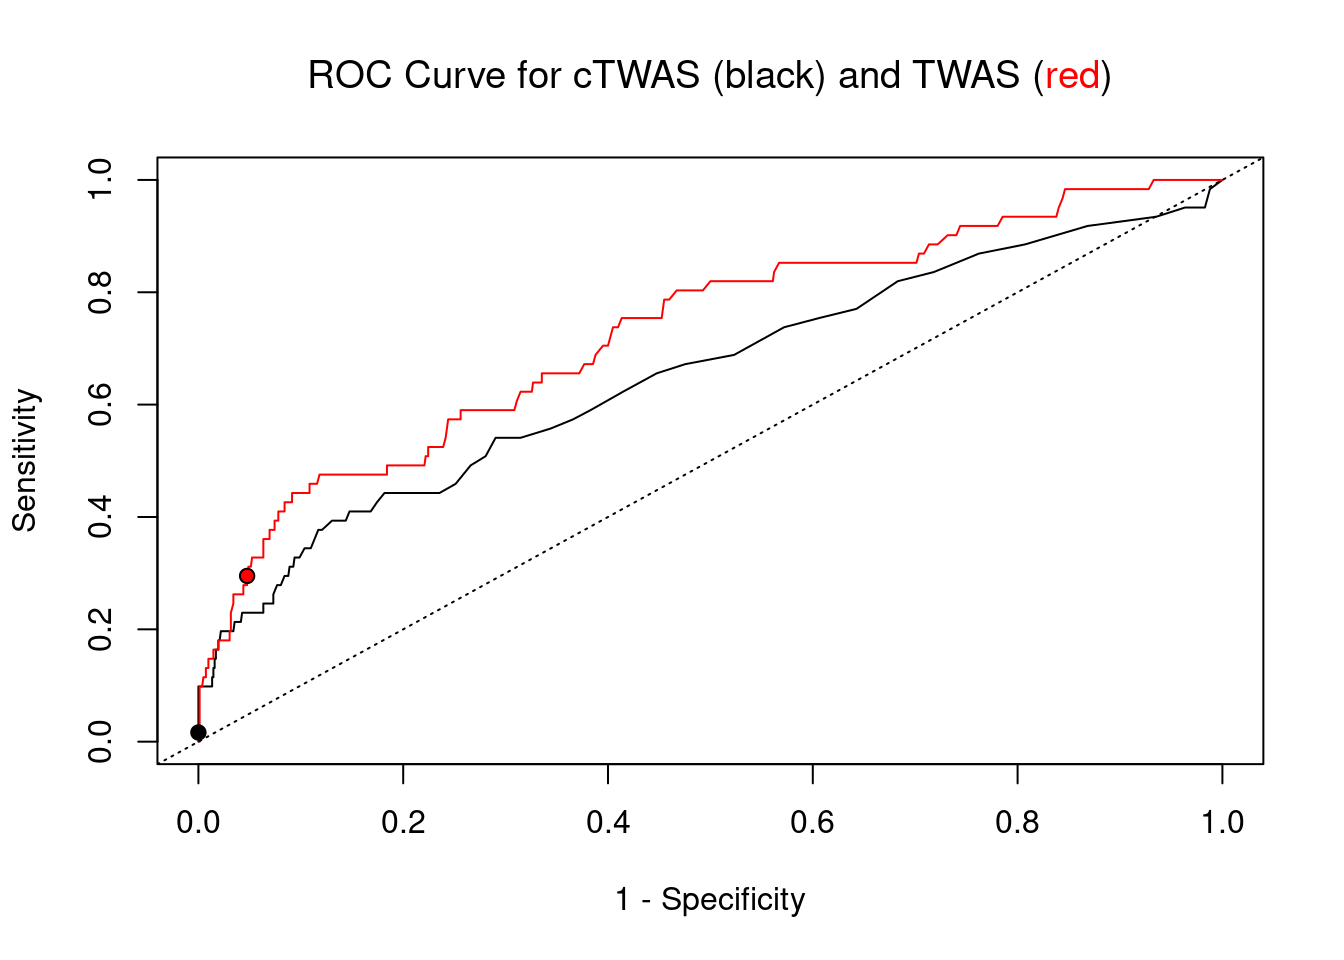
Undetected silver standard genes have low TWAS z-scores or stronger signal from nearby variants
#table of outcomes for silver standard genes
-sort(-table(silver_standard_case))
silver_standard_case
Not Imputed Insignificant z-score Nearby SNP(s)
69 43 17
Detected (PIP > 0.8)
1 #show inconclusive genes
silver_standard_case[silver_standard_case=="Inconclusive"]named character(0)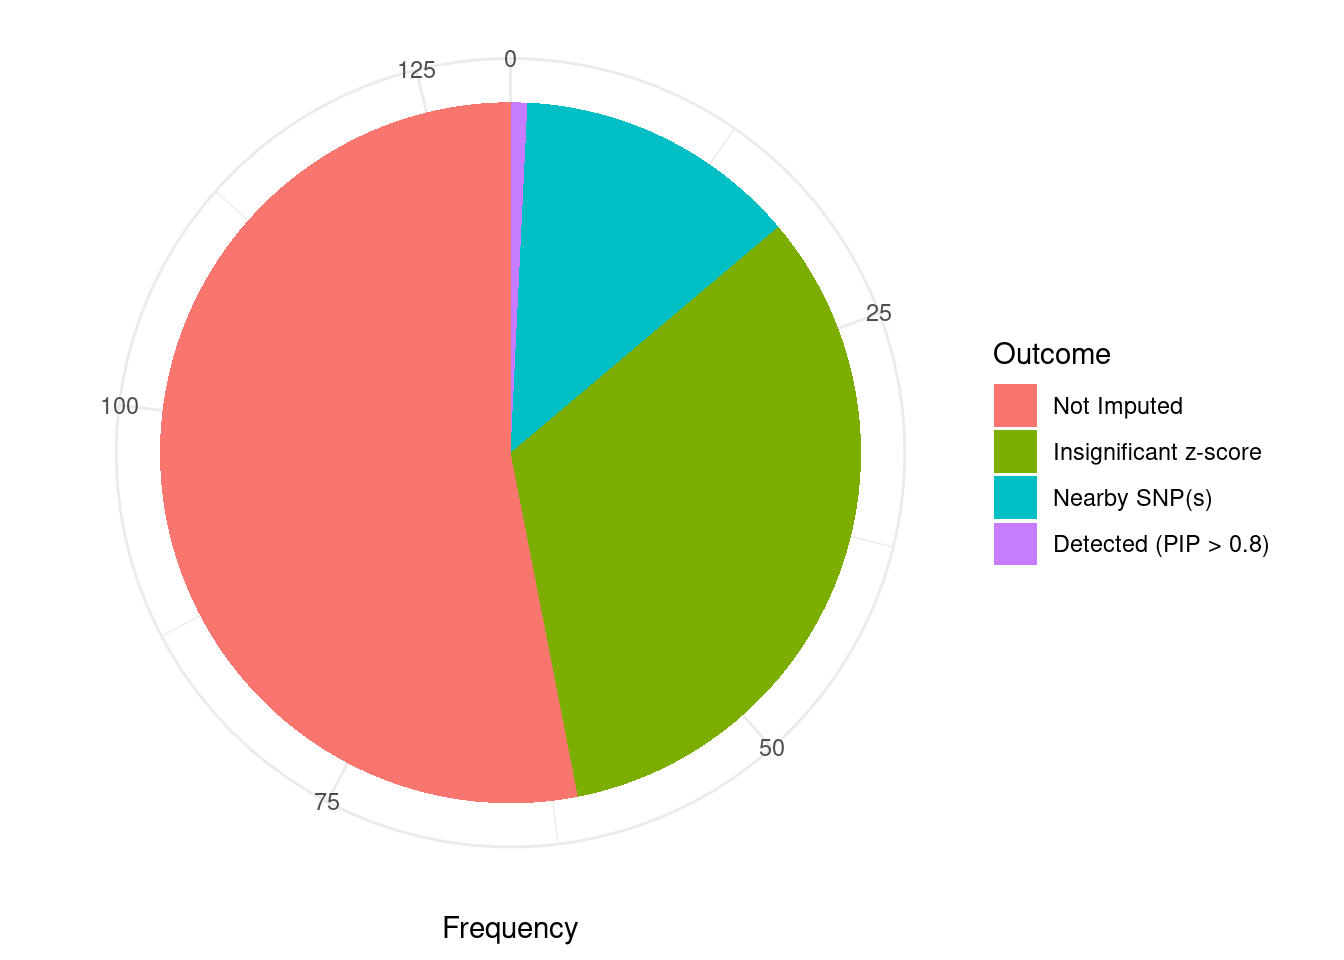
sessionInfo()R version 3.6.1 (2019-07-05)
Platform: x86_64-pc-linux-gnu (64-bit)
Running under: Scientific Linux 7.4 (Nitrogen)
Matrix products: default
BLAS/LAPACK: /software/openblas-0.2.19-el7-x86_64/lib/libopenblas_haswellp-r0.2.19.so
locale:
[1] LC_CTYPE=en_US.UTF-8 LC_NUMERIC=C
[3] LC_TIME=en_US.UTF-8 LC_COLLATE=en_US.UTF-8
[5] LC_MONETARY=en_US.UTF-8 LC_MESSAGES=en_US.UTF-8
[7] LC_PAPER=en_US.UTF-8 LC_NAME=C
[9] LC_ADDRESS=C LC_TELEPHONE=C
[11] LC_MEASUREMENT=en_US.UTF-8 LC_IDENTIFICATION=C
attached base packages:
[1] parallel stats4 stats graphics grDevices utils datasets
[8] methods base
other attached packages:
[1] GenomicRanges_1.36.1 GenomeInfoDb_1.20.0 IRanges_2.18.1
[4] S4Vectors_0.22.1 BiocGenerics_0.30.0 biomaRt_2.40.1
[7] readxl_1.3.1 forcats_0.5.1 stringr_1.4.0
[10] dplyr_1.0.7 purrr_0.3.4 readr_2.1.1
[13] tidyr_1.1.4 tidyverse_1.3.1 tibble_3.1.6
[16] WebGestaltR_0.4.4 disgenet2r_0.99.2 enrichR_3.0
[19] cowplot_1.1.1 ggplot2_3.3.5 workflowr_1.7.0
loaded via a namespace (and not attached):
[1] ggbeeswarm_0.6.0 colorspace_2.0-2 rjson_0.2.20
[4] ellipsis_0.3.2 rprojroot_2.0.2 XVector_0.24.0
[7] fs_1.5.2 rstudioapi_0.13 farver_2.1.0
[10] ggrepel_0.9.1 bit64_4.0.5 AnnotationDbi_1.46.0
[13] fansi_1.0.2 lubridate_1.8.0 xml2_1.3.3
[16] codetools_0.2-16 doParallel_1.0.17 cachem_1.0.6
[19] knitr_1.36 jsonlite_1.7.2 apcluster_1.4.8
[22] Cairo_1.5-12.2 broom_0.7.10 dbplyr_2.1.1
[25] compiler_3.6.1 httr_1.4.2 backports_1.4.1
[28] assertthat_0.2.1 Matrix_1.2-18 fastmap_1.1.0
[31] cli_3.1.0 later_0.8.0 prettyunits_1.1.1
[34] htmltools_0.5.2 tools_3.6.1 igraph_1.2.10
[37] GenomeInfoDbData_1.2.1 gtable_0.3.0 glue_1.6.2
[40] reshape2_1.4.4 doRNG_1.8.2 Rcpp_1.0.8
[43] Biobase_2.44.0 cellranger_1.1.0 jquerylib_0.1.4
[46] vctrs_0.3.8 svglite_1.2.2 iterators_1.0.14
[49] xfun_0.29 ps_1.6.0 rvest_1.0.2
[52] lifecycle_1.0.1 rngtools_1.5.2 XML_3.99-0.3
[55] zlibbioc_1.30.0 getPass_0.2-2 scales_1.1.1
[58] vroom_1.5.7 hms_1.1.1 promises_1.0.1
[61] yaml_2.2.1 curl_4.3.2 memoise_2.0.1
[64] ggrastr_1.0.1 gdtools_0.1.9 stringi_1.7.6
[67] RSQLite_2.2.8 highr_0.9 foreach_1.5.2
[70] rlang_1.0.1 pkgconfig_2.0.3 bitops_1.0-7
[73] evaluate_0.14 lattice_0.20-38 labeling_0.4.2
[76] bit_4.0.4 processx_3.5.2 tidyselect_1.1.1
[79] plyr_1.8.6 magrittr_2.0.2 R6_2.5.1
[82] generics_0.1.1 DBI_1.1.2 pillar_1.6.4
[85] haven_2.4.3 whisker_0.3-2 withr_2.4.3
[88] RCurl_1.98-1.5 modelr_0.1.8 crayon_1.5.0
[91] utf8_1.2.2 tzdb_0.2.0 rmarkdown_2.11
[94] progress_1.2.2 grid_3.6.1 data.table_1.14.2
[97] blob_1.2.2 callr_3.7.0 git2r_0.26.1
[100] reprex_2.0.1 digest_0.6.29 httpuv_1.5.1
[103] munsell_0.5.0 beeswarm_0.2.3 vipor_0.4.5