SCZ - Brain Cerebellum
sheng Qian
2021-2-6
Last updated: 2022-03-16
Checks: 5 2
Knit directory: cTWAS_analysis/
This reproducible R Markdown analysis was created with workflowr (version 1.7.0). The Checks tab describes the reproducibility checks that were applied when the results were created. The Past versions tab lists the development history.
The R Markdown is untracked by Git. To know which version of the R Markdown file created these results, you’ll want to first commit it to the Git repo. If you’re still working on the analysis, you can ignore this warning. When you’re finished, you can run wflow_publish to commit the R Markdown file and build the HTML.
Great job! The global environment was empty. Objects defined in the global environment can affect the analysis in your R Markdown file in unknown ways. For reproduciblity it’s best to always run the code in an empty environment.
The command set.seed(20211220) was run prior to running the code in the R Markdown file. Setting a seed ensures that any results that rely on randomness, e.g. subsampling or permutations, are reproducible.
Great job! Recording the operating system, R version, and package versions is critical for reproducibility.
Nice! There were no cached chunks for this analysis, so you can be confident that you successfully produced the results during this run.
Using absolute paths to the files within your workflowr project makes it difficult for you and others to run your code on a different machine. Change the absolute path(s) below to the suggested relative path(s) to make your code more reproducible.
| absolute | relative |
|---|---|
| /project2/xinhe/shengqian/cTWAS/cTWAS_analysis/data/ | data |
| /project2/xinhe/shengqian/cTWAS/cTWAS_analysis/code/ctwas_config.R | code/ctwas_config.R |
Great! You are using Git for version control. Tracking code development and connecting the code version to the results is critical for reproducibility.
The results in this page were generated with repository version d57314b. See the Past versions tab to see a history of the changes made to the R Markdown and HTML files.
Note that you need to be careful to ensure that all relevant files for the analysis have been committed to Git prior to generating the results (you can use wflow_publish or wflow_git_commit). workflowr only checks the R Markdown file, but you know if there are other scripts or data files that it depends on. Below is the status of the Git repository when the results were generated:
Ignored files:
    Ignored:    .ipynb_checkpoints/
    Ignored:    data/AF/

Untracked files:
    Untracked:  Rplot.png
    Untracked:  analysis/.ipynb_checkpoints/
    Untracked:  analysis/SCZ_2020_Brain_Amygdala.Rmd
    Untracked:  analysis/SCZ_2020_Brain_Anterior_cingulate_cortex_BA24.Rmd
    Untracked:  analysis/SCZ_2020_Brain_Caudate_basal_ganglia.Rmd
    Untracked:  analysis/SCZ_2020_Brain_Cerebellar_Hemisphere.Rmd
    Untracked:  analysis/SCZ_2020_Brain_Cerebellum.Rmd
    Untracked:  analysis/SCZ_2020_Brain_Hippocampus.Rmd
    Untracked:  analysis/SCZ_2020_Brain_Nucleus_accumbens_basal_ganglia.Rmd
    Untracked:  analysis/SCZ_2020_Brain_Spinal_cord_cervical_c-1.Rmd
    Untracked:  analysis/SCZ_2020_Brain_Substantia_nigra.Rmd
    Untracked:  code/.ipynb_checkpoints/
    Untracked:  code/AF_out/
    Untracked:  code/Autism_out/
    Untracked:  code/BMI_S_out/
    Untracked:  code/BMI_out/
    Untracked:  code/Glucose_out/
    Untracked:  code/LDL_S_out/
    Untracked:  code/SCZ_2014_EUR_out/
    Untracked:  code/SCZ_2020_out/
    Untracked:  code/SCZ_S_out/
    Untracked:  code/SCZ_out/
    Untracked:  code/T2D_out/
    Untracked:  code/ctwas_config.R
    Untracked:  code/mapping.R
    Untracked:  code/out/
    Untracked:  code/run_AF_analysis.sbatch
    Untracked:  code/run_AF_analysis.sh
    Untracked:  code/run_AF_ctwas_rss_LDR.R
    Untracked:  code/run_Autism_analysis.sbatch
    Untracked:  code/run_Autism_analysis.sh
    Untracked:  code/run_Autism_ctwas_rss_LDR.R
    Untracked:  code/run_BMI_analysis.sbatch
    Untracked:  code/run_BMI_analysis.sh
    Untracked:  code/run_BMI_analysis_S.sbatch
    Untracked:  code/run_BMI_analysis_S.sh
    Untracked:  code/run_BMI_ctwas_rss_LDR.R
    Untracked:  code/run_BMI_ctwas_rss_LDR_S.R
    Untracked:  code/run_Glucose_analysis.sbatch
    Untracked:  code/run_Glucose_analysis.sh
    Untracked:  code/run_Glucose_ctwas_rss_LDR.R
    Untracked:  code/run_LDL_analysis_S.sbatch
    Untracked:  code/run_LDL_analysis_S.sh
    Untracked:  code/run_LDL_ctwas_rss_LDR_S.R
    Untracked:  code/run_SCZ_2014_EUR_analysis.sbatch
    Untracked:  code/run_SCZ_2014_EUR_analysis.sh
    Untracked:  code/run_SCZ_2014_EUR_ctwas_rss_LDR.R
    Untracked:  code/run_SCZ_2020_analysis.sbatch
    Untracked:  code/run_SCZ_2020_analysis.sh
    Untracked:  code/run_SCZ_2020_ctwas_rss_LDR.R
    Untracked:  code/run_SCZ_analysis.sbatch
    Untracked:  code/run_SCZ_analysis.sh
    Untracked:  code/run_SCZ_analysis_S.sbatch
    Untracked:  code/run_SCZ_analysis_S.sh
    Untracked:  code/run_SCZ_ctwas_rss_LDR.R
    Untracked:  code/run_SCZ_ctwas_rss_LDR_S.R
    Untracked:  code/run_T2D_analysis.sbatch
    Untracked:  code/run_T2D_analysis.sh
    Untracked:  code/run_T2D_ctwas_rss_LDR.R
    Untracked:  code/wflow_build.R
    Untracked:  code/wflow_build.sbatch
    Untracked:  data/.ipynb_checkpoints/
    Untracked:  data/BMI/
    Untracked:  data/PGC3_SCZ_wave3_public.v2.tsv
    Untracked:  data/SCZ/
    Untracked:  data/SCZ_2014_EUR/
    Untracked:  data/SCZ_2020/
    Untracked:  data/SCZ_S/
    Untracked:  data/T2D/
    Untracked:  data/UKBB/
    Untracked:  data/UKBB_SNPs_Info.text
    Untracked:  data/gene_OMIM.txt
    Untracked:  data/gene_pip_0.8.txt
    Untracked:  data/mashr_Heart_Atrial_Appendage.db
    Untracked:  data/mashr_sqtl/
    Untracked:  data/summary_known_genes_annotations.xlsx
    Untracked:  data/untitled.txt

Unstaged changes:
    Modified:   analysis/SCZ_2020_Brain_Cortex.Rmd
    Modified:   analysis/SCZ_2020_Brain_Frontal_Cortex_BA9.Rmd
    Modified:   analysis/SCZ_2020_Brain_Hypothalamus.Rmd
    Modified:   analysis/SCZ_2020_Brain_Putamen_basal_ganglia.Rmd
Note that any generated files, e.g. HTML, png, CSS, etc., are not included in this status report because it is ok for generated content to have uncommitted changes.
There are no past versions. Publish this analysis with wflow_publish() to start tracking its development.
Weight QC
#number of imputed weights
nrow(qclist_all)
[1] 11545#number of imputed weights by chromosome
table(qclist_all$chr)
   1    2    3    4    5    6    7    8    9   10   11   12   13   14   15   16
1117  804  666  419  565  647  572  430  445  459  692  655  227  380  381  540
  17   18   19   20   21   22
 701  176  906  341  127  295
#number of imputed weights without missing variants
sum(qclist_all$nmiss==0)[1] 8808#proportion of imputed weights without missing variants
mean(qclist_all$nmiss==0)[1] 0.7629Check convergence of parameters
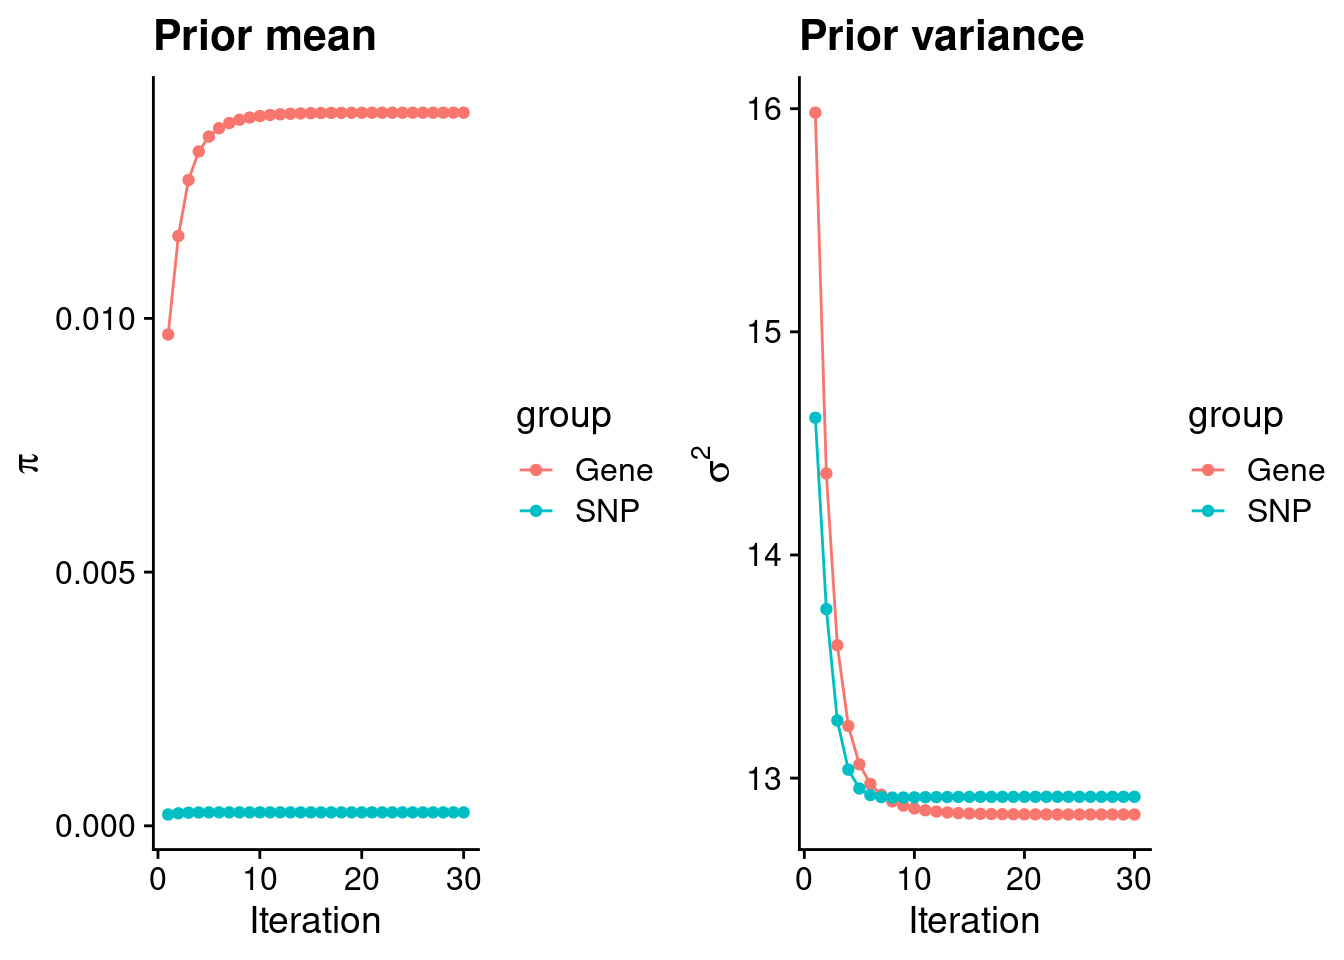
#estimated group prior
estimated_group_prior <- group_prior_rec[,ncol(group_prior_rec)]
names(estimated_group_prior) <- c("gene", "snp")
estimated_group_prior["snp"] <- estimated_group_prior["snp"]*thin #adjust parameter to account for thin argument
print(estimated_group_prior)
gene snp
0.0140541 0.0002651 #estimated group prior variance
estimated_group_prior_var <- group_prior_var_rec[,ncol(group_prior_var_rec)]
names(estimated_group_prior_var) <- c("gene", "snp")
print(estimated_group_prior_var) gene snp
12.84 12.92 #report sample size
print(sample_size)[1] 161405#report group size
group_size <- c(nrow(ctwas_gene_res), n_snps)
print(group_size)[1] 11545 7394310#estimated group PVE
estimated_group_pve <- estimated_group_prior_var*estimated_group_prior*group_size/sample_size #check PVE calculation
names(estimated_group_pve) <- c("gene", "snp")
print(estimated_group_pve) gene snp
0.0129 0.1568 #compare sum(PIP*mu2/sample_size) with above PVE calculation
c(sum(ctwas_gene_res$PVE),sum(ctwas_snp_res$PVE))[1] 0.05055 0.78974Genes with highest PIPs
        genename region_tag susie_pip   mu2       PVE      z num_eqtl
5873      GALNT2      1_117    0.9848 32.17 1.963e-04  5.728        2
12285 AC012074.2       2_15    0.9813 30.25 1.839e-04  5.469        1
11129     ZNF823      19_10    0.9789 39.12 2.373e-04  6.273        2
4195       FEZF1       7_74    0.9613 23.41 1.394e-04 -4.656        1
9127     MAP3K11      11_36    0.9385 34.92 2.031e-04 -5.790        2
2539         MMD      17_32    0.9186 25.47 1.450e-04 -4.548        1
2706       TRPV4      12_66    0.9062 24.10 1.353e-04  4.416        1
7609    SERPINI1      3_103    0.9022 24.40 1.364e-04 -4.706        2
753       ATP1B3       3_87    0.8849 20.49 1.123e-04  4.085        1
7164         ACE      17_37    0.8757 33.97 1.843e-04 -5.876        1
5541       FANCI      15_41    0.8704 39.54 2.132e-04 -6.308        1
6249     FAM135B       8_91    0.8693 22.03 1.187e-04 -3.461        1
11430    HLA-DMA       6_27    0.8595 78.23 4.166e-04 -9.703        2
4587        ACY3      11_37    0.8400 19.58 1.019e-04 -3.397        2
3420       ABCG2       4_59    0.8328 20.30 1.047e-04 -3.954        1
3521        SLF2      10_64    0.8172 24.41 1.236e-04 -4.618        2
1289        MLF2       12_7    0.7962 21.44 1.058e-04 -3.939        2
7564      ANTXR2       4_54    0.7715 20.82 9.954e-05  3.831        1
3809      PFKFB2      1_105    0.7655 25.40 1.204e-04  4.891        1
10121      ZNRF3       22_9    0.7652 24.55 1.164e-04 -4.646        1
Genes with largest effect sizes

         genename region_tag susie_pip    mu2       PVE        z num_eqtl
722        RASSF1       3_35 3.464e-14 738.46 1.585e-16   4.3268        1
12132    U73166.2       3_35 3.331e-16 725.82 1.498e-18  -3.8316        1
10677     SLC38A3       3_35 1.352e-12 231.84 1.943e-15  -2.7756        1
122      CACNA2D2       3_35 0.000e+00 211.78 0.000e+00  -0.1392        1
34           RBM6       3_35 3.752e-01 200.14 4.653e-04   4.4688        1
3033        HEMK1       3_35 0.000e+00 183.60 0.000e+00   0.4441        1
7733        CAMKV       3_35 1.323e-04 176.93 1.450e-07  -2.5717        2
10506       HYAL3       3_35 4.805e-13 162.41 4.835e-16  -2.5066        1
11798       IFRD2       3_35 4.805e-13 162.41 4.835e-16  -2.5066        1
207        SEMA3B       3_35 0.000e+00 116.66 0.000e+00   0.6250        1
12064       HCG11       6_20 1.747e-02 114.84 1.243e-05   9.8443        1
13097  CTA-14H9.5       6_20 1.747e-02 114.84 1.243e-05   9.8443        1
13664   LINC02019       3_35 0.000e+00 110.76 0.000e+00   0.3059        2
7729       RNF123       3_35 4.441e-16  98.77 2.718e-19  -2.3252        1
2890       PRSS16       6_21 2.659e-02  95.09 1.567e-05 -11.0498        2
3034         CISH       3_35 0.000e+00  89.05 0.000e+00  -0.8833        1
10473      BTN3A2       6_20 2.928e-02  87.85 1.594e-05   7.8089        2
9834    HIST1H2BC       6_20 1.747e-02  82.66 8.948e-06  -7.9928        1
3007     CYB561D2       3_35 0.000e+00  81.53 0.000e+00   3.5093        1
13535 RP1-86C11.7       6_21 5.223e-01  81.13 2.625e-04  10.5382        1
Genes with highest PVE
         genename region_tag susie_pip    mu2       PVE      z num_eqtl
34           RBM6       3_35    0.3752 200.14 0.0004653  4.469        1
11430     HLA-DMA       6_27    0.8595  78.23 0.0004166 -9.703        2
13535 RP1-86C11.7       6_21    0.5223  81.13 0.0002625 10.538        1
11129      ZNF823      19_10    0.9789  39.12 0.0002373  6.273        2
5541        FANCI      15_41    0.8704  39.54 0.0002132 -6.308        1
7696         GNL3       3_36    0.5554  61.48 0.0002115  9.297        2
9127      MAP3K11      11_36    0.9385  34.92 0.0002031 -5.790        2
5873       GALNT2      1_117    0.9848  32.17 0.0001963  5.728        2
7164          ACE      17_37    0.8757  33.97 0.0001843 -5.876        1
12285  AC012074.2       2_15    0.9813  30.25 0.0001839  5.469        1
12147     ANKRD63      15_14    0.6950  37.72 0.0001624  6.183        1
3127        SF3B1      2_117    0.4697  51.83 0.0001508  7.605        1
5022        ALPK3      15_39    0.4967  48.55 0.0001494 -7.198        1
2539          MMD      17_32    0.9186  25.47 0.0001450 -4.548        1
4195        FEZF1       7_74    0.9613  23.41 0.0001394 -4.656        1
11348        NAGA      22_17    0.6974  32.25 0.0001393  7.211        2
7609     SERPINI1      3_103    0.9022  24.40 0.0001364 -4.706        2
2706        TRPV4      12_66    0.9062  24.10 0.0001353  4.416        1
3521         SLF2      10_64    0.8172  24.41 0.0001236 -4.618        2
7473       SLC9C2       1_85    0.6256  31.86 0.0001235 -6.146        1
Genes with largest z scores
         genename region_tag susie_pip    mu2       PVE       z num_eqtl
2890       PRSS16       6_21 0.0265899  95.09 1.567e-05 -11.050        2
13535 RP1-86C11.7       6_21 0.5223068  81.13 2.625e-04  10.538        1
12543         C4A       6_26 0.1304147  70.64 5.708e-05  10.418        1
12064       HCG11       6_20 0.0174678 114.84 1.243e-05   9.844        1
13097  CTA-14H9.5       6_20 0.0174678 114.84 1.243e-05   9.844        1
11430     HLA-DMA       6_27 0.8594771  78.23 4.166e-04  -9.703        2
12487     HLA-DMB       6_27 0.0844979  74.09 3.879e-05  -9.380        1
7696         GNL3       3_36 0.5553870  61.48 2.115e-04   9.297        2
11441        RNF5       6_26 0.0056087  37.95 1.319e-06   8.765        2
7697        PBRM1       3_36 0.0224563  54.45 7.575e-06  -8.722        1
2725       OGFOD2      12_75 0.0004020  64.42 1.605e-07   8.627        1
9965      ARL6IP4      12_75 0.0003826  64.27 1.524e-07  -8.615        1
8440       GLYCTK       3_36 0.1231524  69.39 5.295e-05   8.577        1
11938   LINC00240       6_21 0.0110127  47.12 3.215e-06  -8.297        1
11484      CCHCR1       6_25 0.0098039  63.87 3.879e-06  -8.245        5
5147        FLOT1       6_24 0.0143588  65.59 5.835e-06  -8.105        3
9818       HARBI1      11_28 0.3192506  58.61 1.159e-04   8.046        1
9327        ATG13      11_28 0.3192506  58.61 1.159e-04  -8.046        1
9834    HIST1H2BC       6_20 0.0174707  82.66 8.948e-06  -7.993        1
10835        TUBB       6_24 0.0138123  60.49 5.177e-06  -7.980        1
Comparing z scores and PIPs
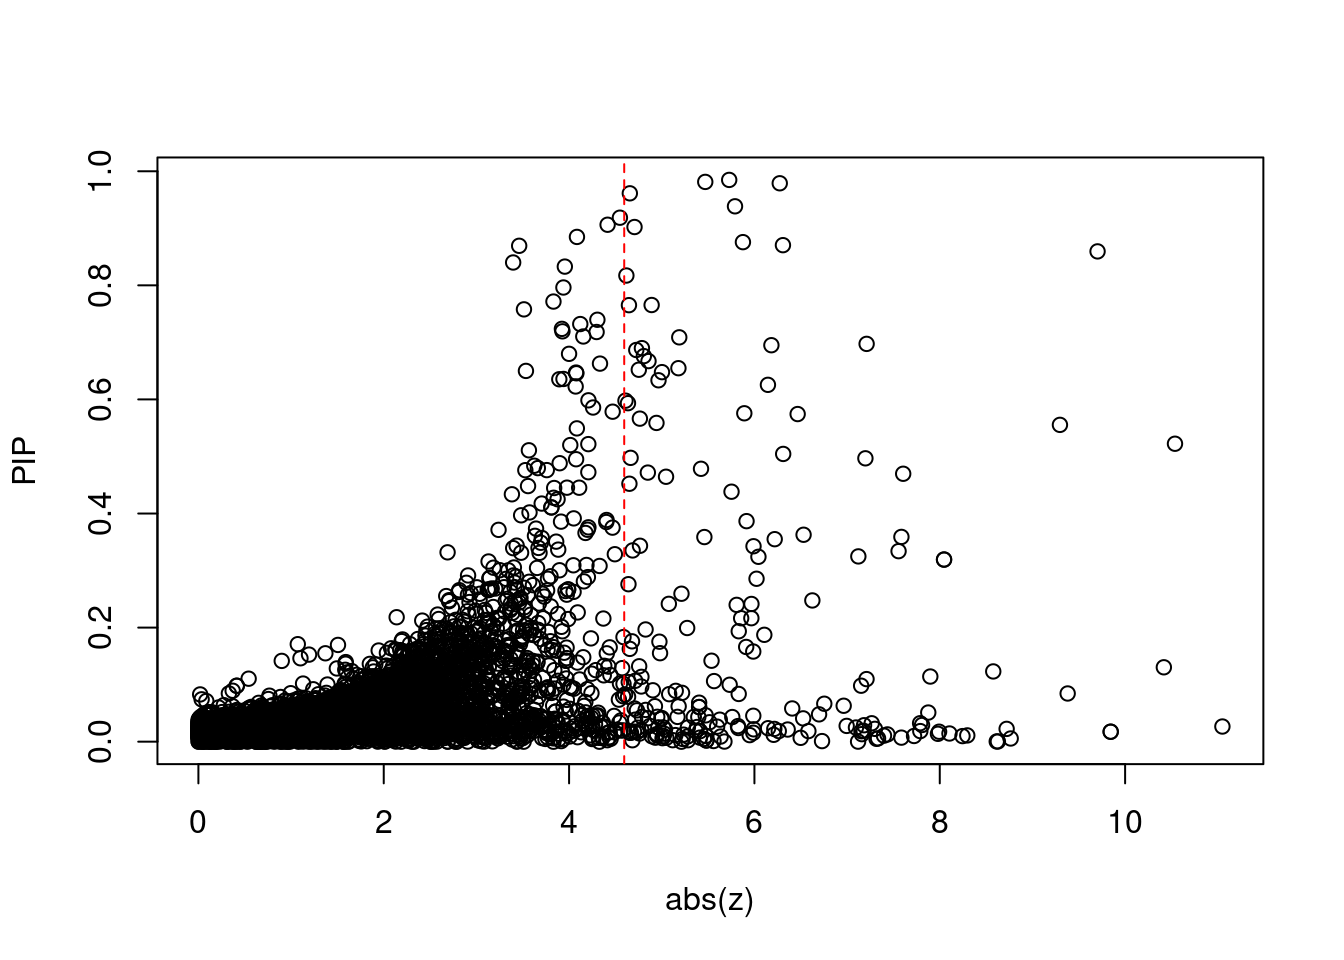
[1] 0.01784Gene with high z-score but low PIP, assign to SNP or to gene?
high_z_genes_region <- unique(head(ctwas_gene_res[order(-abs(ctwas_gene_res$z)),report_cols],40)$region_tag)
sum <- 0
for(i in high_z_genes_region){
  locus <- ctwas_res[ctwas_res$region_tag==i,]
  locus <- head(locus[order(-locus$susie_pip),],20)
  snp_pip <- sum(locus[locus$type == 'SNP','susie_pip'])
  gene_pip <- sum(locus[locus$type == 'gene','susie_pip'])
  print(snp_pip/(snp_pip+gene_pip))
}
[1] 0.8582
[1] 0.6929
[1] 0.9413
[1] 0.1099
[1] 0.4675
[1] 0.8757
[1] 0.823
[1] 0.7916
[1] 0.6644
[1] 1
[1] 0.9768
[1] 0.4787
[1] 0.4546
[1] 1
[1] 0.8504
[1] 0.6356
[1] 0.405GO enrichment analysis for genes with PIP>0.5
#number of genes for gene set enrichment
length(genes)
[1] 63Uploading data to Enrichr... Done.
Querying GO_Biological_Process_2021... Done.
Querying GO_Cellular_Component_2021... Done.
Querying GO_Molecular_Function_2021... Done.
Parsing results... Done.
[1] "GO_Biological_Process_2021"
[1] Term             Overlap          Adjusted.P.value Genes
<0 rows> (or 0-length row.names)
[1] "GO_Cellular_Component_2021"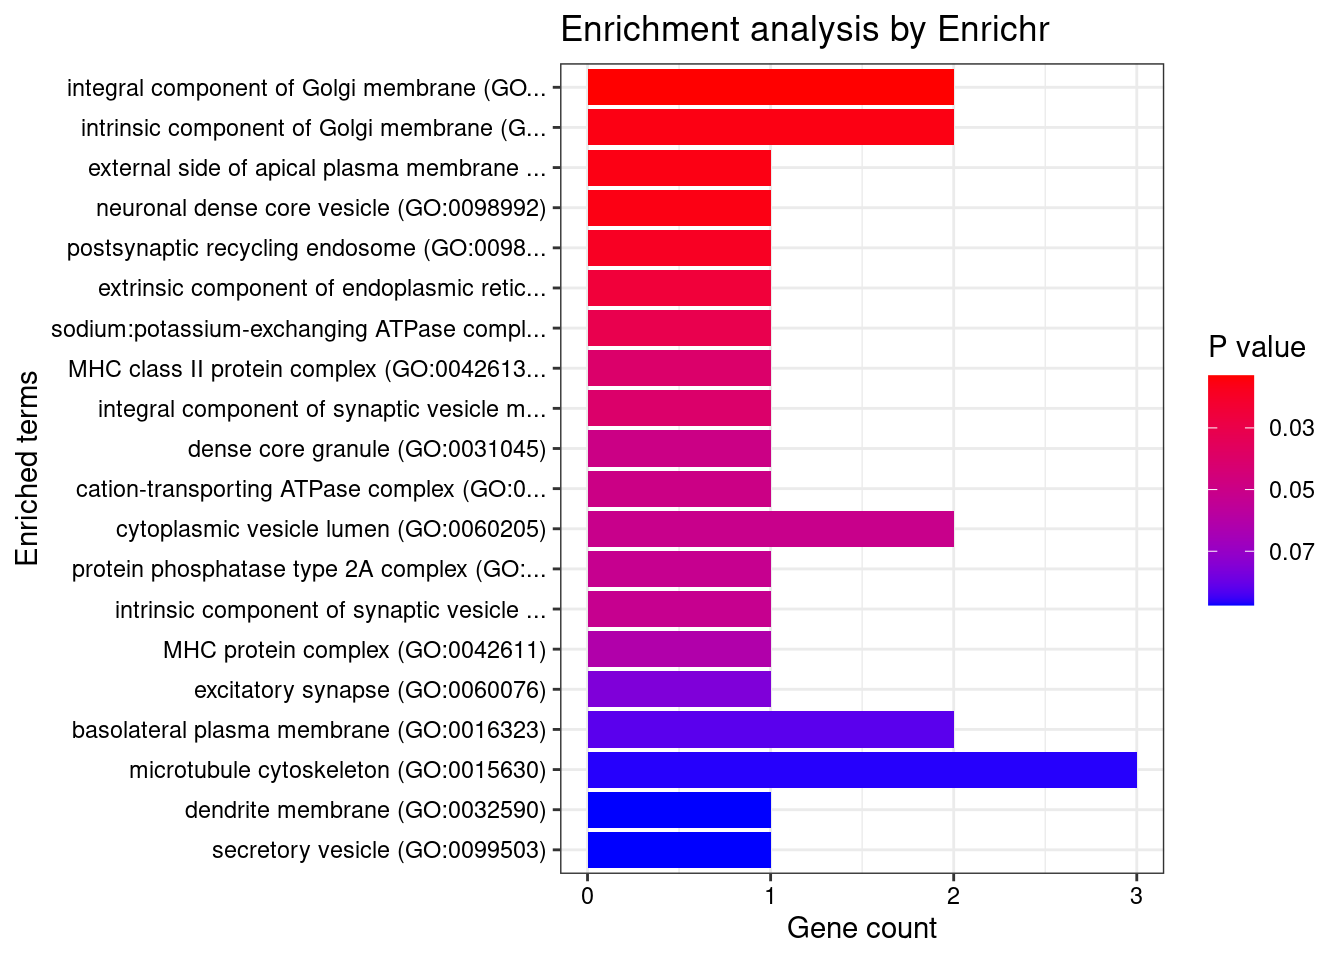
[1] Term             Overlap          Adjusted.P.value Genes
<0 rows> (or 0-length row.names)
[1] "GO_Molecular_Function_2021"
[1] Term             Overlap          Adjusted.P.value Genes
<0 rows> (or 0-length row.names)
DisGeNET enrichment analysis for genes with PIP>0.5
                                      Description    FDR Ratio BgRatio
28                                      Confusion 0.0293  1/27  1/9703
52                           Gingival Hypertrophy 0.0293  1/27  1/9703
70                    Infant, Premature, Diseases 0.0293  1/27  1/9703
109                              Pneumonia, Viral 0.0293  1/27  1/9703
160                             Speech impairment 0.0293  1/27  1/9703
161                                 Derealization 0.0293  1/27  1/9703
176           Burnett Schwartz Berberian syndrome 0.0293  1/27  1/9703
177                     Atrophoderma vermiculatum 0.0293  1/27  1/9703
179 Spondylometaphyseal dysplasia, Kozlowski type 0.0293  1/27  1/9703
180                           Metatropic dwarfism 0.0293  1/27  1/9703
WebGestalt enrichment analysis for genes with PIP>0.5
Loading the functional categories...
Loading the ID list...
Loading the reference list...
Performing the enrichment analysis...
Warning in oraEnrichment(interestGeneList, referenceGeneList, geneSet, minNum =
minNum, : No significant gene set is identified based on FDR 0.05!NULLPIP Manhattan Plot
Warning: 'timedatectl' indicates the non-existent timezone name 'n/a'Warning: Your system is mis-configured: '/etc/localtime' is not a symlinkWarning: It is strongly recommended to set envionment variable TZ to 'America/
Chicago' (or equivalent)Warning: ggrepel: 22 unlabeled data points (too many overlaps). Consider
increasing max.overlaps
Sensitivity, specificity and precision for silver standard genes
#number of genes in known annotations
print(length(known_annotations))
[1] 130#number of genes in known annotations with imputed expression
print(sum(known_annotations %in% ctwas_gene_res$genename))[1] 68#significance threshold for TWAS
print(sig_thresh)[1] 4.595#number of ctwas genes
length(ctwas_genes)[1] 16#number of TWAS genes
length(twas_genes)[1] 206#show novel genes (ctwas genes with not in TWAS genes)
ctwas_gene_res[ctwas_gene_res$genename %in% novel_genes,report_cols] genename region_tag susie_pip mu2 PVE z num_eqtl
753 ATP1B3 3_87 0.8849 20.49 0.0001123 4.085 1
3420 ABCG2 4_59 0.8328 20.30 0.0001047 -3.954 1
6249 FAM135B 8_91 0.8693 22.03 0.0001187 -3.461 1
4587 ACY3 11_37 0.8400 19.58 0.0001019 -3.397 2
2706 TRPV4 12_66 0.9062 24.10 0.0001353 4.416 1
2539 MMD 17_32 0.9186 25.47 0.0001450 -4.548 1#sensitivity / recall
print(sensitivity) ctwas TWAS
0.01538 0.16154 #specificity
print(specificity) ctwas TWAS
0.9988 0.9839 #precision / PPV
print(precision) ctwas TWAS
0.1250 0.1019 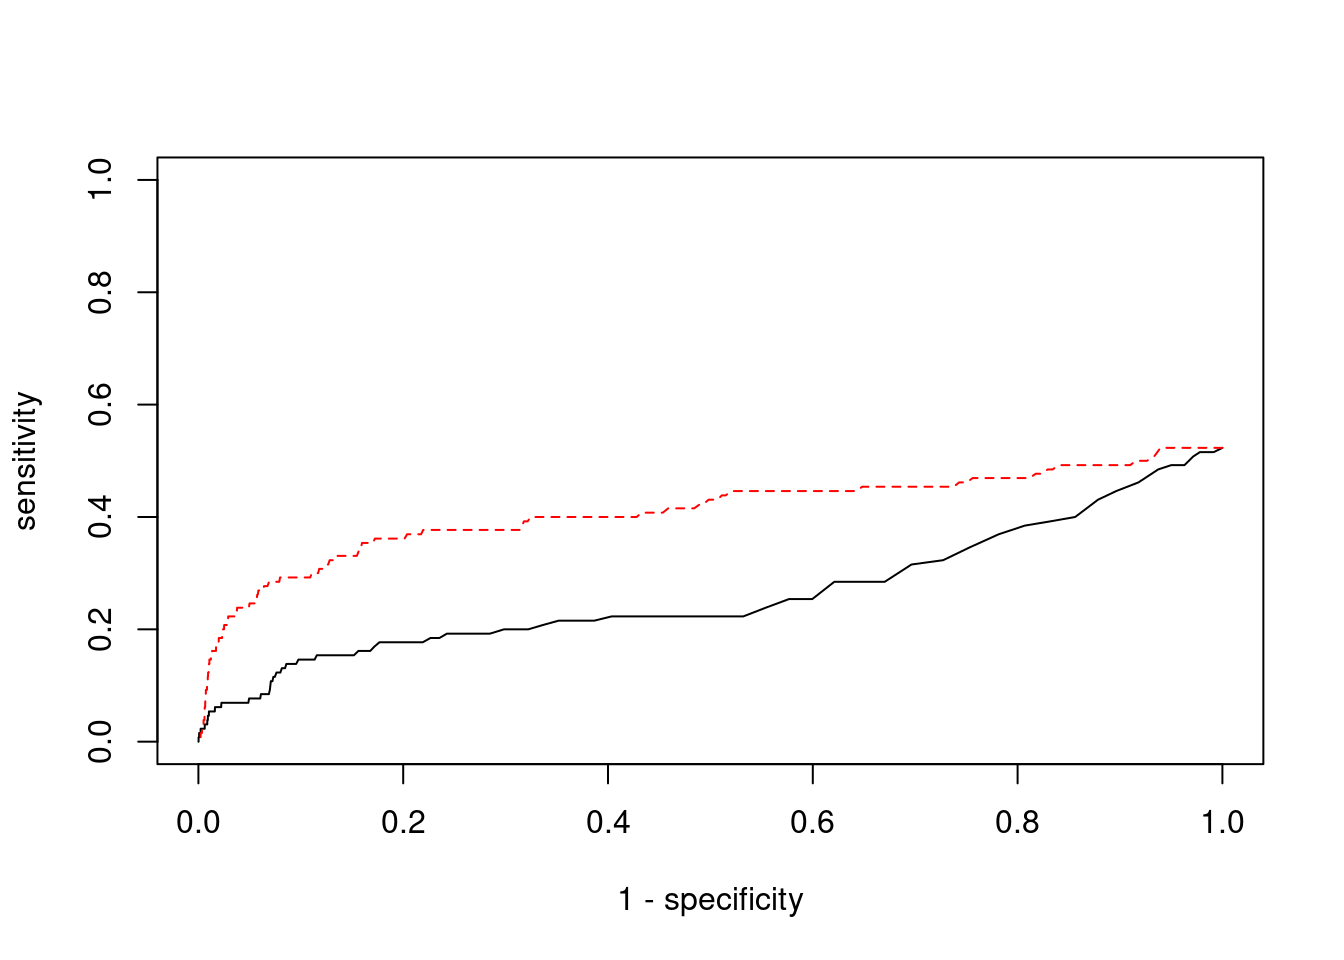
cTWAS is more precise than TWAS in distinguishing silver standard and bystander genes
#number of genes in known annotations (with imputed expression)
print(length(known_annotations))[1] 68#number of bystander genes (with imputed expression)
print(length(unrelated_genes))[1] 817#subset results to genes in known annotations or bystanders
ctwas_gene_res_subset <- ctwas_gene_res[ctwas_gene_res$genename %in% c(known_annotations, unrelated_genes),]
#assign ctwas and TWAS genes
ctwas_genes <- ctwas_gene_res_subset$genename[ctwas_gene_res_subset$susie_pip>0.8]
twas_genes <- ctwas_gene_res_subset$genename[abs(ctwas_gene_res_subset$z)>sig_thresh]
#significance threshold for TWAS
print(sig_thresh)
[1] 4.595#number of ctwas genes (in known annotations or bystanders)
length(ctwas_genes)[1] 4#number of TWAS genes (in known annotations or bystanders)
length(twas_genes)[1] 70#sensitivity / recall
sensitivity ctwas TWAS
0.02941 0.30882 #specificity / (1 - False Positive Rate)
specificity ctwas TWAS
0.9976 0.9400 #precision / PPV / (1 - False Discovery Rate)
precisionctwas TWAS
0.5 0.3 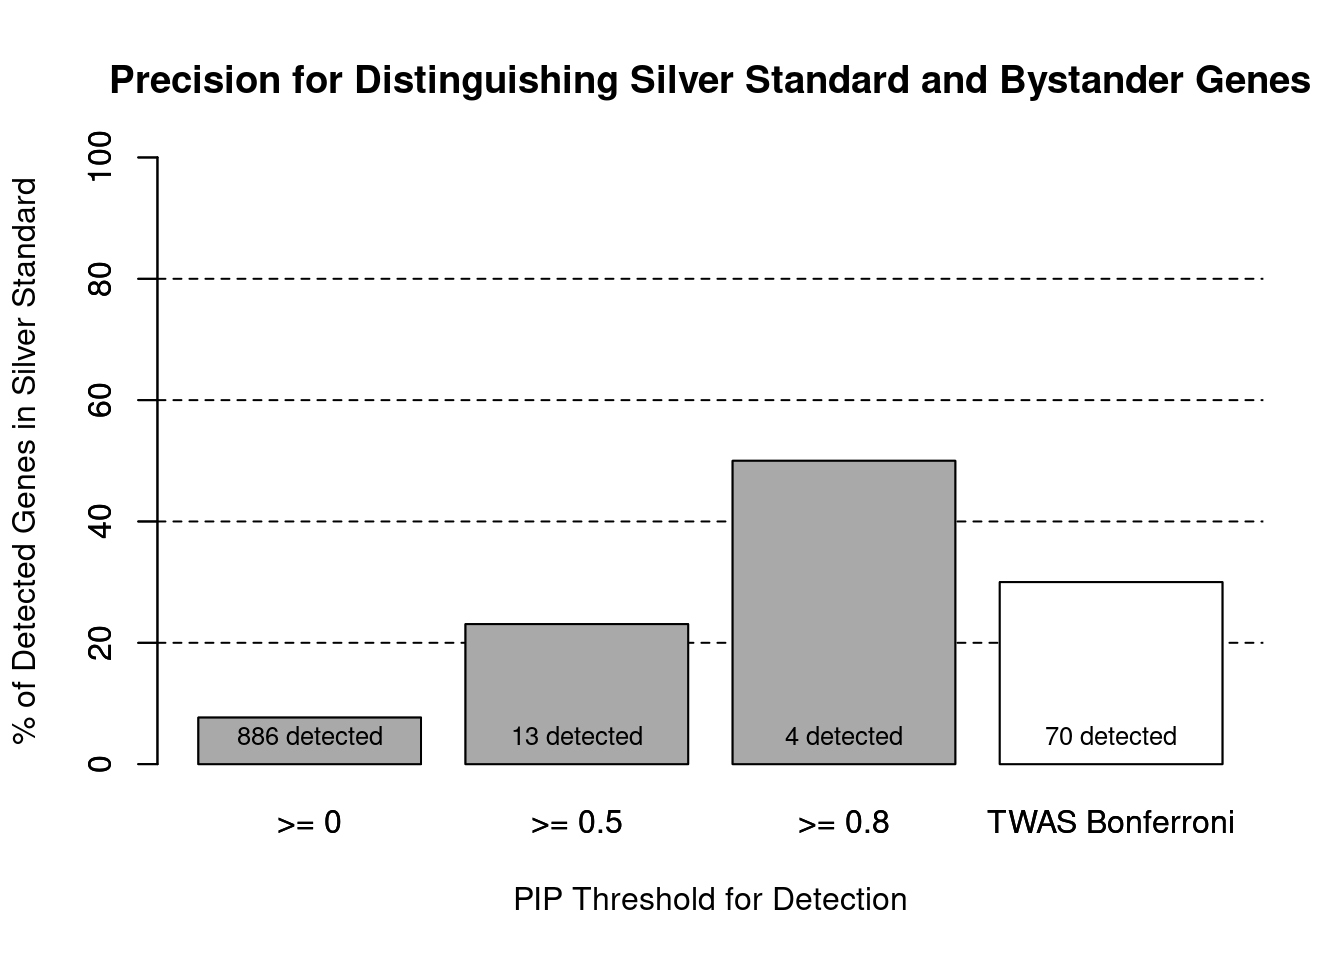

pip_range <- (0:1000)/1000
sensitivity <- rep(NA, length(pip_range))
specificity <- rep(NA, length(pip_range))

for (index in 1:length(pip_range)){
  pip <- pip_range[index]
  ctwas_genes <- ctwas_gene_res_subset$genename[ctwas_gene_res_subset$susie_pip>=pip]
  sensitivity[index] <- sum(ctwas_genes %in% known_annotations)/length(known_annotations)
  specificity[index] <- sum(!(unrelated_genes %in% ctwas_genes))/length(unrelated_genes)
}

plot(1-specificity, sensitivity, type="l", xlim=c(0,1), ylim=c(0,1), main="", xlab="1 - Specificity", ylab="Sensitivity")
title(expression("ROC Curve for cTWAS (black) and TWAS (" * phantom("red") * ")"))
title(expression(phantom("ROC Curve for cTWAS (black) and TWAS (") * "red" * phantom(")")), col.main="red")

sig_thresh_range <- seq(from=0, to=max(abs(ctwas_gene_res_subset$z)), length.out=length(pip_range))

for (index in 1:length(sig_thresh_range)){
  sig_thresh_plot <- sig_thresh_range[index]
  twas_genes <- ctwas_gene_res_subset$genename[abs(ctwas_gene_res_subset$z)>=sig_thresh_plot]
  sensitivity[index] <- sum(twas_genes %in% known_annotations)/length(known_annotations)
  specificity[index] <- sum(!(unrelated_genes %in% twas_genes))/length(unrelated_genes)
}

lines(1-specificity, sensitivity, xlim=c(0,1), ylim=c(0,1), col="red", lty=1)

abline(a=0,b=1,lty=3)

#add previously computed points from the analysis
ctwas_genes <- ctwas_gene_res_subset$genename[ctwas_gene_res_subset$susie_pip>0.8]
twas_genes <- ctwas_gene_res_subset$genename[abs(ctwas_gene_res_subset$z)>sig_thresh]

points(1-specificity_plot["ctwas"], sensitivity_plot["ctwas"], pch=21, bg="black")
points(1-specificity_plot["TWAS"], sensitivity_plot["TWAS"], pch=21, bg="red")
Undetected silver standard genes have low TWAS z-scores or stronger signal from nearby variants
#table of outcomes for silver standard genes
-sort(-table(silver_standard_case))
silver_standard_case
Not Imputed Insignificant z-score Nearby SNP(s)
62 47 19
Detected (PIP > 0.8)
2 #show inconclusive genes
silver_standard_case[silver_standard_case=="Inconclusive"]named character(0)
sessionInfo()R version 3.6.1 (2019-07-05)
Platform: x86_64-pc-linux-gnu (64-bit)
Running under: Scientific Linux 7.4 (Nitrogen)
Matrix products: default
BLAS/LAPACK: /software/openblas-0.2.19-el7-x86_64/lib/libopenblas_haswellp-r0.2.19.so
locale:
[1] LC_CTYPE=en_US.UTF-8 LC_NUMERIC=C
[3] LC_TIME=en_US.UTF-8 LC_COLLATE=en_US.UTF-8
[5] LC_MONETARY=en_US.UTF-8 LC_MESSAGES=en_US.UTF-8
[7] LC_PAPER=en_US.UTF-8 LC_NAME=C
[9] LC_ADDRESS=C LC_TELEPHONE=C
[11] LC_MEASUREMENT=en_US.UTF-8 LC_IDENTIFICATION=C
attached base packages:
[1] parallel stats4 stats graphics grDevices utils datasets
[8] methods base
other attached packages:
[1] GenomicRanges_1.36.1 GenomeInfoDb_1.20.0 IRanges_2.18.1
[4] S4Vectors_0.22.1 BiocGenerics_0.30.0 biomaRt_2.40.1
[7] readxl_1.3.1 forcats_0.5.1 stringr_1.4.0
[10] dplyr_1.0.7 purrr_0.3.4 readr_2.1.1
[13] tidyr_1.1.4 tidyverse_1.3.1 tibble_3.1.6
[16] WebGestaltR_0.4.4 disgenet2r_0.99.2 enrichR_3.0
[19] cowplot_1.1.1 ggplot2_3.3.5 workflowr_1.7.0
loaded via a namespace (and not attached):
[1] ggbeeswarm_0.6.0 colorspace_2.0-2 rjson_0.2.20
[4] ellipsis_0.3.2 rprojroot_2.0.2 XVector_0.24.0
[7] fs_1.5.2 rstudioapi_0.13 farver_2.1.0
[10] ggrepel_0.9.1 bit64_4.0.5 AnnotationDbi_1.46.0
[13] fansi_1.0.2 lubridate_1.8.0 xml2_1.3.3
[16] codetools_0.2-16 doParallel_1.0.17 cachem_1.0.6
[19] knitr_1.36 jsonlite_1.7.2 apcluster_1.4.8
[22] Cairo_1.5-12.2 broom_0.7.10 dbplyr_2.1.1
[25] compiler_3.6.1 httr_1.4.2 backports_1.4.1
[28] assertthat_0.2.1 Matrix_1.2-18 fastmap_1.1.0
[31] cli_3.1.0 later_0.8.0 prettyunits_1.1.1
[34] htmltools_0.5.2 tools_3.6.1 igraph_1.2.10
[37] GenomeInfoDbData_1.2.1 gtable_0.3.0 glue_1.6.2
[40] reshape2_1.4.4 doRNG_1.8.2 Rcpp_1.0.8
[43] Biobase_2.44.0 cellranger_1.1.0 jquerylib_0.1.4
[46] vctrs_0.3.8 svglite_1.2.2 iterators_1.0.14
[49] xfun_0.29 ps_1.6.0 rvest_1.0.2
[52] lifecycle_1.0.1 rngtools_1.5.2 XML_3.99-0.3
[55] zlibbioc_1.30.0 getPass_0.2-2 scales_1.1.1
[58] vroom_1.5.7 hms_1.1.1 promises_1.0.1
[61] yaml_2.2.1 curl_4.3.2 memoise_2.0.1
[64] ggrastr_1.0.1 gdtools_0.1.9 stringi_1.7.6
[67] RSQLite_2.2.8 highr_0.9 foreach_1.5.2
[70] rlang_1.0.1 pkgconfig_2.0.3 bitops_1.0-7
[73] evaluate_0.14 lattice_0.20-38 labeling_0.4.2
[76] bit_4.0.4 processx_3.5.2 tidyselect_1.1.1
[79] plyr_1.8.6 magrittr_2.0.2 R6_2.5.1
[82] generics_0.1.1 DBI_1.1.2 pillar_1.6.4
[85] haven_2.4.3 whisker_0.3-2 withr_2.4.3
[88] RCurl_1.98-1.5 modelr_0.1.8 crayon_1.5.0
[91] utf8_1.2.2 tzdb_0.2.0 rmarkdown_2.11
[94] progress_1.2.2 grid_3.6.1 data.table_1.14.2
[97] blob_1.2.2 callr_3.7.0 git2r_0.26.1
[100] reprex_2.0.1 digest_0.6.29 httpuv_1.5.1
[103] munsell_0.5.0 beeswarm_0.2.3 vipor_0.4.5